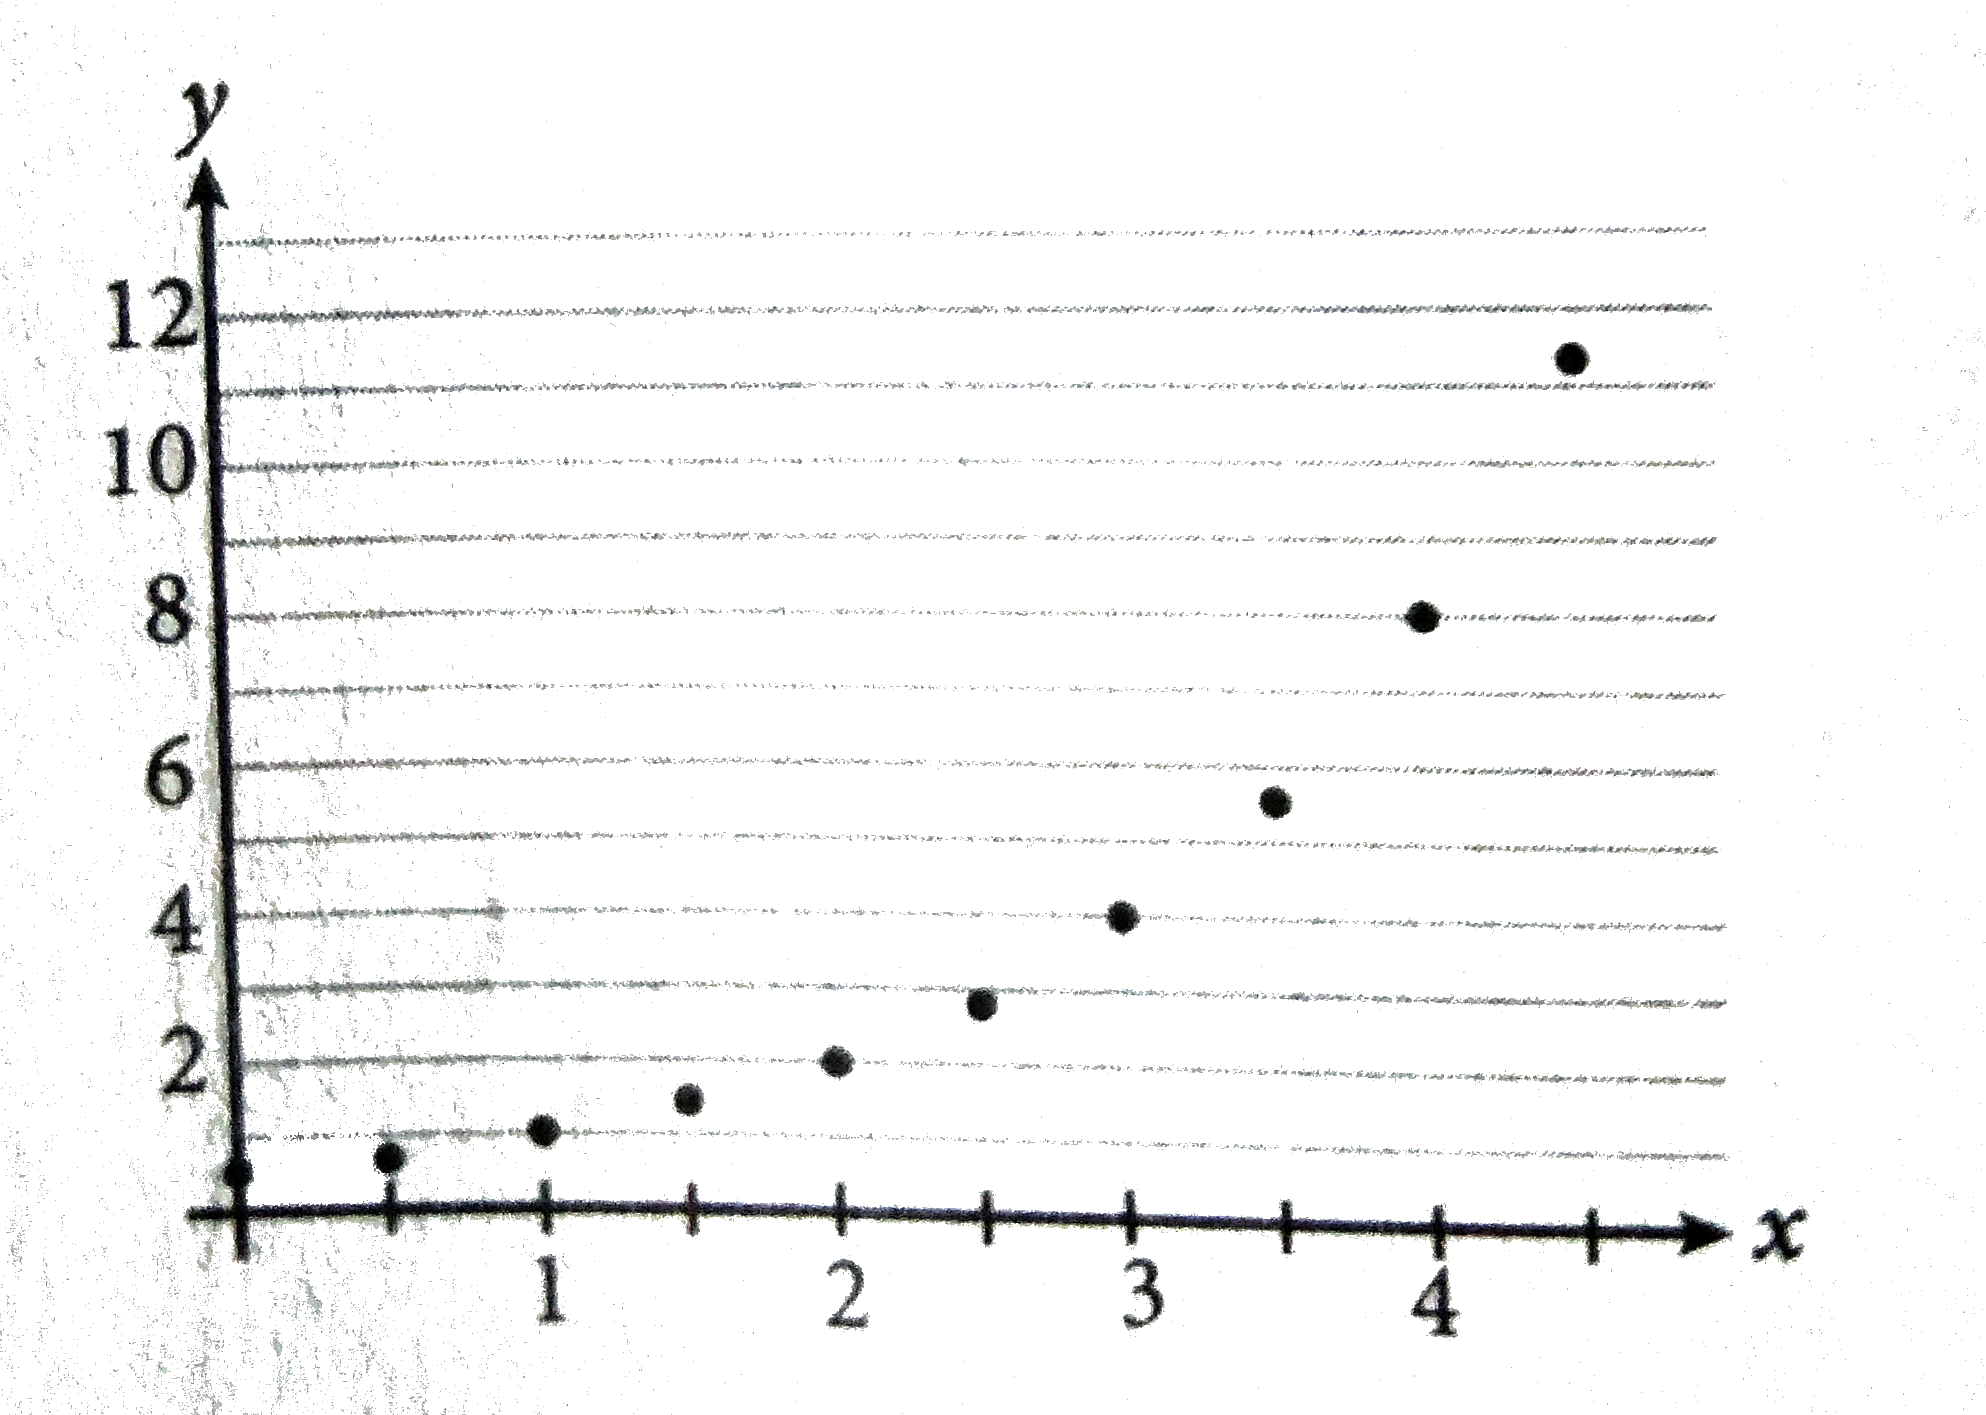
Adriana used the data from a scatterplot she found on the U.S. Census Bureau's website to determine a regression model showing the relationship between the population in the area where she lived and the number of years, x, after she was born. The result was an exponential growth equation of the form y=x0(1+r)x. Which of the following does x0 most likely represent in the equation ?
The population in the year that she was born
The rate of change of the population over time
The maximum population reached during her lifetime
The number of years after her birth when the population reached its maximum
The correct Answer is:A
When an exponential equation is weritten in the from y=x0(1+r)x, the value of x0 gives the y-intercept of the equation's graph. To answer this question, you need to think about what the y-intercept would represent in the context described.
Whenever time is involved in a rrelationship that is modeled by an equation or a graph, it is almost always the independent variable and therefore graphed on the x-axis. Therefore, for this questin, population would be graphed on the y-axis, so x0 most likely represents the population when the time elapsed ws zero, or in other words, in the year that Adriana was born, making (A) correct.
Topper's Solved these Questions
- SCATTERPLOTSBOOK - KAPLANCHAPTER - SCATTERPLOTSEXERCISE - LINE OF BEST FIT
1 Videos
- SCATTERPLOTSBOOK - KAPLANCHAPTER - SCATTERPLOTSEXERCISE - SCATTERPLOT MODELING
1 Videos
- SCATTERPLOTSBOOK - KAPLANCHAPTER - SCATTERPLOTSEXERCISE - SCATTERPLOT MODELING
1 Videos
- SAT MATH: TIMING ANS SECTION MANAGEMENT STRATEGIESBOOK - KAPLANCHAPTER - SAT MATH: TIMING ANS SECTION MANAGEMENT STRATEGIESEXERCISE - TRY ON YOU OWN
5 Videos
- SYSTEMS OF LINEAR EQUATIONSBOOK - KAPLANCHAPTER - SYSTEMS OF LINEAR EQUATIONSEXERCISE - NUMBER OF POSSIBLE SOLUTIONS
1 Videos
Similar Questions
Knowledge Check
Which of the following equations corretly represents the exponential population growth curve ?
AdN/dt=rNBdN/dt=rN(K−NK)CNt=N0ertDBoth (a) and (c)Which of the following is best modeled using a linear regression equation, y=ax+b, where a<0?
A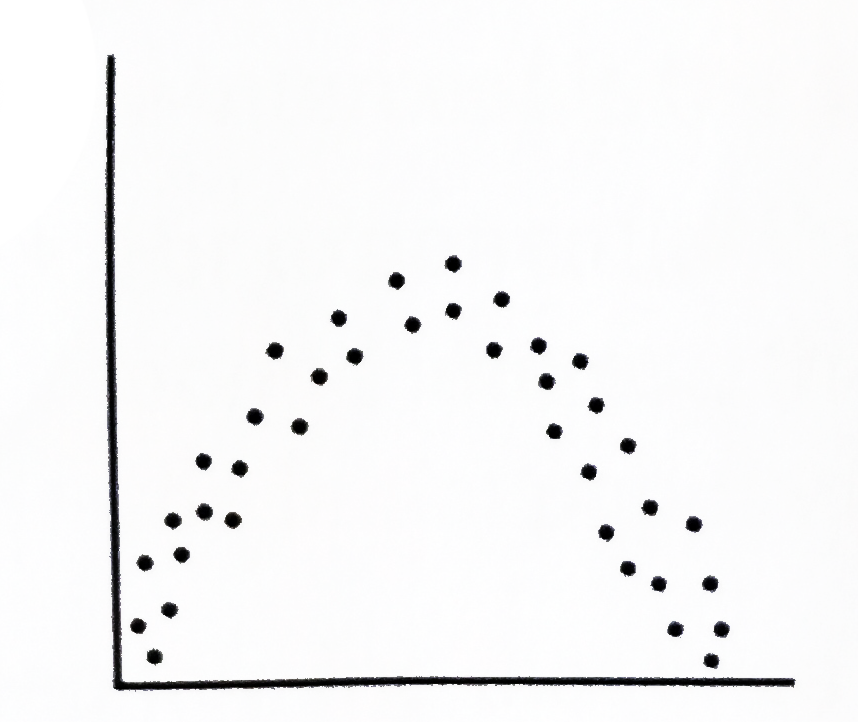 B
B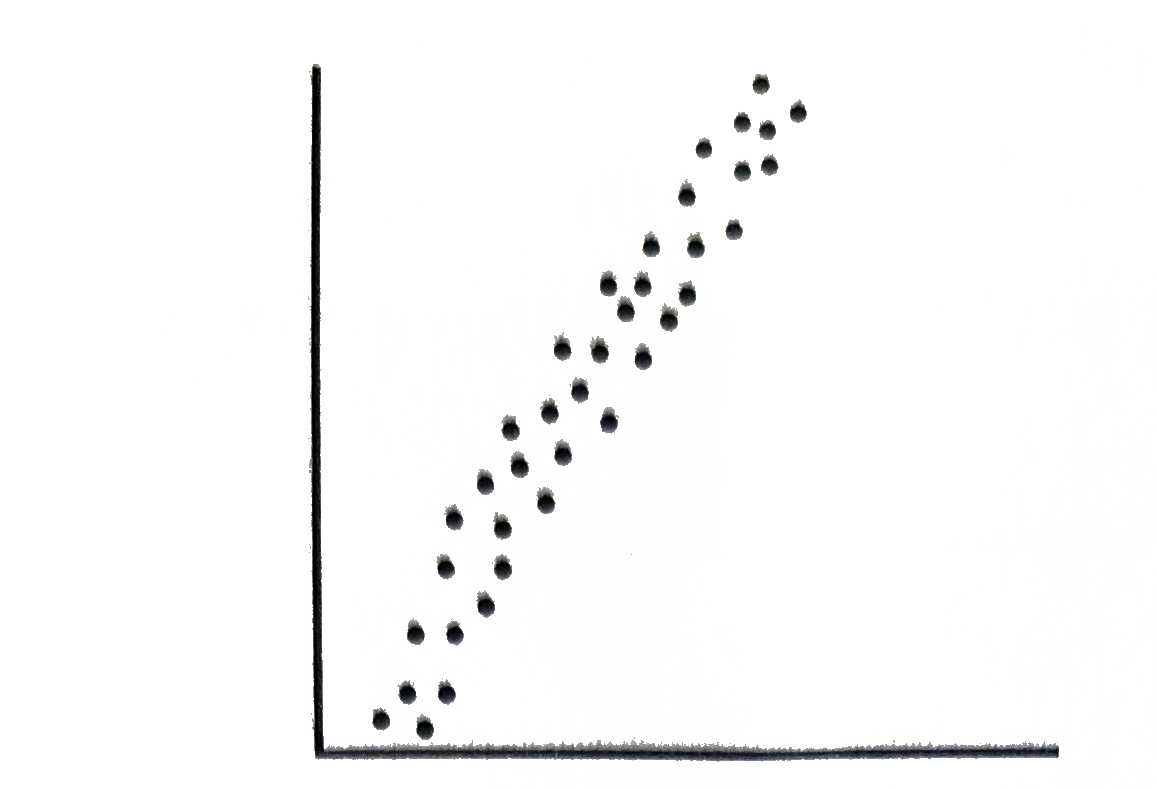 C
C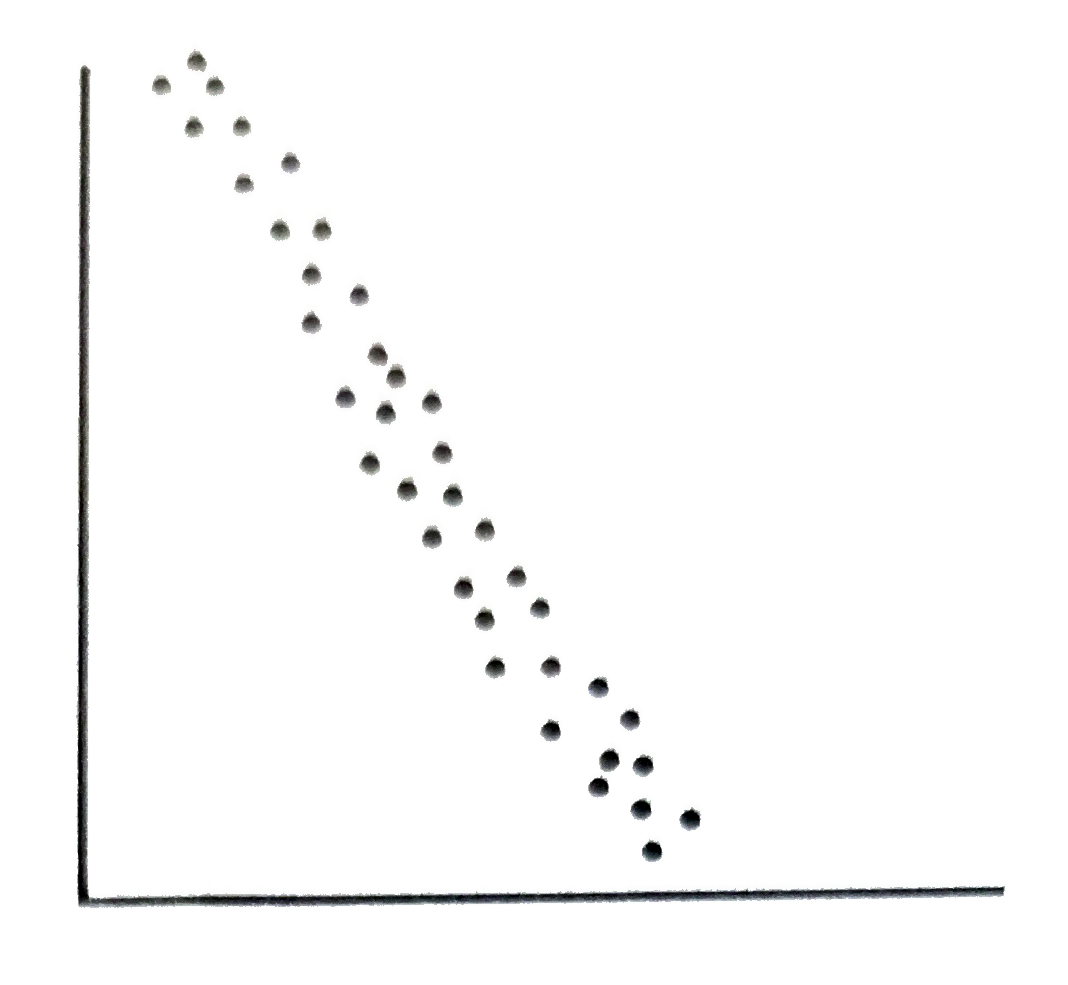 D
D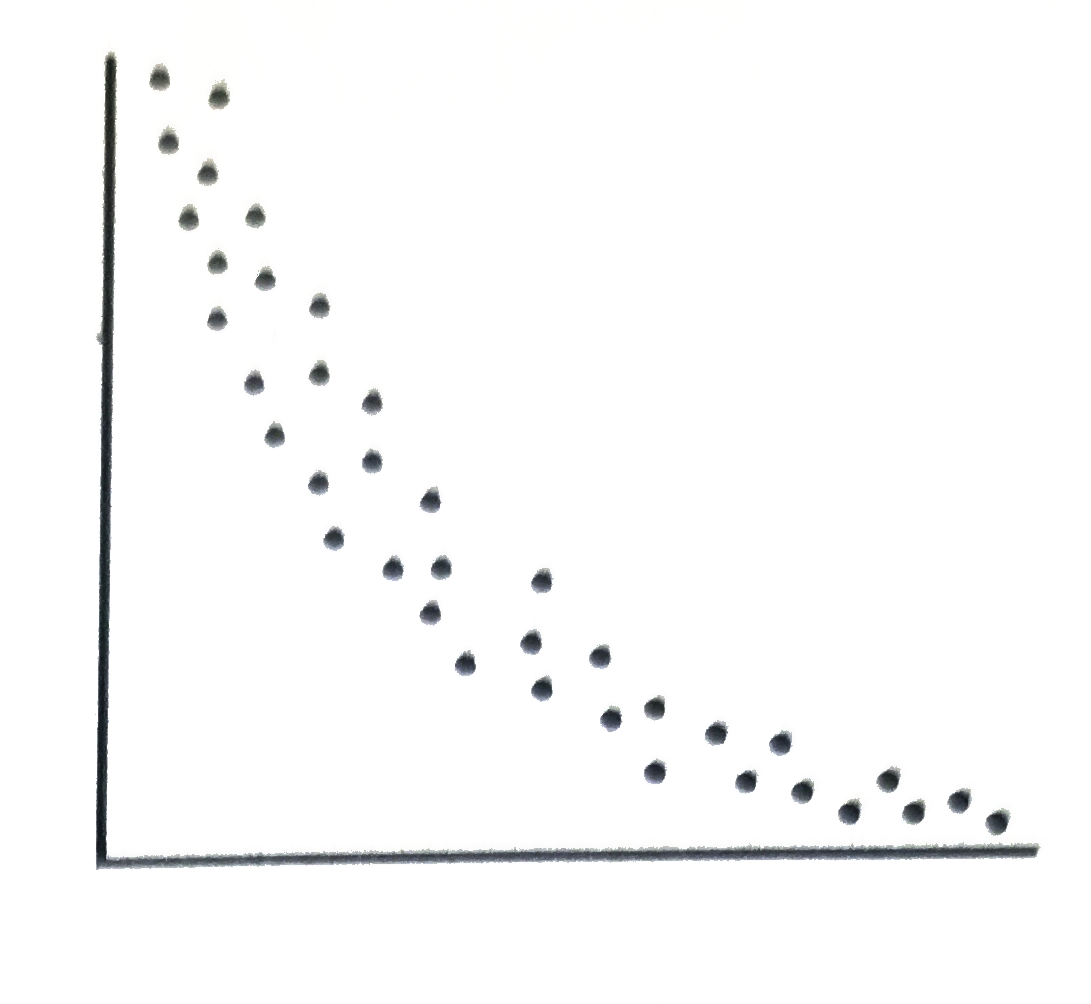
The relative housing cost for a US city is defined to be the ratio average housing cost for the citynational average housing cost expressed as a percent.
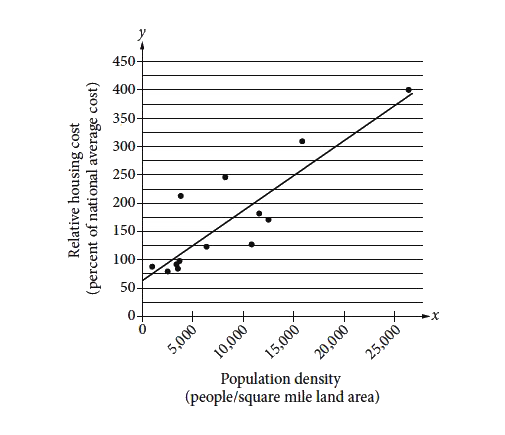
The scatterplot above shows the relative housing cost and the population density for several large US cities in the year 2005. The line of best fit is also shown and has equation y = 0.0125x + 61. Which of the following best explains how the number 61 in the equation relates to the scatterplot?AIn 2005, the lowest housing cost in the United States was about $61 per month.BIn 2005, the lowest housing cost in the United States was about 61% of the highest housing costCIn 2005, even in cities with low population densities, housing costs were never below 61% of the national average.DIn 2005, even in cities with low population densities, housing costs were likely at least 61% of the national average.

Some values of x and their corresponding values of y are shown in the table above, where a is a constant. If there is a linear relationship between x and y, which of the following equations represents the relationship?
View SolutionYou are given the following data:

Correlation coefficient between x and y=0.66. Find the equations of the lines of regression.
View SolutionUsing integration, find the area enclosed between the curve y2=2x+1, and the x−y−1=0
View SolutionThe population ,P, of town Y since 1995 can be estimated by the equation P=1.0635x+3,250, where x is the number of years since 1995 and 0≤x≤20. In the context of this equation, what does the number 1.0635 most likely represent?
View Solutionx + y = 75
The equation above relates the number of minutes, x, Maria spends running each day and the number of minutes, y, she spends biking each day. In the equation, what does the number 75 represent?
View Solution

