Assertion: The nmnber of fish caught per trap is good enough measure of its population density in the,lake.
Reason: For certain ecological investigations, there is no need to know the absolute population densities, relative densities serve the purpose equally well
If both assertion and reason are true and the reason is the correct explanation of the assertion
If both assertion and reason are true but reason is not the correct explanation of the assertion
If assertion is true but reason is false.
If both assertion and reason are false.
The correct Answer is:A
The number of fish caught per trap is a good enough measure of its population density in the lake. For certain ecological investigations, there is no need to know the absolute population densities, relative densities serve the purpose equally well.
Similar Questions
How wil you measure population density in following cases ?(i) fish in a lake
View SolutionAssertion: Total number is an easily adoptable measure if the populations is huge and counting is impossible or very time consuming.
Reason: In a dense laboratory culture of bacteria in a petri dish the best measures to report its density is number or biomass.
View Solution
Knowledge Check
Assertion: The number of fish caught per trap is good enough measure of its populations density in the lake.
Reason: For certain ecological investigations, there is no need to know the absolute populations densities, relative densities serve the purpose equally well.AIf both assertion and reason are true and the reason is the correct explanation of the assertion.BIf both assertion and reason are true but reason is not the correct explanation of the assertion.CIf assertion is true but reason is false.DIf both assertion and reason are false.Which of the followinf is not an example of using relative density to measure population density in a certain area ?
ACounting pugmarks of tigers to find population density to tigers in a forest.BCounting the number of fishes caught in a trap to find population density of fishes in a lakeCMeasuring biomass of bacterial culture to find out population density of bacteria in a petri dish.DMeasuring biomass of phytoplanktons in 1 c c water to find out population density of phytoplanktons in a lake.Which of the followinf is not an example of using relative density to measure population density in a certain area ?
ACounting pugmarks of tigers to find population density to tigers in a forest.BCounting the number of fishes caught in a trap to find population density of fishes in a lakeCMeasuring biomass of bacterial culture to find out population density of bacteria in a petri dish.DMeasuring biomass of phytoplanktons in 1 c c water to find out population density of phytoplanktons in a lake.
Assertion (A) : The magnitude of volume of any liquid is equal to the magnitude of its mass what measured in CGS system.
Reason (R ) : Density of the liquid = mass of the liquid × volume of the liquid.
View SolutionAssertion (A) : The magnitude of volume of any liquid is equal to the magnitude of its mass what measured in CGS system.
Reason (R ) : Density of the liquid = mass of the liquid × volume of the liquid.
View SolutionAssertion (A): China is the most populous country of the world.
Reason (R): Its density of population is much lower than that of India.
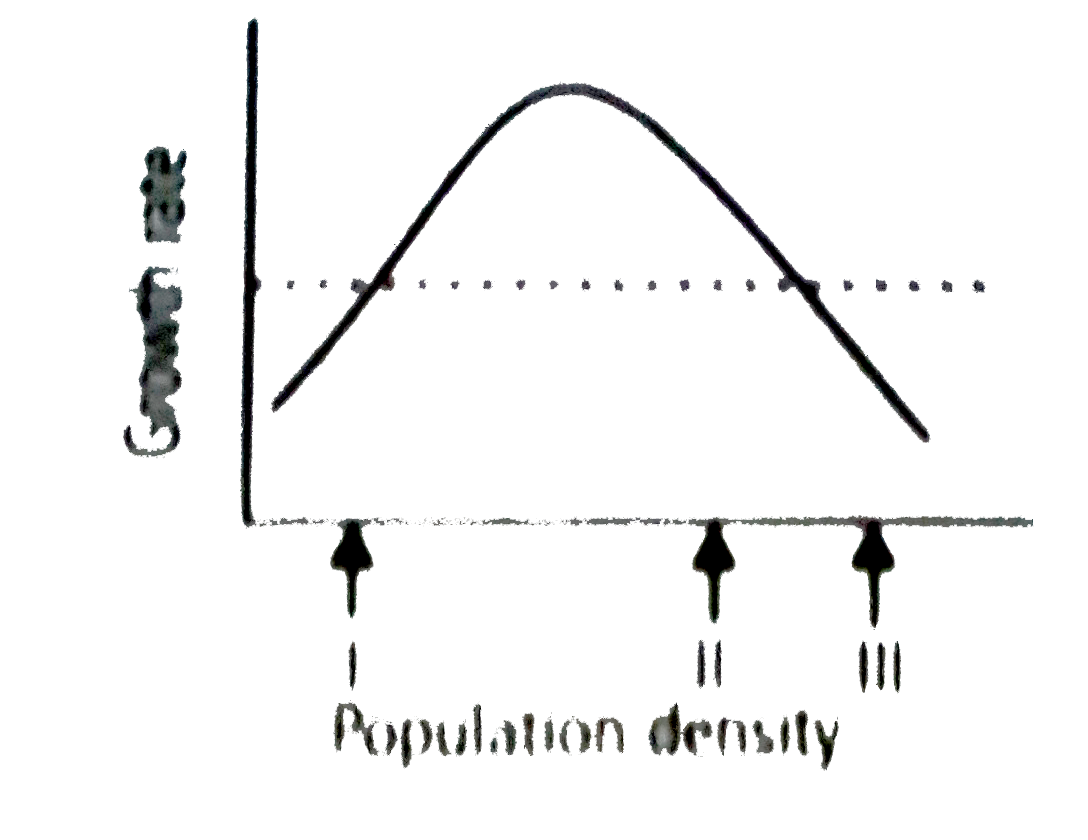
View SolutionThe relationship between population density (Nt) and population growth rate (R=Nt+1lNt) in a certain animal species is shown below.

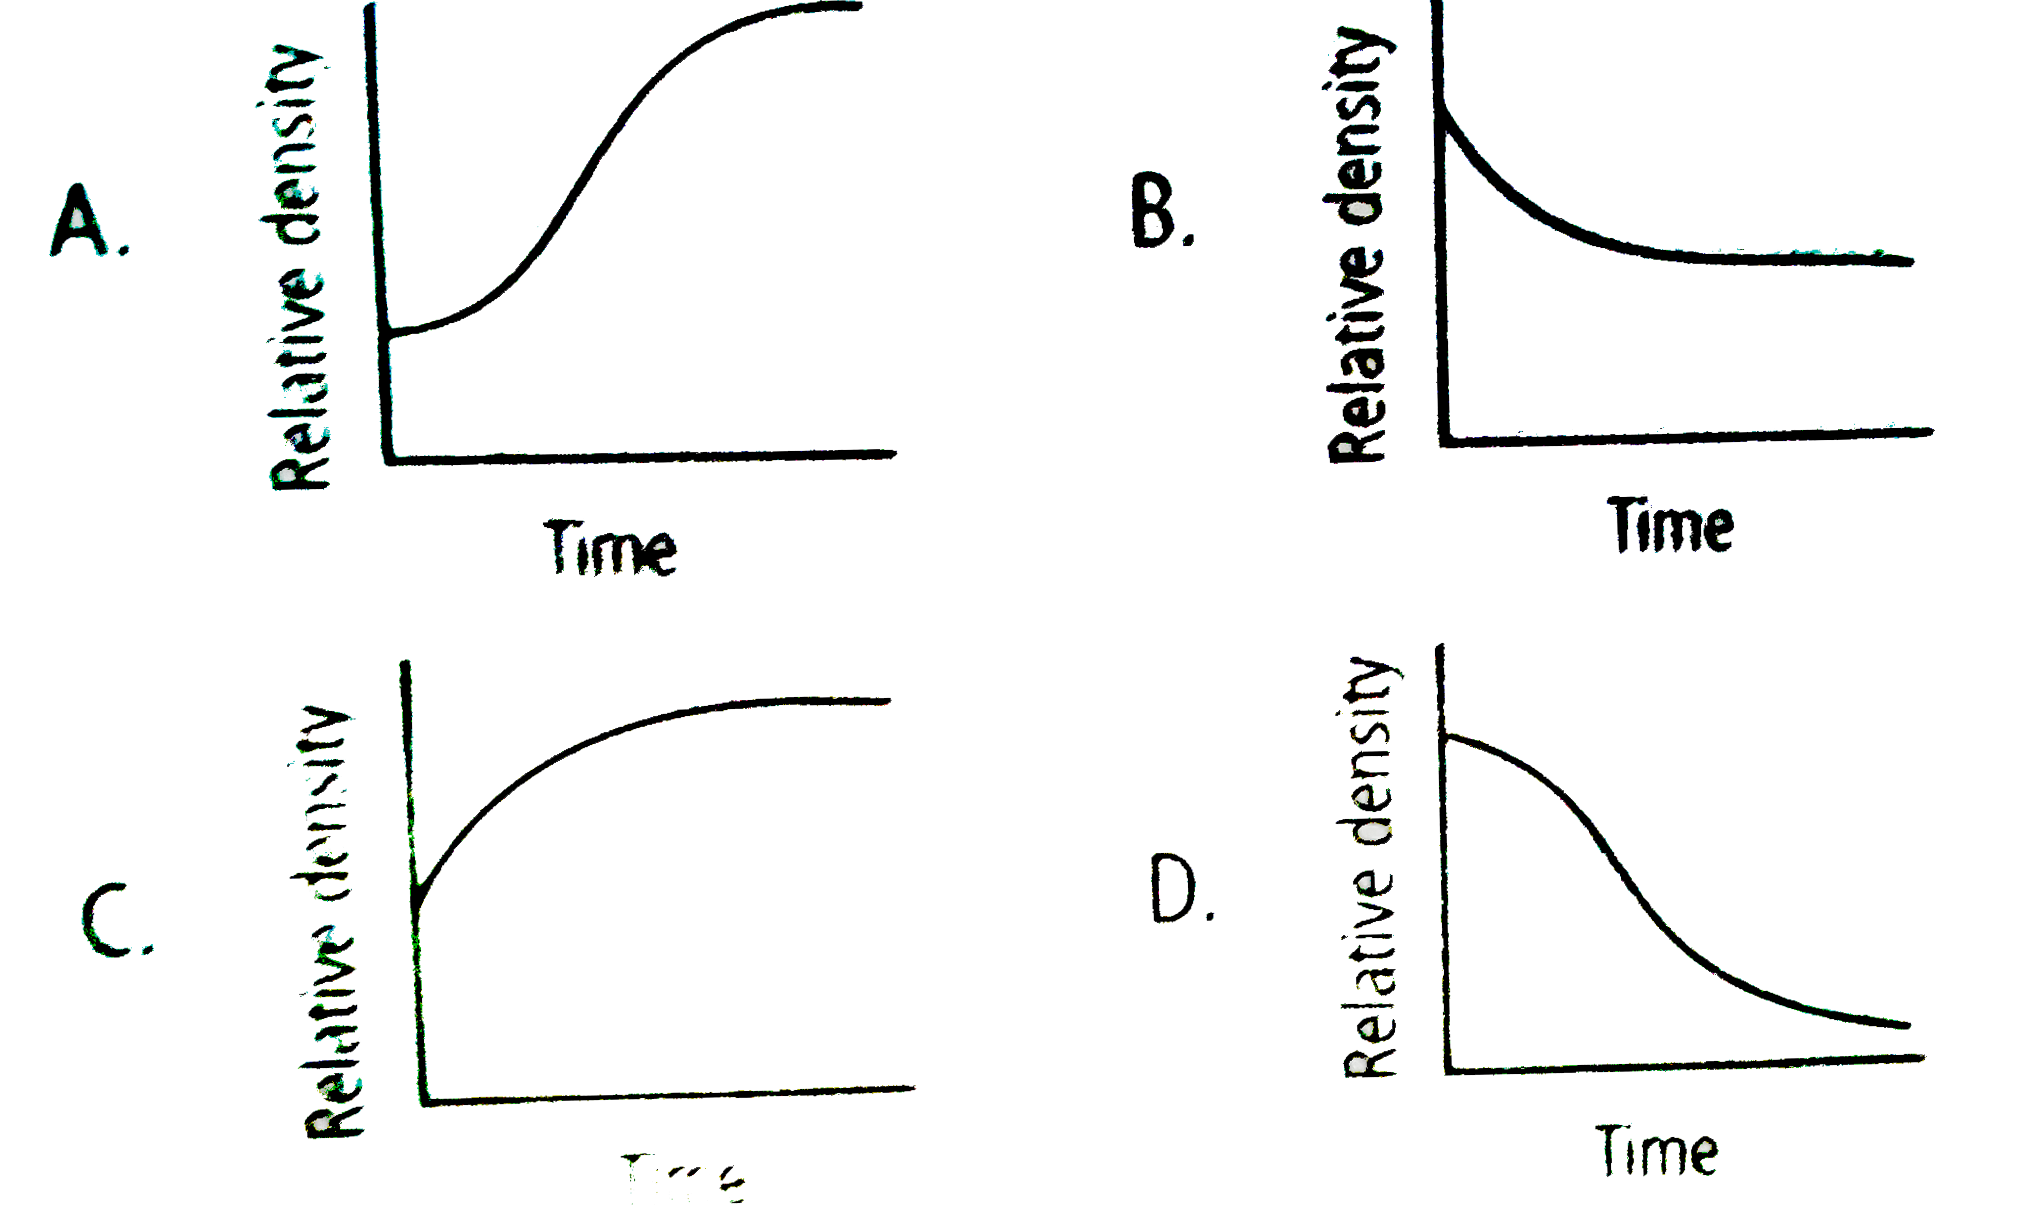
Choose from the following graphs the appropriate populations growth patterns that would be obtained if the population is at the densities (I, II, III) shown in the graph above. [Note : THe y-axis in A to D is relative density that cannot be compared to the absolute density in the figure]

View SolutionThe relationship between population density (Nt) and population growth rate (R=Nt+1lNt) in a certain animal species is shown below.

Choose from the following graphs the appropriate populations growth patterns that would be obtained if the population is at the densities (I, II, III) shown in the graph above. [Note : THe y-axis in A to D is relative density that cannot be compared to the absolute density in the figure]

View Solution
