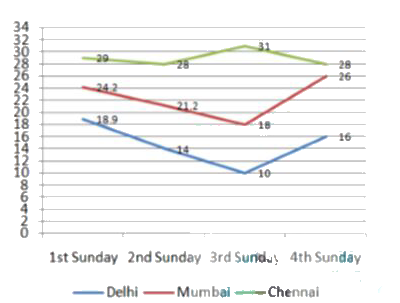
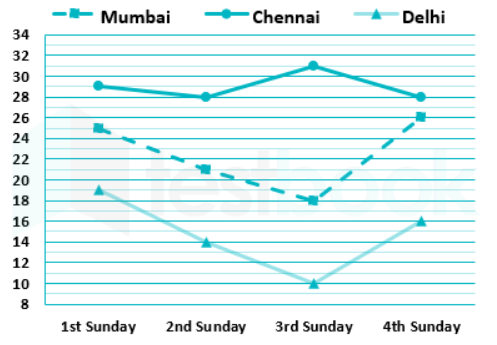
The line diagram shows the temperature of four Sundays of three cities./ यह रेखा आरेख तीन शहरों में चार रविवार का तापमान दर्शाता है |
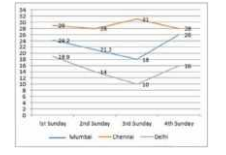 In the given graph, when was the maximum temperature recorded in Delhi?
इसके अनुसार दिल्ली में अधिकतम तापमान कब दर्ज किया गया था ?
4th Sunday/चौथा रविवार
1st Sunday/ पहला रविवार
2nd Sunday/दूसरा रविवार
3rd Sunday/तीसरा रविवार
Step by step video & image solution for The line diagram shows the temperature of four Sundays of three cities./ यह रेखा आरेख तीन शहरों में चार रविवार का तापमान दर्शाता है | In the given graph, when was the maximum temperature recorded in Delhi? इसके अनुसार दिल्ली में अधिकतम तापमान कब दर्ज किया गया था ? by Maths experts to help you in doubts & scoring excellent marks in Class 14 exams.
Updated on:21/07/2023Topper's Solved these Questions
Similar Questions
The line diagram shows the temperature of four Sundays of three cities./ यह रेखा आरेख तीन शहरों में चार रविवार का तापमान दर्शाता है |
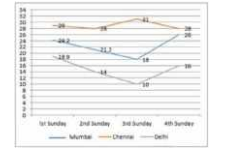 In the given graph, what was the difference in temperature between Delhi and Mumbai on the 2nd Sunday? /
इसके अनुसार दूसरे रविवार को दिल्ली और मुंबई के तापमान में क्या अंतर था ?
View SolutionThe line diagram shows the temperature of four Sundays of three cities./ यह रेखा आरेख तीन शहरों में चार रविवार का तापमान दर्शाता है |
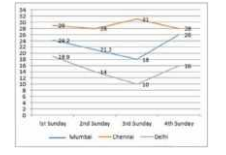 In the given graph, what was the average temperature on the 3rd sunday in all the cities? / इस आरेख में सभी शहरों में तीसरे
रविवार का औसत तापमान क्या था ?
View SolutionThe line graph shows the temperature on four Sundays of three cities.
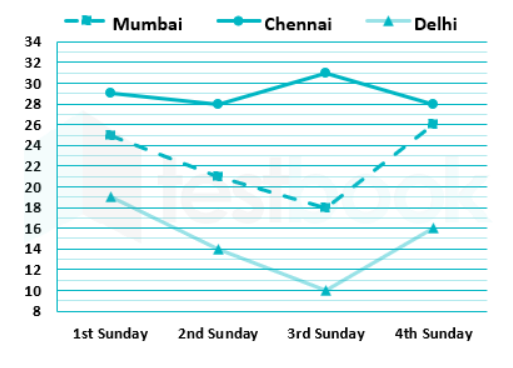
In the given line graph, when was the maximum temperature recorded in Delhi?
View SolutionThe line graph shows the temperature on four Sundays of three cities.
In the given line graph, when was the maximum temperature recorded in Delhi?
View SolutionThe line graph shows the temperature on four sundays of three cities
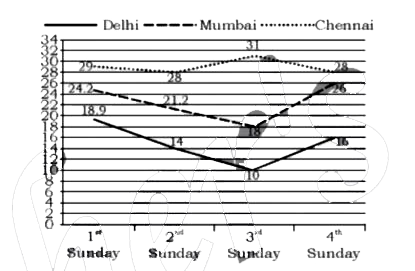
In the given graph when was the maximum temperature recorded in delhi
View SolutionThe line graph shows the temperature on four Sundays of three cities.
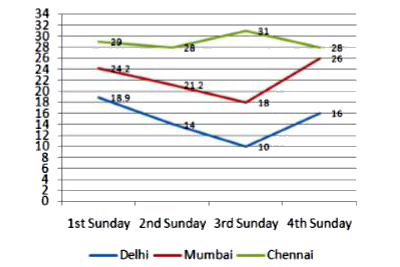
In the given line graph, what was the difference in temperature between Delhi and Mumbai on the 2nd Sunday ?
View SolutionThe line graph shows the temperature on four sundays of three cities
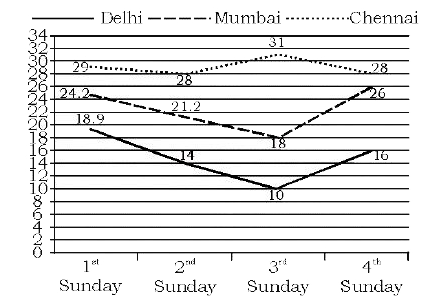
In the given line graph what was the difference in temperature between Delhi and Mumbai on the 2nd Sunday?
View SolutionThe line graph shows the temperature on four Sundays of three cities.
In the given line graph. what was the difference in temperature between Delhi and Chennai on the 3rd Sunday?
View SolutionThe line graph shows the temperature on four Sunday of three cities
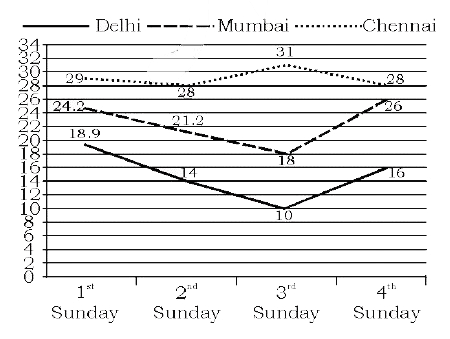
In the given graph, what was the difference in temperature between Delhi and Chennai on the 3rd Sunday?
View SolutionThe line graph shows the temperature on four Sundays of three cities
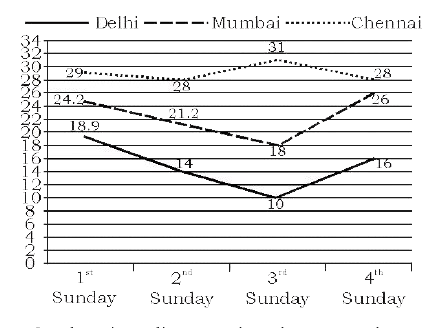 In the given line graph , when was the maximum temperature recorded in Chennai
View Solution
