The given Bar Graph presents the sales of the number of books (in thousands) by six benches of a publishing company during two consecutive years 2000 and 2001.
दिया गया दंड आरेख लगातार दो वर्षों : 2000 और 2001 में एक प्रकाशन कंपनी की छः शाखाओं के द्वारा बेची गयी पुस्तकों की संख्या (
हज़ार में ) दर्शाता है |
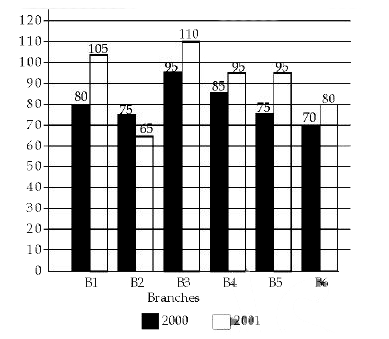
The ratio of total sales by branches B1, B3 and B5 for both the years to total sales by branches B2, B4, B6 for both the years is:
दोनों वर्षों में शाखाओं B1, B3 और B5 की कुल बिक्री तथा शाखाओं B2,
B4 और B6 की कुल बिक्री के बीच अनुपात ज्ञात करें |
21:23
56:47
23:21
47:56
Step by step video & image solution for The given Bar Graph presents the sales of the number of books (in thousands) by six benches of a publishing company during two consecutive years 2000 and 2001. दिया गया दंड आरेख लगातार दो वर्षों : 2000 और 2001 में एक प्रकाशन कंपनी की छः शाखाओं के द्वारा बेची गयी पुस्तकों की संख्या ( हज़ार में ) दर्शाता है | The ratio of total sales by branches B1, B3 and B5 for both the years to total sales by branches B2, B4, B6 for both the years is: दोनों वर्षों में शाखाओं B1, B3 और B5 की कुल बिक्री तथा शाखाओं B2, B4 और B6 की कुल बिक्री के बीच अनुपात ज्ञात करें | by Maths experts to help you in doubts & scoring excellent marks in Class 14 exams.
Updated on:21/07/2023Topper's Solved these Questions
Similar Questions
The graphs of the equations 3x+y-5=0 and 2x-y-5=0 intersect at the point P(α,β). What is the value of (3α+β) ?
समीकरण 3x+y-5=0 तथा 2x-y-5=0 के आरेख एक बिंदु P(α,β) पर एक-दूसरे को काटते है (3α+β) का मान क्या है ?
View SolutionAfter giving two successive discounts, each of x%, on the marked price of an article, total discount is Rs. 259.20. If the marked price of the article is Rs. 720, then the value of x is :
View SolutionTable shows the sales of books (in thousands) from six branches of a publishing company during 2000 and 2001. यह तालिका 2000 से 2001 के दौरान एक प्रकाशन कंपनी की छः शाखाओं के द्वारा पुस्तकों की बिक्री ( हज़ार में) को दर्शाती है | What is the total sales of books from branches B1, B3 and B6 together for both the years (in thousands)? दोनों वर्षों में शाखाओं B1, B3 और B6 ने एक साथ कुल कितनी पुस्तकें बेची हैं? ( हज़ार में )
View SolutionThe given Bar Graph presents the number of students of two schools for six years. दिया गया दंड आरेख छः वर्ष की अवधि में दो विद्यालयों में छात्रों की संख्या को दर्शाता है | What is the average number of students from school B during the six year period (correct to two decimal places)? छः वर्षों की अवधि में विद्यालय B के छात्रों की औसत संख्या कितनी रही है? (दशमलव के दो स्थान तक )
View SolutionThe given Bar Graph presents the number of students of two schools for six years. दिया गया दंड आरेख छः वर्ष की अवधि में दो विद्यालयों में छात्रों की संख्या को दर्शाता है | What is the average of the number of students from school A during the six year period? छः वर्षों की अवधि में विद्यालय A के छात्रों की संख्या का औसत ज्ञात करें |
View SolutionThe given Bar Graph presents the number of students of two schools for six years. दिया गया दंड आरेख छः वर्ष की अवधि में दो विद्यालयों में छात्रों की संख्या को दर्शाता है | What is the ratio of the number of students taken for all years together from school A to that from school B? सभी वर्षों को मिलाकर विद्यालय A और विद्यालय B के छात्रों की संख्या में अनुपात ज्ञात करें |
View SolutionThe given Bar Graph presents the sales of the number of books (in thousands) by six benches of a publishing company during two consecutive years 2000 and 2001. दिया गया दंड आरेख लगातार दो वर्षों : 2000 और 2001 में एक प्रकाशन कंपनी की छः शाखाओं के द्वारा बेची गयी पुस्तकों की संख्या ( हज़ार में ) दर्शाता है | The ratio of total sales by all branches for the year 2001 to total sales by all branches for the year 2000 is: वर्ष 2001 में सभी शाखाओं की कुल बिक्री का वर्ष 2000 में सभी शाखाओं की कुल बिक्री के साथ अनुपात ज्ञात करें|
View SolutionThe given bar chart, shows the sales of books ( in thousand number) from six branches of a publishing company during two consecutive years 2000 and 2001. / दिया गया दंड आरेख एक प्रकाशन कंपनी की छः शाखाओं में दो लगातार वर्षों 2000 एवं 2001 के दौरान किताबों की बिक्री (हज़ार की संख्या में ) को दर्शाता है | In the given bar-chart, total sales of branches B1, B3 and B5 taken together for both the years (in thousand numbers) is: दिए गए दंड आरेख के अनुसार, दोनों वर्षों को मिलाकर शाखा B1, B3 तथा B5 की कुल बिक्री (हज़ार की संख्या में) क्या रही है ?
View SolutionThe bar graph given below presents the number of books sold by a bookseller during different months of a year.
नीचे दिया गया दंड आरेख एक पुस्तक विक्रेता के द्वारा किसी वर्ष के अलग-अलग महीनों में बेची गयी पुस्तकों की संख्या को दर्शाता है |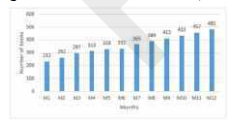 The number of books sold in month M3 is what percent of books sold in month M6?
माह M3 में बेची गयी पुस्तकों की संख्या माह M6 में बेची गयी पुस्तकों की संख्या का कितना प्रतिशत है ?
View SolutionThe bar graph given below presents the number of books sold by a bookseller during different months of a year.
नीचे दिया गया दंड आरेख एक पुस्तक विक्रेता के द्वारा किसी वर्ष के अलग-अलग महीनों में बेची गयी पुस्तकों की संख्या को दर्शाता है |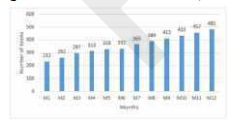 What is the total number of books sold by the bookseller in the year?
वर्ष में इस पुस्तक विक्रेता के द्वारा बेची गयी पुस्तकों की संख्या कुल कितनी है ?
View SolutionThe bar graph given below presents the number of books sold by a bookseller during different months of a year.
नीचे दिया गया दंड आरेख एक पुस्तक विक्रेता के द्वारा किसी वर्ष के अलग-अलग महीनों में बेची गयी पुस्तकों की संख्या को दर्शाता है |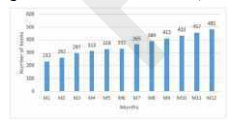
The number of books sold in month M8 is how much more than the average number of books sold per month?
माह M8 में बेची गयी पुस्तकों की संख्या प्रति माह बेची गयी पुस्तकों की औसत संख्या से कितना प्रतिशत अधिक है ?
View SolutionIn the given bar graph, the Blue bar shows the income and the Red bar shows the expenditure of a company. Study the graph and answer the question that follows
दिए गए दंड आरेख में, नीला दंड एक कंपनी की आय दिखाता है और लाल दंड खर्च (लाख रुपये में) को दर्शाता है। आरेख का अध्ययन करें और उस प्रश्न का उत्तर दें जो नीचे पूछा गया है। The percentage decrease in the income of the company in 2002 as compared to that in 2001 is:
2001 की तुलना में 2002 में कंपनी की आय में कितने प्रतिशत में कमी आई है:
View SolutionThe given Bar Graph present the sales of the number of books (in thousands) by six branches of a publishing company during two consecutive years 2000 and 2001.
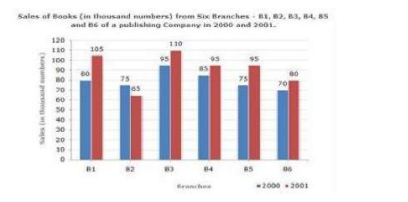
The ratio of the sales by all branches for the year 2001 to total sales by all branches for the year 2000 is:
View SolutionThe given Bar Graph present the sales of the number of books (in thousands) by six branches of a publishing company during two consecutive years 2000 and 2001.
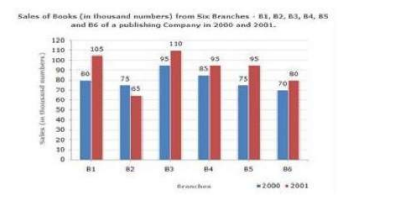
The average of total sales (in thousands and correct to decimal places)by all branches for both the years is:
View SolutionThe given Bar Graph present the sales of the number of books (in thousands) by six branches of a publishing company during two consecutive years 2000 and 2001.
दिया गया दंड आरेख (बार ग्राफ़ ) लगातार दो वर्षों 2000 और 2001 के दौरान किसी प्रकाशन कंपनी की छह शाखाओं द्वारा पुस्तकों की बिक्री की संख्या ( हजार में ) को दर्शाता है|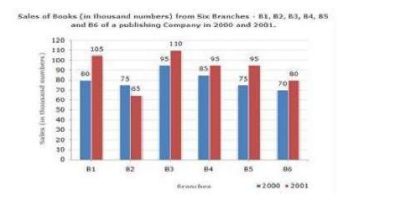 The ratio of total sales by branches B1, B3 and B5 for both the years to total sales by branches B2, B4, B6 for both the years is:
दोनों वर्षों के लिए B1, B3 और B5 तथा B2, B4 और B6द्वारा कुल बिक्री का अनुपात होगा:
View Solution
