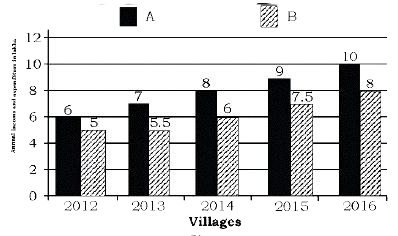
The given Bar Graph presents the data of annual income (A) and annual expenditure (B) of an IT officer in a multi-national company during the years 2012 to 2016.
दिया गया दंड आरेख वर्ष 2012 से 2016 के दौरान किसी बहुराष्ट्रीय कंपनी में कार्यरत एक आईटी अधिकारी अधिकारी की वार्षिक आय ( A ) और वार्षिक व्यय (B) के आंकड़ों को दर्शाता है |
 What was his average monthly savings (in Rs) in 2015 and 2016, taken together (correct to two
decimal places)?
2015 और 2016 को मिलाकर
उसकी औसत मासिक बचत ( रुपये में ) कितनी थी ? ( दशमलव के दो स्थान तक )
14506.33
14967.67
13687.67
14583.33
Step by step video & image solution for The given Bar Graph presents the data of annual income (A) and annual expenditure (B) of an IT officer in a multi-national company during the years 2012 to 2016. दिया गया दंड आरेख वर्ष 2012 से 2016 के दौरान किसी बहुराष्ट्रीय कंपनी में कार्यरत एक आईटी अधिकारी अधिकारी की वार्षिक आय ( A ) और वार्षिक व्यय (B) के आंकड़ों को दर्शाता है | What was his average monthly savings (in Rs) in 2015 and 2016, taken together (correct to two decimal places)? 2015 और 2016 को मिलाकर उसकी औसत मासिक बचत ( रुपये में ) कितनी थी ? ( दशमलव के दो स्थान तक ) by Maths experts to help you in doubts & scoring excellent marks in Class 14 exams.
Updated on:21/07/2023Topper's Solved these Questions
Similar Questions
The given Bar Graph presents the data of annual income (A) and expenditure (B) of an IT officer in a multinational company during the years 2012 to 2016.
दिया गया स्तंभ आलेख (बार ग्राफ ) वर्ष 2012 से 2013 के दौरान एक बह-राष्ट्रिय कंपनी ने एक आईटी अधिकारी की वार्षिक आय (A) और वार्षिक व्यय (B) आँकड़े प्रस्तुत करता है।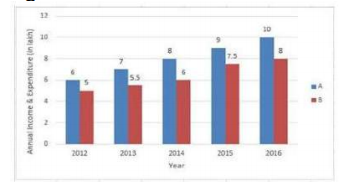 What was his average monthly saving (in ₹) in 2015 and 2016, taken together (correct to two decimal places)?
2015 और 2016 में उसकी औसत मासिक बचत (₹ में), कुल मिलाकर [दशमलव के दो स्थानों तक सही) कितनी थी?
View SolutionThe given Bar Graph presents the data of annual income (A) and annual expenditure (B) of an IT officer in a multi-national company during the years 2012 to 2016.
दिया गया दंड आरेख वर्ष 2012 से 2016 के दौरान किसी बहुराष्ट्रीय कंपनी में कार्यरत एक आईटी अधिकारी अधिकारी की वार्षिक आय ( A ) और वार्षिक व्यय (B) के आंकड़ों को दर्शाता है | For which pair of years, the ratio of savings to expenditure is equal?
किन दो वर्षो में, बचत और व्यय का अनुपात बराबर है ?
View SolutionThe given Bar Graph presents the data of annual income (A) and annual expenditure (B) of an IT officer in a multi-national company during the years 2012 to 2016.
दिया गया दंड आरेख वर्ष 2012 से 2016 के दौरान किसी बहुराष्ट्रीय कंपनी में कार्यरत एक आईटी अधिकारी अधिकारी की वार्षिक आय ( A ) और वार्षिक व्यय (B) के आंकड़ों को दर्शाता है |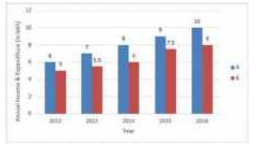 What is the
what is the percentage of his total savings with reference to his total income for the period 2012-15?
2012 से 2015 की अवधि में उसकी कुल आय के संदर्भ में उसकी कुल बचत का प्रतिशत कितना है ?
View SolutionThe given Bar Graph presents the data of annual income (A) and annual expenditure (B) of an IT officer in a multi-national company during the years 2012 to 2016.
दिया गया दंड आरेख वर्ष 2012 से 2016 के दौरान किसी बहुराष्ट्रीय कंपनी में कार्यरत एक आईटी अधिकारी अधिकारी की वार्षिक आय ( A ) और वार्षिक व्यय (B) के आंकड़ों को दर्शाता है |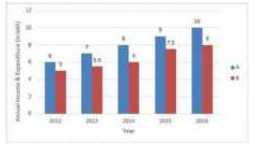 What is the ratio between the ratios of savings to expenditure, respectively for the periods 2012-13 and 2015-16?
बचत और व्यय के अनुपात के बीच क्रमशः वर्ष 2012-13 और 2015-16 के लिए अनुपात ज्ञात करें |
View SolutionThe given Bar Graph presents the data of annual income (A) and annual expenditure (B) of an IT officer in a multinational company during the years
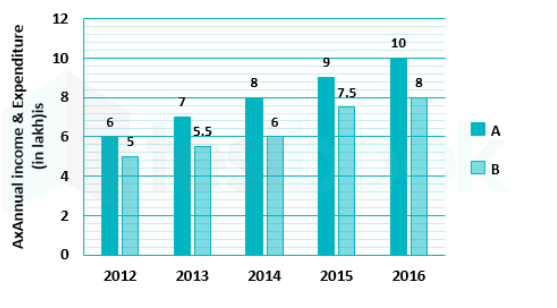
For which pair of years, the ratio of savings to expenditure is equal?
View SolutionThe given bar graph presents the data of annual income and annual expenditure of an IT officier in a multinational company during the years 2012 to 2016.
For which pair of years, the ratio of savings to expenditure is equal.
View SolutionThe given Bar Graph presents the data of annual income (A) and annual expenditure (B) of an IT officer in a multinational company during the years 2012 to 2016.
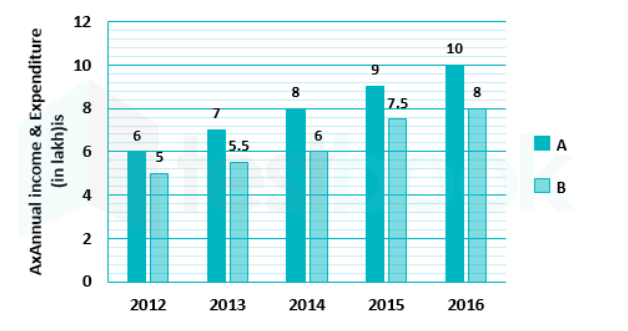
What was his average monthly savings (in) in 2015 and 2016, taken together (correct to two decimal places)?
View SolutionThe given Bar Graph presents Income and Expenditure (in crores of Rupees) of a company for the five years, 2014 to 2018.
दिया गया दंड आरेख पांच वर्षों अर्थात 2014 से 2018 तक एक कंपनी के आय एवं व्यय ( करोड़ रुपये में ) को दर्शाता है |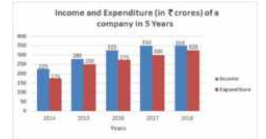 What is the ratio of total Expenditure to total Income of the company in 2014, 2016 and 2017?
2014, 2016 और 2017 में कंपनी के कुल व्यय और कुल आय में क्या अनुपात है ?
View SolutionThe given Bar Graph presents the Revenue and Expenditure (in crores of Rupees ) of a company during the five year period , 2014 - 2018.
दिया गया दंड आरेख (bar graph) 5 वर्ष की अवधि 2014-2018 के दौरान किसी कंपनी के राजस्व और व्यय (करोड़ रुपए में ) को दर्शाता है।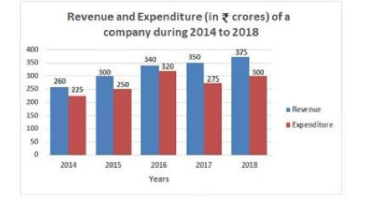
The expenditure of the company in 2017 is what percentage less than the average revenue ( per year ) in 2014, 2015 and 2016 ?
वर्ष 2017 में कंपनी का व्यय, वर्ष 2014, 2015 और 2016 में औसत राजस्व (प्रति वर्ष) से कितने प्रतिशत कम है?
View SolutionThe given Bar Graph presents the Imports and Exports of an items (in tonnes) manufactured by a company for the five financial Years, 2013-2014 to 2017-2018.
दिया गया दंड आरेख (बार ग्राफ) 5 वित्त वर्षों, 2013-2014 से 2011-2018, के दौरान किसी कंपनी द्वारा निर्मित किसी वस्तु के आयात और निर्यात (टन में) को दर्शाता है|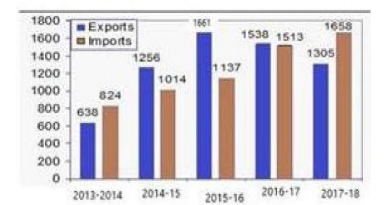 What is the average of Import (in tonnes) during the five financial Years?
5 वित्तीय वर्ष के दौरान आयात का औसत (टन में) क्या है?
View Solution
