In the given bar graph, in which college the difference between the percentage of boys and girls is maximum,by taking total number of students as base for that college? /
दिए गए दंड आरेख के अनुसार किस कॉलेज में उस कॉलेज के छात्रों की कुल संख्या को आधार मानकर लड़के एवं
लड़कियों के प्रतिशत में सर्वाधिक अंतर है ?
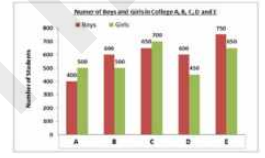
E
B
D
A
Step by step video & image solution for In the given bar graph, in which college the difference between the percentage of boys and girls is maximum,by taking total number of students as base for that college? / दिए गए दंड आरेख के अनुसार किस कॉलेज में उस कॉलेज के छात्रों की कुल संख्या को आधार मानकर लड़के एवं लड़कियों के प्रतिशत में सर्वाधिक अंतर है ? by Maths experts to help you in doubts & scoring excellent marks in Class 14 exams.
Updated on:21/07/2023Topper's Solved these Questions
Similar Questions
In the given bar graph, the percentage decrease in the number of students in Institute A in 2016 is what percent of students in 2015.
इस दंड आरेख में संस्थान A में 2016 में छात्रों की संख्या में प्रतिशत कमी 2015 के छात्रों की संख्या का क्या प्रतिशत है ?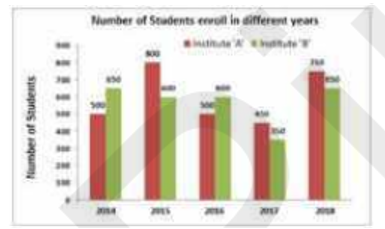
View SolutionThe given Bar Graph presents the results in terms of the number of students in a school for the five academic years, 2013-2014 to 2017-2018. In which year the percentage increase in total number of students is the lowest in comparison to its previous academic year?
दिया गया दंड आरेख पांच शैक्षणिक वर्षों : 2013-2014 से 2017-2018 तक एक विद्यालय में छात्रों की संख्या के संदर्भ में परिणामों को प्रस्तुत करता है |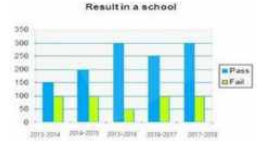
किस वर्ष छात्रों की कुल संख्या में प्रतिशत वृद्धि पिछले शैक्षणिक वर्ष की तुलना में सबसे कम है ?
View SolutionIn the given bar graph, the Blue bar shows the income and the Red bar shows the expenditure of a company. Study the graph and answer the question that follows
दिए गए दंड आरेख में, नीला दंड एक कंपनी की आय दिखाता है और लाल दंड खर्च (लाख रुपये में) को दर्शाता है। आरेख का अध्ययन करें और उस प्रश्न का उत्तर दें जो नीचे पूछा गया है। The income in 2001 was equal to the expenditure in the year:
2001 में आय किस वर्ष के व्यय के बराबर है :
View SolutionIn the given bar graph, the Blue bar shows the income and the Red bar shows the expenditure of a company. Study the graph and answer the question that follows
दिए गए दंड आरेख में, नीला दंड एक कंपनी की आय दिखाता है और लाल दंड खर्च (लाख रुपये में) को दर्शाता है। आरेख का अध्ययन करें और उस प्रश्न का उत्तर दें जो नीचे पूछा गया है। The percentage decrease in the income of the company in 2002 as compared to that in 2001 is:
2001 की तुलना में 2002 में कंपनी की आय में कितने प्रतिशत में कमी आई है:
View SolutionThe following table shows the number of students enrolled in different streams in a particular college. The ratio of the number of girls studying Arts to the number of girls studying in all other streams is:
निम्नलिखित तालिका एक विशेष कॉलेज के विभिन्न विषयों में नामांकित छात्रों की संख्या को दर्शाती है |
कला की पढ़ाई करने वाली छात्राओं तथा अन्य सभी विषयों की पढ़ाई करने वाली छात्राओं की संख्या के बीच क्या अनुपात है ?
View SolutionThe pie-chart given below shows the number of laptops in an office provided by six different companies in the percentage of total number of laptops. The central angles given in the pie chart are not accurate to any scale.
नीचे दिया गया वृत्त-आरेख, छह अलग-अलग कम्पनियों द्वारा किसी कार्यालय में प्रदत्त लैपटॉप की संख्या को, लेपटॉपों की कुल संख्या के प्रतिशत के रूप में दर्शाता है | वृत्त-आरेख में प्रदर्शित केंद्रीय कोण किसी चयनित पैमाने के अनुसार नहीं है |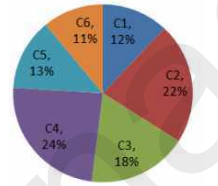 If the total number of laptops in office is 3800, then find the difference between the laptops of
company C2 and C5 ?
कार्यालय में यदि लैपटॉपों की कुल संख्या 3800 है तो कंपनी C2 तथा C5 के लैपटॉपों की संख्या में अंतर कितना है ?
View SolutionThe given Bar Graph presents the number of students enrolled for a vocational course in institutes A and B during a period of five years.
दिया गया दंड आरेख A और B संस्थानों में पांच वर्षों की अवधि के दौरान व्यावसायिक पाठ्यक्रमों नामांकन लेने वाले छात्रों की संख्या को दर्शाता है |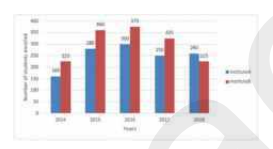 The total number of students enrolled in A during 2014, 2016 and 2018 is what percentage (correct to one decimal place) of the total number of students enrolled in B during the five years?
2014, 2016 और 2018 में A में नामांकन लेने वाले छात्रों की कुल संख्या इन पांच वर्षों के दौरान B में नामांकन लेने वाले छात्रों की कुल संख्या का कितना प्रतिशत ( एक दशमलव स्थान तक सही ) है ?
View SolutionIn a class, 8313% of the number of students are girls and the rest are boys. If 60% of the number of boys and 80% of the number of girls are present, then what percentage of the total number of students in the class is absent ?
एक कक्षा में, छात्रों की कुल संख्या में से 8313% लड़कियाँ हैं तथा शेष लड़के हैं | यदि 60% लड़के और 80% लड़कियाँ उपस्थित हैं, तो कक्षा के कुल छात्रों का कितना प्रतिशत अनुपस्थिति है ?
View SolutionIn the month of June , the number of girls in a class was half of the number of boys. In July, five more girls took admission, whereas five boys left the school. Now, the number of boys and girls is equal in the class. How many students in total were there in the class in June?
जून महीने में, एक कक्षा में लड़कियों की संख्या लड़कों की संख्या से आधी थी | जुलाई में, पाँच और लड़कियों ने नामांकन लिया जबकि पाँच लड़के विद्यालय छोड़ कर चले गए | अब कक्षा में लड़कों और लड़कियों की संख्या बराबर है | जून में कक्षा में कुल कितने छात्र थे ?
View SolutionThere are 150 students in a school. If the ratio between the number of boys and girls is 4 : 1, then find the mean proportional between the number of boys and girls.
किसी विद्यालय में 150 छात्र हैं | यदि लड़के तथा लड़कियों की संख्या का अनुपात 4 : 1 है, तो विद्यालय में लड़कों और लड़कियों की संख्या के बीच मध्यानुपात कितना है?
View Solution
