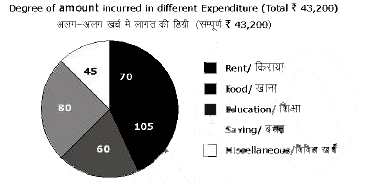
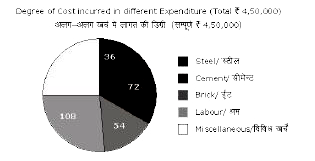
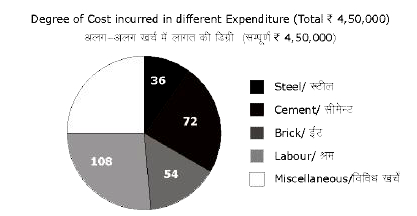
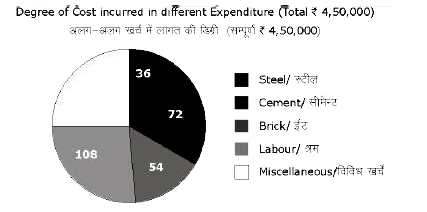
In the given pie chart what is the ratio of the total expenditure on steel, cement and bricks to the total expenditure on labour and miscellaneous expenses
3:7
3:5
4:5
9:11
Step by step video & image solution for In the given pie chart what is the ratio of the total expenditure on steel, cement and bricks to the total expenditure on labour and miscellaneous expenses by Maths experts to help you in doubts & scoring excellent marks in Class 14 exams.
Updated on:21/07/2023Topper's Solved these Questions
Similar Questions
Knowledge Check
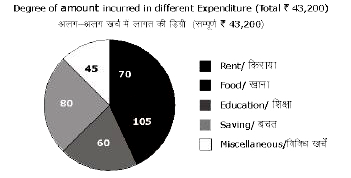
Read the following pie-chart carefully and answer the question.
Degree of amount incurred in different Expenditure Total Expenditure = Rs. 43,200
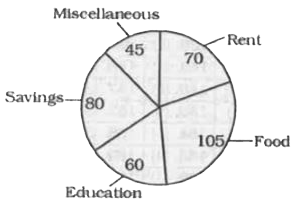
In the given pie-chart, total expenditure together on rent and education is what percent less than expenditure on food and miscellaneous items?A26%B30%C20013%D403%The given pie chart shows the distribution of expenditure of a company (in percentage) . The total expenditure of the company is Rs. 136000.
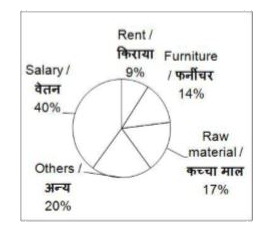
A new expenditure of transportion is added and to meet this expenditure, all others expenditures are reduced. If the central angle formed by the expenditure incurred on Transportation is 72∘, then how much amount (in Rs) all other expenses are reduced?A25200B23000C27200D20400The pie-chart given below shows the percentage distribution of annual expenditure on various items of a company. The annual expenditure of the company is Rs. 72 crores.
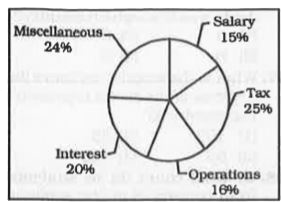
By what percentage is the total expenditure on Interest and Miscellaneous more than the total expenditure on Tax and Salary?A20B15C8D10
The bar-graph given below shows the percentage distribution of total expenditures of a company under various expense heads during 2013. Study the graph and answer the given questions.
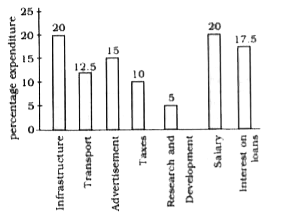
The ratio of the total expenditure on infrastructure and transport to the total expenditure on taxes and interest on loans is
View SolutionIn the given pie chart total expenditure together on rent and education is what percent less than total expenditure of food and miscellaneous items?
View SolutionThe given graph represents the percentage distribution of the total expenditure of a company. Study the graph and answer the question that follows .
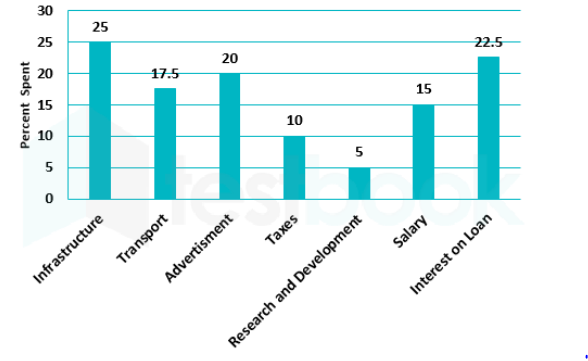
What is the ratio of the total expenditure on 'Infrastructure' and 'Transport' to the total expenditure on 'Taxes' and 'Interset on Loans' ?
View SolutionIn the given pie chart the expenditure on steel is what percent of the expenditure on cement
View SolutionThe given pie chart shows expenditure on different type of sport in a particular year . Study the pie chart and answer the question below
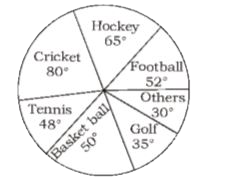
IF total expenditure on sport was Rs 24000000 then total expenditure on cricket and football will be
View Solution

