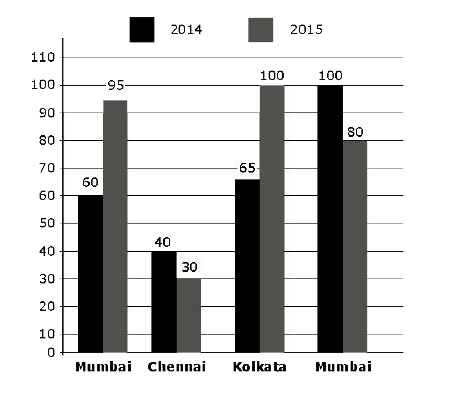
The given bar graph shows the sale of books (in thousands) in four metropolitan branches of a
company for the year 2014 and 2015.
दिया गया बार ग्राफ वर्ष 2014 और 2015 के लिए किसी कंपनी की चार महानगरीय शाखाओं में पुस्तकों की (हज़ारो में ) बिक्री को दर्शाता है |
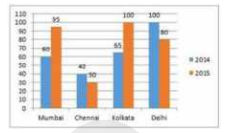 In the given bar graph, compared to 2014, which of the branch saw maximum increase in sales (in%)
in 2015?
दिए गए बार ग्राफ में, 2014 की तुलना में 2015में कौन सी शाखा की बिक्री में अधिकतम वृद्धि (% में ) हुई ?
Kolkata /कोलकाता
Mumbai / मुंबई
Delhi/ दिल्ली
Chennai /चेन्नई
Step by step video & image solution for The given bar graph shows the sale of books (in thousands) in four metropolitan branches of a company for the year 2014 and 2015. दिया गया बार ग्राफ वर्ष 2014 और 2015 के लिए किसी कंपनी की चार महानगरीय शाखाओं में पुस्तकों की (हज़ारो में ) बिक्री को दर्शाता है | In the given bar graph, compared to 2014, which of the branch saw maximum increase in sales (in%) in 2015? दिए गए बार ग्राफ में, 2014 की तुलना में 2015में कौन सी शाखा की बिक्री में अधिकतम वृद्धि (% में ) हुई ? by Maths experts to help you in doubts & scoring excellent marks in Class 14 exams.
Updated on:21/07/2023Topper's Solved these Questions
Similar Questions
The given bar chart shows the sales of books in four metro branches ofa company for the years 2014 and 2015
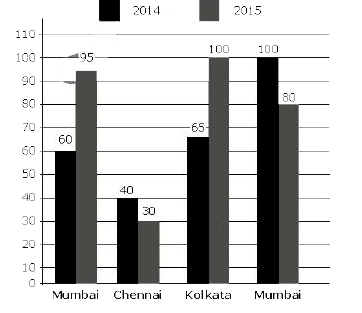
In the given bar chart the ratio the total sales between Mumbai and Delhi is
View SolutionThe given bar chart shows the details of cycle sales by a company between January and May for years 2017 and 2018.
दिया गया दंड आरेख वर्ष 2017 एवं 2018 में एक कंपनी के द्वारा जनवरी से लेकर मई तक साइकिल बिक्री की जानकारी देता है |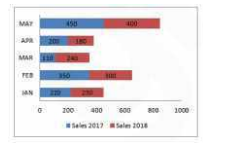 In the given bar-chart, which month sales show the maximum decrease in 2018 as compared to 2017?
दिए गए दंड आरेख में, किस माह की बिक्री 2017 की तुलना में 2018 में अधिकतम कमी को दर्शाती है ?
View SolutionThe given bar chart shows the details of cycle sales by a company between January and May for years 2017 and 2018.
दिया गया दंड आरेख वर्ष 2017 एवं 2018 में एक कंपनी के द्वारा जनवरी से लेकर मई तक साइकिल बिक्री की जानकारी देता है |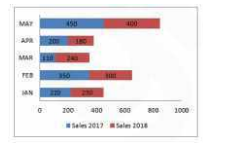 In the given bar-chart, which month sale shows the maximum increase in 2018 as against 2017?
/ दिए गए दंड आरेख के नुसार किस महीने की बिक्री 2017 की तुलना में 2018 में अधिकतम वृद्धि दर्शाती है ?
View SolutionThe given bar chart shows the sales of books in four metro branches of a company for the years 2014 and 2015.
In the given bar chart, which branch has the highest increase in sale in 2015 as compared to 2014?
View SolutionThe given Bar Graph presents the sales of the number of books (in thousands) by six benches of a publishing company during two consecutive years 2000 and 2001.
दिया गया दंड आरेख लगातार दो वर्षों : 2000 और 2001 में एक प्रकाशन कंपनी की छः शाखाओं के द्वारा बेची गयी पुस्तकों की संख्या ( हज़ार में ) दर्शाता है |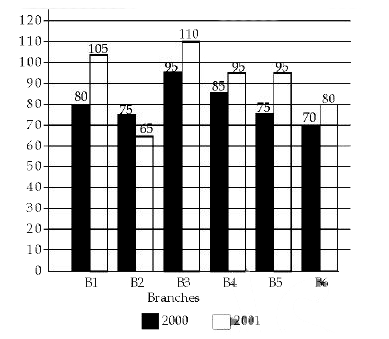 The ratio of total sales by all branches for the year 2001 to total sales by all branches for the year 2000 is:
वर्ष 2001 में सभी शाखाओं की कुल बिक्री का वर्ष 2000 में सभी शाखाओं की कुल बिक्री के साथ अनुपात ज्ञात करें|
View SolutionThe given bar chart shows the sales of books in four metro branches of a company for the years 2014 and 2015.
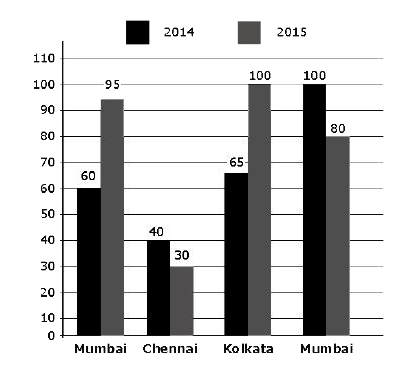
In the given bar chart, calculate the percentage increment of sales between the year 2014 and 2015.
View SolutionThe given bar chart, shows the sales of books ( in thousand number) from six branches of a publishing company during two consecutive years 2000 and 2001. /
दिया गया दंड आरेख एक प्रकाशन कंपनी की छः शाखाओं में दो लगातार वर्षों 2000 एवं 2001 के दौरान किताबों की बिक्री (हज़ार की संख्या में ) को दर्शाता है |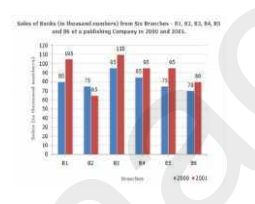 In the given bar-chart, total sales of branches B1, B3 and B5 taken together for both the years (in
thousand numbers) is:
दिए गए दंड आरेख के अनुसार, दोनों वर्षों को मिलाकर शाखा B1, B3 तथा B5 की कुल बिक्री (हज़ार की संख्या में) क्या रही है ?
View SolutionThe given Bar Graph present the sales of the number of books (in thousands) by six branches of a publishing company during two consecutive years 2000 and 2001.
दिया गया दंड आरेख (बार ग्राफ़ ) लगातार दो वर्षों 2000 और 2001 के दौरान किसी प्रकाशन कंपनी की छह शाखाओं द्वारा पुस्तकों की बिक्री की संख्या ( हजार में ) को दर्शाता है|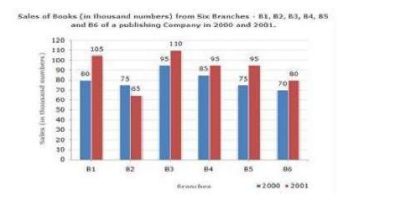 The ratio of total sales by branches B1, B3 and B5 for both the years to total sales by branches B2, B4, B6 for both the years is:
दोनों वर्षों के लिए B1, B3 और B5 तथा B2, B4 और B6द्वारा कुल बिक्री का अनुपात होगा:
View SolutionTable shows the sales of books (in thousands) from six branches of a publishing company during 2000 and 2001.
यह तालिका 2000 से 2001 के दौरान एक प्रकाशन कंपनी की छः शाखाओं के द्वारा पुस्तकों की बिक्री ( हज़ार में) को दर्शाती है |
What is the total sales of books from branches B1, B3 and B6 together for both the years (in thousands)?
दोनों वर्षों में शाखाओं B1, B3 और B6 ने एक साथ कुल कितनी पुस्तकें बेची हैं? ( हज़ार में )
View SolutionThe given Bar Graph presents Income and Expenditure (in crores of Rupees) of a company for the five years, 2014 to 2018.
दिया गया दंड आरेख पांच वर्षों अर्थात 2014 से 2018 तक एक कंपनी के आय एवं व्यय ( करोड़ रुपये में ) को दर्शाता है |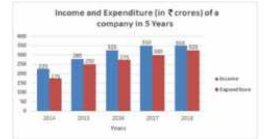 What is the ratio of the total revenue of the company in 2015 and 2018 to that of its expenditure in 2014 and 2018?
2015 तथा 2018 में कंपनी की कुल आय और 2014 तथा 2018 में कंपनी के कुल व्यय में क्या अनुपात है ?
View Solution
