The line graph shows the monthly expenditure by two families in hundreds
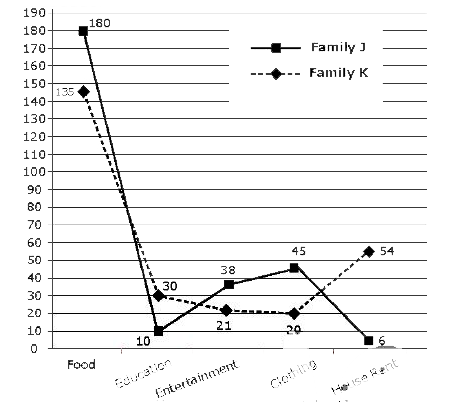
In the given line graph what is the difference in percentage of percentage of spending on food between family J and K?
0.137
0.149
0.152
0.126
Step by step video & image solution for The line graph shows the monthly expenditure by two families in hundreds In the given line graph what is the difference in percentage of percentage of spending on food between family J and K? by Maths experts to help you in doubts & scoring excellent marks in Class 14 exams.
Updated on:21/07/2023Topper's Solved these Questions
Similar Questions
The line graph shows the monthly expenditure by two families in hundreds
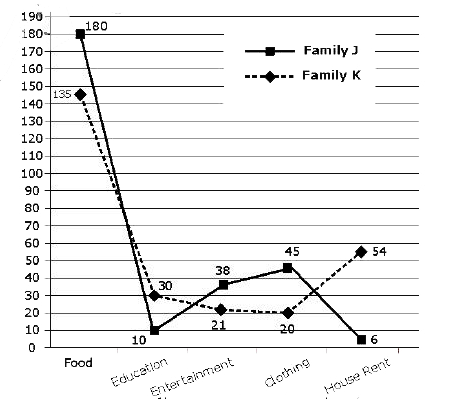
IN the given line graph, what is the ratio of the difference in spending between food and education for family J and k?
View SolutionThe line graph shows the monthly expenditure by two families in hundreds
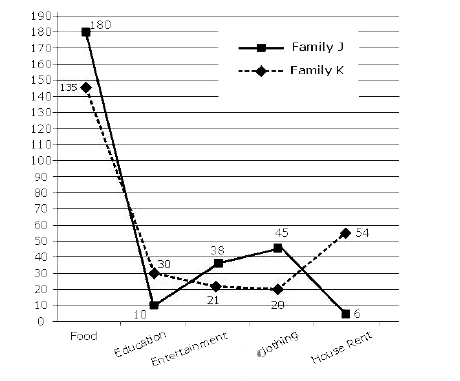
In the given line graph if the monthly income of Family K increase to 37200 what will be the increase in expenditure on entertainment
View Solution
Knowledge Check
Following bar diagram shows the monthly expenditure of two families on food, clothing, education, fuel, house rent and miscellaneous (in percentage).
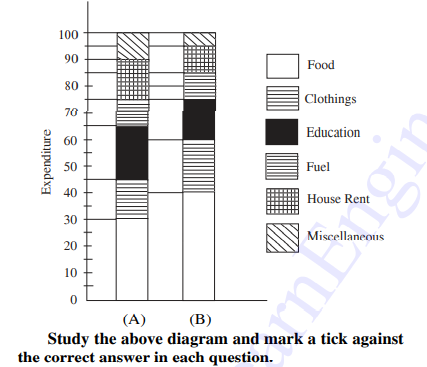
What percentage is B's expenditure on food over A's expenditure on food ? ( Taking equal total expenditure)A10%B70%C13313%D75%The bar diagram shows the monthly expenditure of a company. Study the graph and answer the questions.
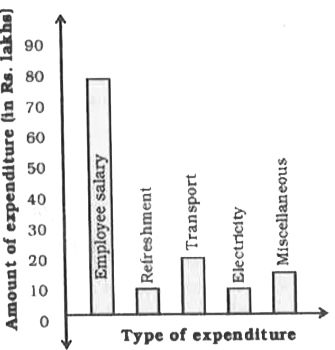
The percentage of money spent on miscellaneous isA7217B1727C1119D9111The bar diagram shows the monthly expenditure of a company. Study the graph and answer the questions.
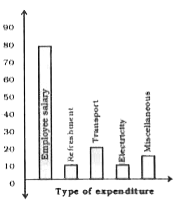
The percentage of money spent on miscellaneous isA7211B1727C1119D9111
The line graph shows the temperature on four sundays of three cities
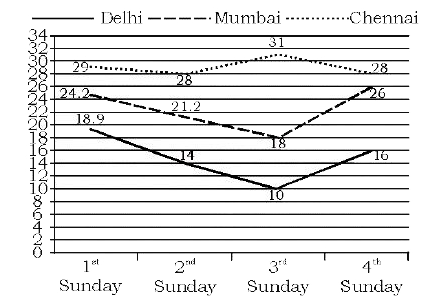
In the given line graph what was the difference in temperature between Delhi and Mumbai on the 2nd Sunday?
View SolutionThe line graph shows the temperature on four Sundays of three cities.
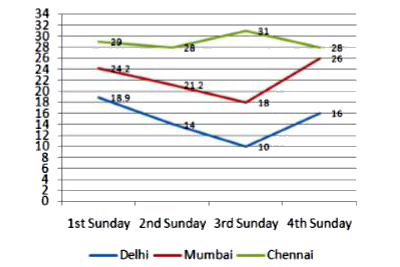
In the given line graph, what was the difference in temperature between Delhi and Mumbai on the 2nd Sunday ?
View SolutionThe line graph shows the temperature on four Sundays of three cities.
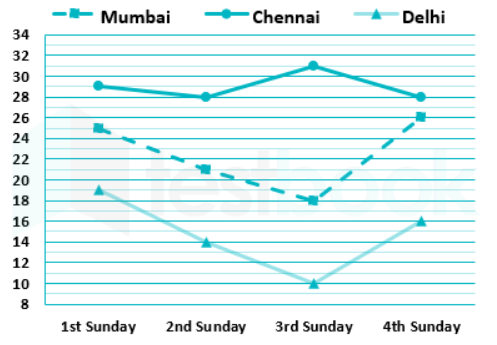
In the given line graph. what was the difference in temperature between Delhi and Chennai on the 3rd Sunday?
View SolutionThe line graph shows the temperature on four Sunday of three cities
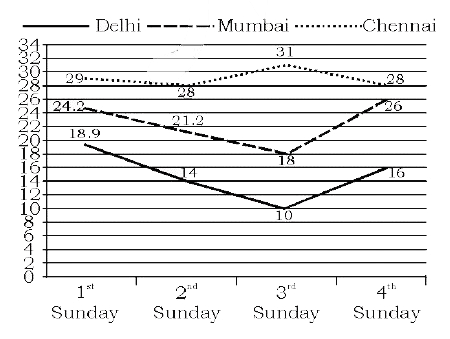
In the given graph, what was the difference in temperature between Delhi and Chennai on the 3rd Sunday?
View SolutionFollowing bar diagram shows the monthly expenditure of two families on food, clothing, education, fuel, house rent and miscellaneous (in percentage).
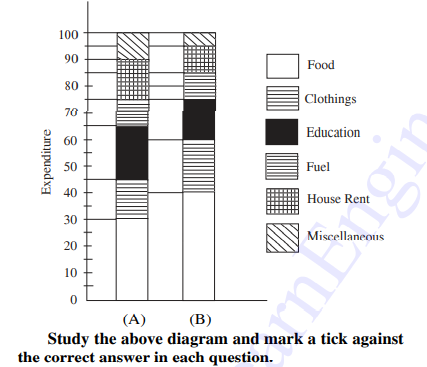
If the total annual expenditure of family A is Rs. 30,000 then money spent on food, clothes and house rent is -----
View Solution
