The table given below presents the number of books on different subjects kept on separate shelves. Subjects with odd and even numbers are of Arts and Science respectively.
नीचे दी गयी तालिका अलग-अलग विषयों की पुस्तकों की संख्या को
दर्शाता है जिन्हें अलग-अलग खानों में रखा गया है | विषम तथा सम संख्या के विषय क्रमशः कला एवं विज्ञान हैं |
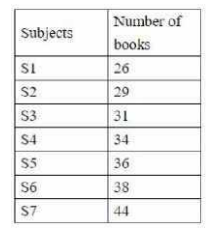 What is the ratio of the total number of books on Arts to that of Science?
कला और विज्ञान की कुल पुस्तकों की संख्या में क्या अनुपात है ?
141:97
145:93
137:101
149:89
Step by step video & image solution for The table given below presents the number of books on different subjects kept on separate shelves. Subjects with odd and even numbers are of Arts and Science respectively. नीचे दी गयी तालिका अलग-अलग विषयों की पुस्तकों की संख्या को दर्शाता है जिन्हें अलग-अलग खानों में रखा गया है | विषम तथा सम संख्या के विषय क्रमशः कला एवं विज्ञान हैं | What is the ratio of the total number of books on Arts to that of Science? कला और विज्ञान की कुल पुस्तकों की संख्या में क्या अनुपात है ? by Maths experts to help you in doubts & scoring excellent marks in Class 14 exams.
Updated on:21/07/2023Topper's Solved these Questions
Similar Questions
The table given below presents the number of books on different subjects kept on separate shelves. Subjects with odd and even numbers are of Arts and Science respectively.
नीचे दी गयी तालिका अलग-अलग विषयों की पुस्तकों की संख्या को दर्शाता है जिन्हें अलग-अलग खानों में रखा गया है | विषम तथा सम संख्या के विषय क्रमशः कला एवं विज्ञान हैं |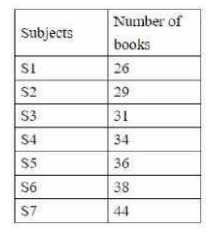 What is the ratio of the number of books of S1 and the average number of books per subject?
S1 के पुस्तकों की संख्या तथा प्रति विषय पुस्तकों की औसत संख्या में क्या अनुपात है ?
View SolutionThe table given below presents the number of books on different subjects kept on separate shelves. Subjects with odd and even numbers are of Arts and Science respectively.
नीचे दी गयी तालिका अलग-अलग विषयों की पुस्तकों की संख्या को दर्शाता है जिन्हें अलग-अलग खानों में रखा गया है | विषम तथा सम संख्या के विषय क्रमशः कला एवं विज्ञान हैं |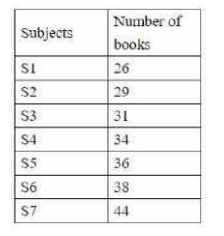 The number of books of S3 is what percent (correct to one decimal place) of the average number of Science books?
S3 के पुस्तकों की संख्या विज्ञान की पुस्तकों की औसत संख्या ( एक दशमलव स्थान तक ) का कितना प्रतिशत है ?
View Solution
Knowledge Check
The table given below presents the number of books on different subjects kept on separate shelves. Subjects with odd and even numbers are of Arts and Science respectively.
 What is the ratio of the total number of books on Arts to that of Science? A141:97B145:93C137:101D149:89
The Table given below presents the number of books on different subjects kept on separate sheivs. Subjects with odd and even numbers are of Arts and Science respectively.
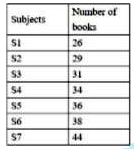
What is the ratio of the number of books SI and the average number of books per subject ?A13:17B18:13C14:17D14:13The table given below presents the number of books on different subjects kept on separate shelves. Subjects with odd and even numbers are of Arts and Science respectively.
 The number of books of S3 is what percent (correct to one decimal place) of the average number of Science books? A92.1B91.2C93.1D90.1
The bar graph given below presents the number of books sold by a bookseller during different months of a year.
नीचे दिया गया दंड आरेख एक पुस्तक विक्रेता के द्वारा किसी वर्ष के अलग-अलग महीनों में बेची गयी पुस्तकों की संख्या को दर्शाता है |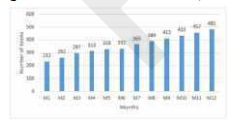 What is the total number of books sold by the bookseller in the year?
वर्ष में इस पुस्तक विक्रेता के द्वारा बेची गयी पुस्तकों की संख्या कुल कितनी है ?
View SolutionThe given bar graph presents the number of students from Science and Arts streams from a school in different years.
दिया गया दंड आरेख अलग-अलग वर्षों में एक विद्यालय में विज्ञान एवं कला संकाय के छात्रों की संख्या को दर्शाता है |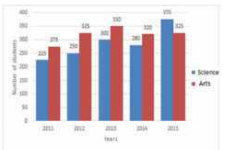 What is the ratio of the total number of Science students in 2011 and 2015 to that of Arts in 2012 and 2015?
2011 तथा 2015 में विज्ञान के छात्रों की कुल संख्या का 2012 तथा 2015 में कला के छात्रों की कुल संख्या के साथ अनुपात ज्ञात करें |
View SolutionThe table given below shows the number of students having obtained different marks
नीचे दी गयी तालिका अलग-अलग अंक प्राप्त करने वाले छात्रों की संख्या को दर्शाती है |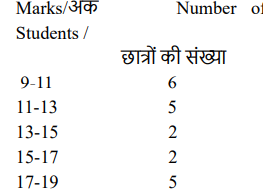
What is the mean marks per student ?
प्रति छात्र माध्य अंक कितना है ?
View SolutionThe Table shows the number of students from different schools playing different games.
यह तालिका अलग-अलग विद्यालयों के छात्रों की संख्या को दर्शाती है जो अलग-अलग खेल खेलते हैं ?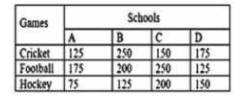 What is the average of the number of students who play cricket in all four schools?
सभी चार विद्यालयों में क्रिकेट खेलने है छात्रों की औसत संख्या कितनी
View SolutionThe Table shows the number of students from different schools playing different games.
यह तालिका अलग-अलग विद्यालयों के छात्रों की संख्या को दर्शाती है जो अलग-अलग खेल खेलते हैं ?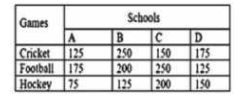 What is the ratio of the total students who play cricket in schools A and B together to the total students who play hockey in schools C and D ?
विद्यालय A और B में क्रिकेट खेलने वाले छात्रों की कुल संख्या का विद्यालय C और D में हॉकी खेलने वाले छात्रों की कुल संख्या के साथ क्या अनुपात है ?
View Solution
