The bar graph given below presents the marks (out of 100) obtained by 10 students in a subject.
यह दंड आरेख एक विषय में 10 छात्रों के प्राप्तांक ( 100 में से ) को दर्शाता है |
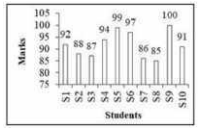 What is the average of the marks obtained by all the students?
सभी छात्रों के द्वारा प्राप्त किये गए
अंकों का औसत क्या है ?
91.9
90.9
82.9
89.9
Step by step video & image solution for The bar graph given below presents the marks (out of 100) obtained by 10 students in a subject. यह दंड आरेख एक विषय में 10 छात्रों के प्राप्तांक ( 100 में से ) को दर्शाता है | What is the average of the marks obtained by all the students? सभी छात्रों के द्वारा प्राप्त किये गए अंकों का औसत क्या है ? by Maths experts to help you in doubts & scoring excellent marks in Class 14 exams.
Updated on:21/07/2023Topper's Solved these Questions
Similar Questions
The bar graph given below presents the marks (out of 100) obtained by 10 students in a subject.
यह दंड आरेख एक विषय में 10 छात्रों के प्राप्तांक ( 100 में से ) को दर्शाता है |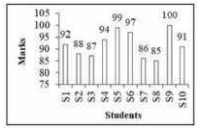 The average of marks obtained by S3 and S5 is what percent less than the marks obtained by S9?
S3 और S5 के प्राप्तांक का औसत S9 के प्राप्तांक से कितना प्रतिशत कम है ?
View SolutionThe bar graph given below presents the marks (out of 100) obtained by 10 students in a subject.
यह दंड आरेख एक विषय में 10 छात्रों के प्राप्तांक ( 100 में से ) को दर्शाता है |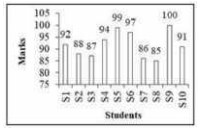 The marks obtained by S5 is how much percent more than the average marks of the students
(correct to two decimal)?
S5 का प्राप्तांक छात्रों के औसत अंक से कितना प्रतिशत अधिक है ?
View Solution
Knowledge Check
The Bar graph given below presents the marks (out of 100) obtained by 10 students in a subject.
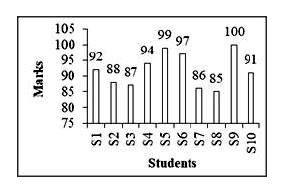
What is the average of the marks obtained by all the students?AA)91.9BB)90.9CC)89.9DD)82.9The Bar graph given below presents the marks (out of 100) obtained by 10 students in a subject.
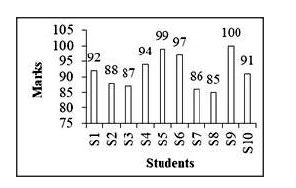
The average of marks obtained by S3 and 55 is what percent less than the marks obtained by S9?A8%B10%C7%D9%The Bar graph given below presents the marks (out of 100) obtained by 10 students in a subject.
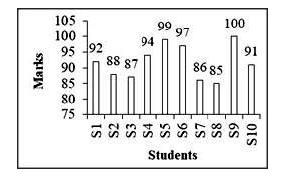
The marks obtained by S5 is how much percent more than the average marks of the students (correct to two decimal)?A12.73%B22.73%C7.73%D17.73%
The Table given below presents the marks obtained by three students in five examinations.
नीचे दी गयी तालिका पांच परीक्षाओं के तीन विषयों में छात्रों के द्वारा प्राप्त किये गए अंकों को दर्शाती है |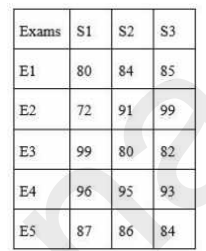 What is the average of marks obtained by S3 per exam?
S3 द्वारा हर परीक्षा में प्राप्त किये गए अंकों का औसत कितना है ?
View SolutionThe Table given below presents the marks obtained by three students in five examinations.
नीचे दी गयी तालिका पांच परीक्षाओं के तीन विषयों में छात्रों के द्वारा प्राप्त किये गए अंकों को दर्शाती है |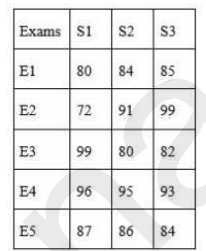 What is the sum of marks obtained by S1 in Exam E4, S2 in Exam E1, S3 in Exam E3 and E5?
S1 के द्वारा परीक्षा E4 में, S2 के द्वारा परीक्षा E1 में, तथा S3 के द्वारा परीक्षा E3 और E5 में प्राप्त किये गए अंकों का जोड़ कितना है ?
View SolutionThe following bar graph shows the marks (out of 100) of students A, B, C, D, E and F in the subjects mentioned.
निम्नलिखित दंड आरेख में, वर्णित विषयों में छात्रों A, B, C, D, E और F के अंक (100 में से) दिखाए गए हैं। Based on this, only 2 students crossed the average marks in which subject:
इसके आधार पर, केवल 2 छात्रों ने किस विषय में औसत अंकों को पार किया है?
View SolutionThe given graph shows the marks obtained by students in an examination.
दिया गया आरेख किसी परीक्षा में छात्रों के प्राप्तांक दर्शाता है |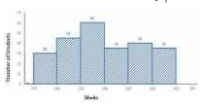 The number of students who obtained less than 300 marks is what percent more than the number of students who obtained 350 or more marks?
300 अंक से कम प्राप्त करने वाले छात्रों की संख्या 350 या इससे अधिक अंक प्राप्त करने वाले छात्रों की संख्या से कितना प्रतिशत अधिक है ?
View SolutionThe given Bar Graph presents the number of students of two schools for six years.
दिया गया दंड आरेख छः वर्ष की अवधि में दो विद्यालयों में छात्रों की संख्या को दर्शाता है |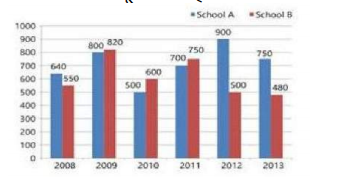
What is the average of the number of students from school A during the six year period?
छः वर्षों की अवधि में विद्यालय A के छात्रों की संख्या का औसत ज्ञात करें |
View Solution
