The pie chart given below presents the percentage of the number of motor cycles of different colours out of the total number of motor cycles, parked in an area. The central angles shown in the Pie chart are not as per any chosen scale.
नीचे दिया गया वृत्त-आरेख किसी क्षेत्र में खड़ी की गयीं कुल मोटरसाइकिलों में से अलग-अलग रंग की
मोटरसाइकिलों की संख्या का प्रतिशत दर्शाता है | इस वृत्त-आरेख में दिए गए केंद्रीय कोण किसी भी चयनित पैमाने के अनुसार नहीं हैं |
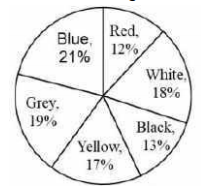 If the total number of motor cycles parked is 2300, the number having white colour is how much less than those having the blue colour?
यदि खड़ी की गयी मोटरसाइकिलों की कुल संख्या 2300 है, तो सफ़ेद
रंग की मोटरसाइकिलों की संख्या नीले रंग की मोटरसाइकिलों की संख्या से कितनी कम है ?
66
72
63
69
Step by step video & image solution for The pie chart given below presents the percentage of the number of motor cycles of different colours out of the total number of motor cycles, parked in an area. The central angles shown in the Pie chart are not as per any chosen scale. नीचे दिया गया वृत्त-आरेख किसी क्षेत्र में खड़ी की गयीं कुल मोटरसाइकिलों में से अलग-अलग रंग की मोटरसाइकिलों की संख्या का प्रतिशत दर्शाता है | इस वृत्त-आरेख में दिए गए केंद्रीय कोण किसी भी चयनित पैमाने के अनुसार नहीं हैं | If the total number of motor cycles parked is 2300, the number having white colour is how much less than those having the blue colour? यदि खड़ी की गयी मोटरसाइकिलों की कुल संख्या 2300 है, तो सफ़ेद रंग की मोटरसाइकिलों की संख्या नीले रंग की मोटरसाइकिलों की संख्या से कितनी कम है ? by Maths experts to help you in doubts & scoring excellent marks in Class 14 exams.
Updated on:21/07/2023Topper's Solved these Questions
Similar Questions
The graphs of the equations 3x+y-5=0 and 2x-y-5=0 intersect at the point P(α,β). What is the value of (3α+β) ?
समीकरण 3x+y-5=0 तथा 2x-y-5=0 के आरेख एक बिंदु P(α,β) पर एक-दूसरे को काटते है (3α+β) का मान क्या है ?
View SolutionAfter giving two successive discounts, each of x%, on the marked price of an article, total discount is Rs. 259.20. If the marked price of the article is Rs. 720, then the value of x is :
View SolutionThe given Bar graph presents the Demand and Production of motorcycles of five companies (in lakhs) दिया गया दंड आरेख पांच कंपनियों के संबंध में मोटरसाइकिलों की मांग और उत्पादन ( लाख में ) को दर्शाता है| What is the ratio of the total Demand of motorcycles of companies A and D taken together to the Production of motorcycles of company C? कंपनी A और D को मिलाकर मोटरसाइकिलों की कुल मांग का कंपनी C की मोटरसाइकिलों के उत्पादन के साथ अनुपात ज्ञात करें |
View SolutionThe table given below presents the number of books on different subjects kept on separate shelves. Subjects with odd and even numbers are of Arts and Science respectively. नीचे दी गयी तालिका अलग-अलग विषयों की पुस्तकों की संख्या को दर्शाता है जिन्हें अलग-अलग खानों में रखा गया है | विषम तथा सम संख्या के विषय क्रमशः कला एवं विज्ञान हैं | The number of books of S3 is what percent (correct to one decimal place) of the average number of Science books? S3 के पुस्तकों की संख्या विज्ञान की पुस्तकों की औसत संख्या ( एक दशमलव स्थान तक ) का कितना प्रतिशत है ?
View SolutionThe pie-chart given below shows the number of laptops in an office provided by six different companies in the percentage of total number of laptops. The central angles given in the pie chart are not accurate to any scale. नीचे दिया गया वृत्त-आरेख, छह अलग-अलग कम्पनियों द्वारा किसी कार्यालय में प्रदत्त लैपटॉप की संख्या को, लेपटॉपों की कुल संख्या के प्रतिशत के रूप में दर्शाता है | वृत्त-आरेख में प्रदर्शित केंद्रीय कोण किसी चयनित पैमाने के अनुसार नहीं है | To what degree is the corresponding central angle (to one decimal place) of laptops provided by company C6? कंपनी C6 द्वारा प्रदत्त लैपटॉपों का संगत केन्द्रीय कोण (दशमलव के एक स्थान तक) कितनी डिग्री का है ?
View SolutionThe pie-chart given below shows the number of laptops in an office provided by six different companies in the percentage of total number of laptops. The central angles given in the pie chart are not accurate to any scale. नीचे दिया गया वृत्त-आरेख, छह अलग-अलग कम्पनियों द्वारा किसी कार्यालय में प्रदत्त लैपटॉप की संख्या को, लेपटॉपों की कुल संख्या के प्रतिशत के रूप में दर्शाता है | वृत्त-आरेख में प्रदर्शित केंद्रीय कोण किसी चयनित पैमाने के अनुसार नहीं है | What is the ratio of the number of laptops of company C1 to those of company C3 ? कंपनी C1 तथा कंपनी C3 के लेपटॉपों की संख्या का अनुपात कितना है ?
View SolutionThe pie-chart given below shows the number of laptops in an office provided by six different companies in the percentage of total number of laptops. The central angles given in the pie chart are not accurate to any scale. नीचे दिया गया वृत्त-आरेख, छह अलग-अलग कम्पनियों द्वारा किसी कार्यालय में प्रदत्त लैपटॉप की संख्या को, लेपटॉपों की कुल संख्या के प्रतिशत के रूप में दर्शाता है | वृत्त-आरेख में प्रदर्शित केंद्रीय कोण किसी चयनित पैमाने के अनुसार नहीं है | If the total number of laptops in office is 3800, then find the difference between the laptops of company C2 and C5 ? कार्यालय में यदि लैपटॉपों की कुल संख्या 3800 है तो कंपनी C2 तथा C5 के लैपटॉपों की संख्या में अंतर कितना है ?
View SolutionThe bar graph given below shows the number of cars parked in a parking area during ten different days .
नीचे दिया गया दंड आरेख किसी पार्किंग क्षेत्र में दस अलग-अलग दिनों में खड़ी कारों की संख्या को दर्शाता है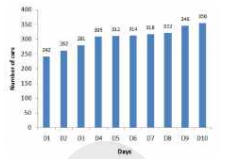 What is the difference between the numbers of cars parked in D3 and D8 ?
D3 तथा D8 में खड़ी कारों की संख्या का अंतर कितना है ?
View SolutionThe bar graph given below shows the number of cars parked in a parking area during ten different days. What is the total number of cars parked in the parking area for all 10 days ?
नीचे दिया गया दंड आरेख किसी पार्किंग क्षेत्र में दस अलग-अलग दिनों में खड़ी कारों की संख्या को दर्शाता है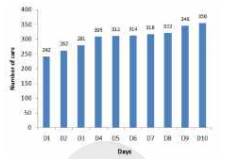 पार्किंग क्षेत्र में सभी 10 दिनों में खड़ी कारों की कुल संख्या कितनी है ?
View SolutionThe pie chart given below presents the percentage of the number of motor cycles of different colours out of the total number of motor cycles, parked in an area. The central angles shown in the Pie chart are not as per any chosen scale.
नीचे दिया गया वृत्त-आरेख किसी क्षेत्र में खड़ी की गयीं कुल मोटरसाइकिलों में से अलग-अलग रंग की मोटरसाइकिलों की संख्या का प्रतिशत दर्शाता है | इस वृत्त-आरेख में दिए गए केंद्रीय कोण किसी भी चयनित पैमाने के अनुसार नहीं हैं |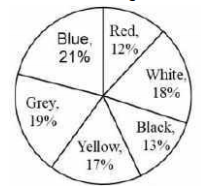 What is the central angle (nearest to one degree) corresponding to the motor cycles of black colour?
काले रंग की मोटरसाइकिल का संगत केंद्रीय कोण कितने डिग्री (एक डिग्री के निकटतम ) का है ?
View SolutionThe pie chart given below presents the percentage of the number of motor cycles of different colours out of the total number of motor cycles, parked in an area. The central angles shown in the Pie chart are not as per any chosen scale.
नीचे दिया गया वृत्त-आरेख किसी क्षेत्र में खड़ी की गयीं कुल मोटरसाइकिलों में से अलग-अलग रंग की मोटरसाइकिलों की संख्या का प्रतिशत दर्शाता है | इस वृत्त-आरेख में दिए गए केंद्रीय कोण किसी भी चयनित पैमाने के अनुसार नहीं हैं |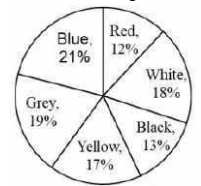 If the total number of motor cycles parked is 2300, then what is the number of red colour motor
cycles out of them?
यदि खड़ी की गयी मोटरसाइिकलों की कुल संख्या 2300 है, तो इनमें से लाल रंग की मोटरसाइिकल कितनी है ?
View SolutionThe Bar graph shown below presents the number of employees in an office during eight consecutive years.
नीचे दिया गया दंड आरेख किसी कार्यालय में आठ लगातार वर्षों के दौरान कर्मचारियों की संख्या को दर्शाता है |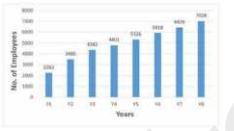
The number of employees in year Y2 is how much percent less than the average number of employees per year?
वर्ष Y2 में कर्मचारियों की संख्या प्रति वर्ष कर्मचारियों की औसत संख्या से कितना प्रतिशत कम है ?
View SolutionThe bar graph given below presents the number of books sold by a bookseller during different months of a year.
नीचे दिया गया दंड आरेख एक पुस्तक विक्रेता के द्वारा किसी वर्ष के अलग-अलग महीनों में बेची गयी पुस्तकों की संख्या को दर्शाता है |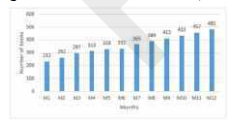 The number of books sold in month M3 is what percent of books sold in month M6?
माह M3 में बेची गयी पुस्तकों की संख्या माह M6 में बेची गयी पुस्तकों की संख्या का कितना प्रतिशत है ?
View SolutionThe bar graph given below presents the number of books sold by a bookseller during different months of a year.
नीचे दिया गया दंड आरेख एक पुस्तक विक्रेता के द्वारा किसी वर्ष के अलग-अलग महीनों में बेची गयी पुस्तकों की संख्या को दर्शाता है |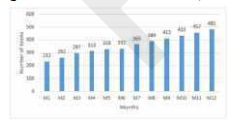 What is the total number of books sold by the bookseller in the year?
वर्ष में इस पुस्तक विक्रेता के द्वारा बेची गयी पुस्तकों की संख्या कुल कितनी है ?
View SolutionThe bar graph given below presents the number of books sold by a bookseller during different months of a year.
नीचे दिया गया दंड आरेख एक पुस्तक विक्रेता के द्वारा किसी वर्ष के अलग-अलग महीनों में बेची गयी पुस्तकों की संख्या को दर्शाता है |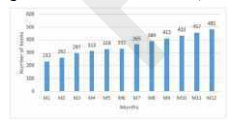
The number of books sold in month M8 is how much more than the average number of books sold per month?
माह M8 में बेची गयी पुस्तकों की संख्या प्रति माह बेची गयी पुस्तकों की औसत संख्या से कितना प्रतिशत अधिक है ?
View Solution
