The Bar graph shown below presents the number of employees in an office during eight consecutive years.
नीचे दिया गया दंड आरेख किसी कार्यालय में आठ लगातार वर्षों के दौरान कर्मचारियों की संख्या को
दर्शाता है |
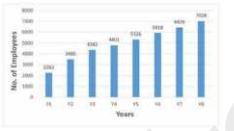
The number of employees in year Y2 is how much percent less than the average number of employees per year?
वर्ष Y2 में कर्मचारियों की संख्या प्रति वर्ष कर्मचारियों की औसत संख्या से कितना प्रतिशत कम है ?
29.57%
23.57%
41.54%
35.57%
Step by step video & image solution for The Bar graph shown below presents the number of employees in an office during eight consecutive years. नीचे दिया गया दंड आरेख किसी कार्यालय में आठ लगातार वर्षों के दौरान कर्मचारियों की संख्या को दर्शाता है | The number of employees in year Y2 is how much percent less than the average number of employees per year? वर्ष Y2 में कर्मचारियों की संख्या प्रति वर्ष कर्मचारियों की औसत संख्या से कितना प्रतिशत कम है ? by Maths experts to help you in doubts & scoring excellent marks in Class 14 exams.
Updated on:21/07/2023Topper's Solved these Questions
Similar Questions
The Bar graph shown below presents the number of employees in an office during eight consecutive years.
नीचे दिया गया दंड आरेख किसी कार्यालय में आठ लगातार वर्षों के दौरान कर्मचारियों की संख्या को दर्शाता है |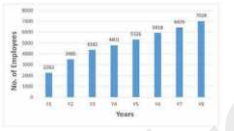
What is the average number of employees per year?
प्रति वर्ष कर्मचारियों की औसत संख्या कितनी है ?
View SolutionThe Bar graph shown below presents the number of employees in an office during eight consecutive years.
नीचे दिया गया दंड आरेख किसी कार्यालय में आठ लगातार वर्षों के दौरान कर्मचारियों की संख्या को दर्शाता है |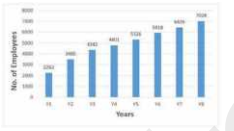
What is the growth percentage in the number of employees from Y5 to Y6?
Y5 से Y6 तक कर्मचारियों की संख्या में वृद्धि का प्रतिशत कितना है ?
View SolutionThe Bar graph shown below presents the number of employees in an office during eight consecutive years.
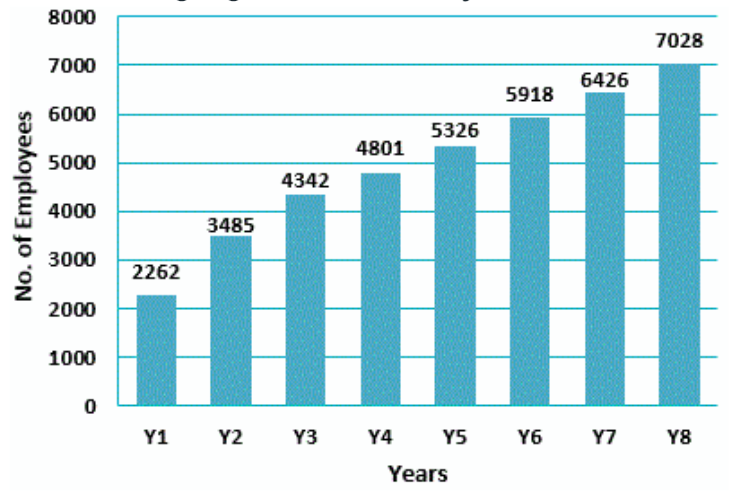
What is the average number of employess per year?
View SolutionThe Bar graph shown below presents the number of employees in an office during eight consecutive years.

What is the growth percentage in the number of empployees from Y5 to Y6?
View SolutionThe bar graph given below presents the number of books sold by a bookseller during different months of a year.
नीचे दिया गया दंड आरेख एक पुस्तक विक्रेता के द्वारा किसी वर्ष के अलग-अलग महीनों में बेची गयी पुस्तकों की संख्या को दर्शाता है |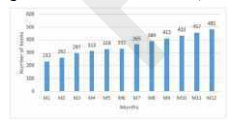
The number of books sold in month M8 is how much more than the average number of books sold per month?
माह M8 में बेची गयी पुस्तकों की संख्या प्रति माह बेची गयी पुस्तकों की औसत संख्या से कितना प्रतिशत अधिक है ?
View SolutionThe Bar graph given below presents the number of shoes manufactured by a company on the different days of a week.
नीचे दिया गया दंड आरेख एक कंपनी के द्वारा सप्ताह के अलग-अलग दिनों को बनाए गए जूतों की संख्या प्रस्तुत करता है |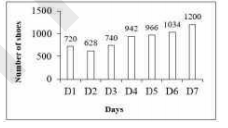 The number of shoes manufactured on D5 is how much more than the average number of shoes manufactured per day?
D5 को बनाए गए जूतों की संख्या प्रतिदिन बनाए गए जूतों की औसत संख्या से कितनी अधिक है ?
View SolutionThe bar graph given below presents the number of books sold by a bookseller during different months of a year.
नीचे दिया गया दंड आरेख एक पुस्तक विक्रेता के द्वारा किसी वर्ष के अलग-अलग महीनों में बेची गयी पुस्तकों की संख्या को दर्शाता है |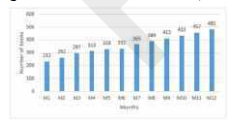 The number of books sold in month M3 is what percent of books sold in month M6?
माह M3 में बेची गयी पुस्तकों की संख्या माह M6 में बेची गयी पुस्तकों की संख्या का कितना प्रतिशत है ?
View SolutionThe Bar graph shown below presents the number of employess in an office during consecutive years.

The number of employess in year Y2 is how much percent less than average number of employees per year?
View SolutionThe bar graph given below presents the number of books sold by a bookseller during different months of a year.
नीचे दिया गया दंड आरेख एक पुस्तक विक्रेता के द्वारा किसी वर्ष के अलग-अलग महीनों में बेची गयी पुस्तकों की संख्या को दर्शाता है |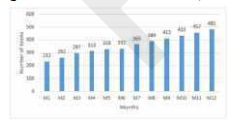 What is the total number of books sold by the bookseller in the year?
वर्ष में इस पुस्तक विक्रेता के द्वारा बेची गयी पुस्तकों की संख्या कुल कितनी है ?
View SolutionStudy the given graph and answer the question that follows.
दिए गए आरेख का अध्ययन करें और उन सवालों के जवाब दें जो अनुसरण करते हैं।
Break up for distribution ( degree wise) of the employees working in five departments (A, B, C, D and E) in a company
एक कंपनी के पाँच विभागों (A, B, C, D and E) में कार्य करने वाले कर्मचारियों का वितरण (डिग्री अनुसार):
The number of employees in department B is what percent of the total number of employees working in department D and E ?
विभाग B में कर्मचारियों की संख्या विभाग D और E में कार्यरत कर्मचारियों की कुल संख्या का कितना प्रतिशत है?
View Solution
