Study the given graph and answer the question that follows.
दिए गए आरेख का अध्ययन करें और उन सवालों के जवाब दें जो अनुसरण करते हैं।
Break up for distribution ( degree wise) of the employees working in five departments (A, B, C, D and E) in a company
एक कंपनी के पाँच विभागों (A, B, C, D and E) में कार्य करने वाले कर्मचारियों का वितरण (डिग्री अनुसार):

The number of employees in department B is what percent of the total number of employees
working in department D and E ?
विभाग B में कर्मचारियों की संख्या विभाग D और E में कार्यरत
कर्मचारियों की कुल संख्या का कितना प्रतिशत है?
45.8
48.6
50.8
51.2
Step by step video & image solution for Study the given graph and answer the question that follows. दिए गए आरेख का अध्ययन करें और उन सवालों के जवाब दें जो अनुसरण करते हैं। Break up for distribution ( degree wise) of the employees working in five departments (A, B, C, D and E) in a company एक कंपनी के पाँच विभागों (A, B, C, D and E) में कार्य करने वाले कर्मचारियों का वितरण (डिग्री अनुसार): The number of employees in department B is what percent of the total number of employees working in department D and E ? विभाग B में कर्मचारियों की संख्या विभाग D और E में कार्यरत कर्मचारियों की कुल संख्या का कितना प्रतिशत है? by Maths experts to help you in doubts & scoring excellent marks in Class 14 exams.
Updated on:21/07/2023Topper's Solved these Questions
Similar Questions
Study the given graph and answer the question that follows:
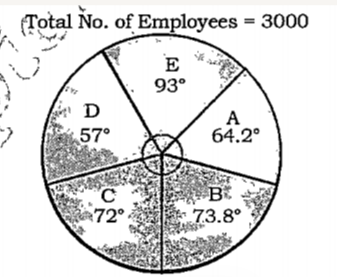
Breakup for distribution (degree wise) of the employees working in five departments (A,B,C,D, and E) in a company The number of employees in department B is what percent of the total number of employees working in department D and E?
दिए गए ग्राफ का अध्ययन करें और नीचे दिए गए प्रश्न का उत्त्तर दें। कंपनी के पांच विभागों (A, B, C, D और E) में काम कर रहे कर्मचारियों का वितरण
(डिग्री में) है। विभाग B में कर्मचारियों को संख्या, विभाग D और E में कार्य करने वाले कर्मचारियों की कुल संख्या की कितनी प्रतिशत है ?
View SolutionStudy the given graph and answer the question that follows: Breakup for distribution (degree wise) of the employees working in five departments (A,B,C,D, and E) in a company The total numbers of employees working in departments A and C exceeds the total number of employees working in departments B and D by x. The value of x lies between:
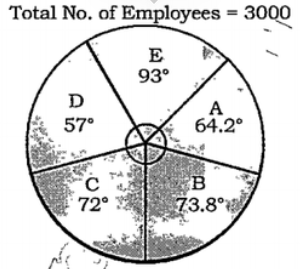
दिए गए ग्राफ का अध्ययन करें और नीचे दिए गए प्रश्न का उत्तर दें। विभाग A और C में कार्य करने वाले कर्मचारियों की कुल संख्या, विभाग B और D में कार्य करने वाले कर्मचारियों की कुल संख्या से अधिक है। x का मान किसके बीच होगा?
View Solution
Knowledge Check
Study the given graph and answer the questopm the follows
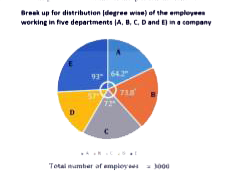
The number of employees in department B is what per cent of the total number of employees woking departments D and E ?A48.6B45.8C50.4D49.2Study the pie-chart and answer the question. Distribution (degree-wise) of the number of employees of a company working in 5 departments A, B, C, D and E.
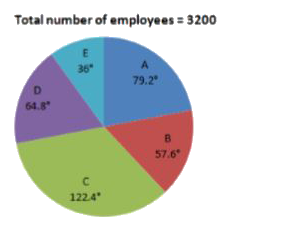
The number of employees working in department C is what percentage more than the total number of employees working in D and E? (Your answer should be correct to one decimal place.)A23.2B20.6C22.8D21.4
Study the given graph and answer the questions that follow.
दिए गए आरेख का अध्ययन करें और उन सवालों के जवाब दें, जो अनुसरण करते हैं।
The total revenue in 2015 and 2017 is what percent of the total expenditure of the company in 2016, 2018 and 2019 (correct to one decimal place) ?
2015 और 2017 में कुल राजस्व 2016, 2018 और 2019 में कंपनी के कुल व्यय का कितना प्रतिशत है (एक दशमलव स्थान तक )?
View SolutionStudy the given graph and answer the question that follows:
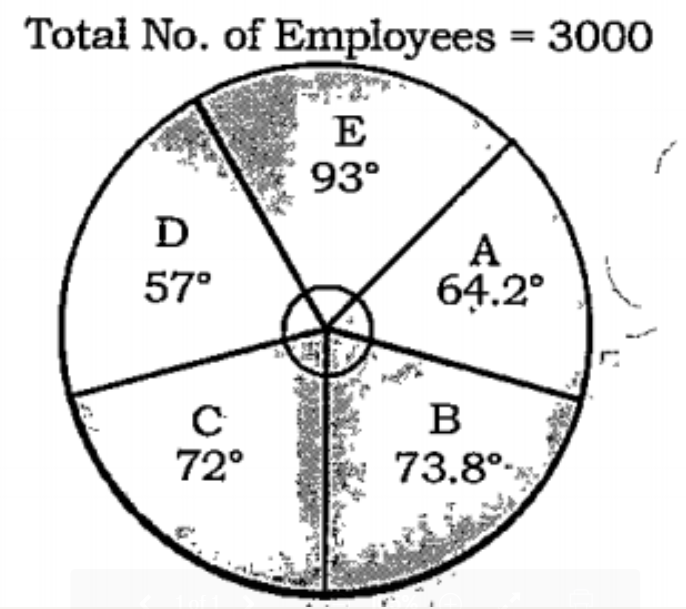 Break up for distribution (degree wise) of the employees working in five departments (A,B,C,D, and E) in a company. If 20% of the employees working in department E are transferred to department A, then the difference between eh number of employees in A and 124% of the employees working in department C is:
दिए गए ग्राफ का अध्ययन करें और नीचे दिए गए प्रश्न का उत्त्तर दें। कंपनी के पांच विभागों (A,B,C,D, और E) में काम कर रहे कर्मचारियों का वितरण
(डिग्री में) यदि विभाग E में कार्य करने वाले 20% कर्मचारियों को विभाग A में स्थानांतरित कर दिया जाता है, तो विभाग A में कर्मचारियों की संख्या और विभाग C में कार्यरत 124% कार्मचारियों के बीच अंतर ज्ञात कीजिए।
View SolutionStudy the pie chart and answer the question that follows
आरेख का अध्ययन करें और प्रश्न का उत्तर दे।
Break up (degree wise) of students in terms of specialization in different areas (A,B,C,D&E) in MBA program.
MBA कार्यक्रम में विभिन्न क्षेत्रों (A, B, C, D और E) में विशेषज्ञता के संदर्भ में छात्रों का वितरण
The number of students specialising in E is what percent more than that of students specialising in C?
E में विशेषज्ञता प्राप्त छात्रों की संख्या, C में विशेषज्ञता प्राप्त छात्रों की संख्या की तुलना में कितना प्रतिशत अधिक है?
View SolutionStudy the pie chart and answer the question. Distribution of the number of employees of a companyworking in 5 department A, B , C, D and E
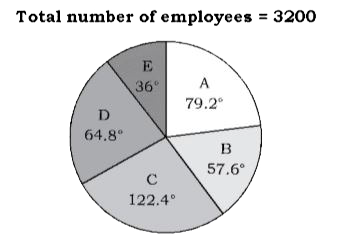
the number of employees working in department C is what percentage more than the total number of employees working in D and E?
View SolutionStudy the graph and answer the questions based on the graph:
आरेख का अध्ययन करें और आरेख के आधार पर प्रश्नों के उत्तर दें: On which day the production was 1/5 th of the total production?
किस दिन उत्पादन कुल उत्पादन का 1/5 था?
View SolutionThe given pie chart shows the percentage distribution of 450 employees in an organization. Study the pie chart and answer the questions that follow
दिए गए पाई चार्ट एक संगठन में 450 कर्मचारियों के प्रतिशत को दर्शाता है। पाई चार्ट का अध्ययन करें और आने वाले प्रश्नों का उत्तर दें।
What is the central angle of the sector representing the number of employees in department A?
विभाग A में कर्मचारियों की संख्या का प्रतिनिधित्व करने वाले क्षेत्र का केंद्रीय कोण क्या है?
View Solution
