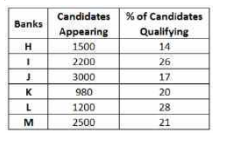
The table shows the number of candidates appearing in the interview for a post in six banks (H, I, J, K, L, M) and the percentage of candidates found eligible.
यह तालिका छह बैंकों (H, I, J, K, L, M) में किसी पद हेतु साक्षात्कार में शामिल होने वाले उम्मीदवारों की संख्या तथा योग्य पाए जाने वाले उम्मीदवारों के प्रतिशत को दर्शाती है |
 What is the ratio of the number of candidates found eligible in Bank H to the number of candidates found eligible in Bank L ?
बैंक H में योग्य पाए गए उम्मीदवारों की संख्या और बैंक L में योग्य पाए गए उम्मीदवारों की संख्या का संबंधित अनुपात कितना था ?
2:5
3:7
5:8
5:6
Step by step video & image solution for The table shows the number of candidates appearing in the interview for a post in six banks (H, I, J, K, L, M) and the percentage of candidates found eligible. यह तालिका छह बैंकों (H, I, J, K, L, M) में किसी पद हेतु साक्षात्कार में शामिल होने वाले उम्मीदवारों की संख्या तथा योग्य पाए जाने वाले उम्मीदवारों के प्रतिशत को दर्शाती है | What is the ratio of the number of candidates found eligible in Bank H to the number of candidates found eligible in Bank L ? बैंक H में योग्य पाए गए उम्मीदवारों की संख्या और बैंक L में योग्य पाए गए उम्मीदवारों की संख्या का संबंधित अनुपात कितना था ? by Maths experts to help you in doubts & scoring excellent marks in Class 14 exams.
Updated on:21/07/2023Topper's Solved these Questions
Similar Questions
The graphs of the equations 3x+y-5=0 and 2x-y-5=0 intersect at the point P(α,β). What is the value of (3α+β) ?
समीकरण 3x+y-5=0 तथा 2x-y-5=0 के आरेख एक बिंदु P(α,β) पर एक-दूसरे को काटते है (3α+β) का मान क्या है ?
View SolutionAfter giving two successive discounts, each of x%, on the marked price of an article, total discount is Rs. 259.20. If the marked price of the article is Rs. 720, then the value of x is :
View SolutionWhich of the following are correct chain isomers of butane ? (i)
View SolutionDetermine the point of symmetry of a regular hexagon.
View SolutionMatch the following Column A to Column B

View SolutionMatch the following Column A to Column B

View SolutionMatch the following Column A to Column B

View SolutionThe inequation represented by the graph given below is :
View SolutionThe inequation that best describes the graph given below is _________
View SolutionThe inequation that best describes the following graph is _________
View SolutionThe table shows the number of candidates appearing in the interview for a post in six banks (H, I, J, K, L, M) and the percentage of candidates found eligible. यह तालिका छह बैंकों (H, I, J, K, L, M) में किसी पद हेतु साक्षात्कार में शामिल होने वाले उम्मीदवारों की संख्या तथा योग्य पाए जाने वाले उम्मीदवारों के प्रतिशत को दर्शाती है | The number of candidates found ‘not eligible’ in Bank K is approximately what percent of the number of candidates found ‘not eligible’ in Bank I ? ( to the nearest integer ) बैंक K में योग्य नही पाए गए उम्मीदवारों की संख्या, बैंक 1 में योग्य नहीं पाए गए उम्मीदवारों की संख्या का लगभग कितना प्रतिशत (निकटतम पूर्णाक में) है ?
View SolutionThe table shows the number of candidates appearing in the interview for a post in six banks (H, I, J, K, L, M) and the percentage of candidates found eligible. यह तालिका छह बैंकों (H, I, J, K, L, M) में किसी पद हेतु साक्षात्कार में शामिल होने वाले उम्मीदवारों की संख्या तथा योग्य पाए जाने वाले उम्मीदवारों के प्रतिशत को दर्शाती है | What was the average number of candidates appeared in the interview for Banks H, J and L taken together ? बैंक H, J तथा L में कु ल मिलाकर साक्षात्कार में शामिल होने वाले उम्मीदवारों की औसत संख्या कितनी थी?
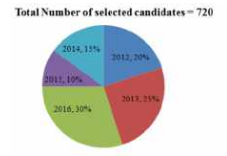
View SolutionThe Pie-chart given here shows the percentage of candidates selected in an examination from 2012 to 2016.
यहाँ दिया गया वृत्त आरेख 2012 से 2016 तक किसी परीक्षा में चयनित उम्मीदवारों के प्रतिशत को दर्शाता है | What is the total number of selected candidates for the year 2012 and 2014 taken together ?
वर्ष 2012 तथा 2014 को मिलाकर, चयनित उम्मीदवारों की कुल संख्या है :
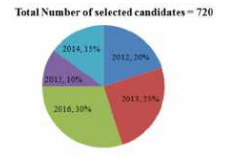
View SolutionThe Pie-chart given here shows the percentage of candidates selected in an examination from 2012 to 2016.
यहाँ दिया गया वृत्त आरेख 2012 से 2016 तक किसी परीक्षा में चयनित उम्मीदवारों के प्रतिशत को दर्शाता है | In which year the number of selected candidates is equal to the total number of selected candidates in 2012 and 2015 taken together ?
किस वर्ष में चयनित उम्मीदवारों की संख्या, वर्ष 2012 तथा 2015 को एक साथ मिलाकर चयनित उम्मीदवारों की कुल संख्या के बराबर है ?
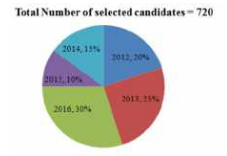
View SolutionThe Pie-chart given here shows the percentage of candidates selected in an examination from 2012 to 2016.
यहाँ दिया गया वृत्त आरेख 2012 से 2016 तक किसी परीक्षा में चयनित उम्मीदवारों के प्रतिशत को दर्शाता है | Total candidates selected in 2015 is what percentage less than the total candidates selected in 2013?
2015 में चयनित कुल उम्मीदवार, 2013 में चयनित कुल उम्मीदवारों से कितने प्रतिशत कम है ?
View Solution
