The Table given below presents the annual expenses (in thousands) on various heads made by a firm during 2006-2010. By how much percentage (correct up to two decimal places) is the average expenditure on purchases more than the average expenditure on rent?
नीचे दी गयी तालिका एक फर्म के द्वारा 2006-2010 के दौरान विभिन्न
मदों पर किये गए वार्षिक व्ययों ( हज़ार में ) को दर्शाती है | क्रय पर किया गया औसत व्यय किराये पर किये गए औसत व्यय से कितना प्रतिशत ( दो दशमलव स्थान तक ) अधिक है ?

14.23
8.00
10.00
14.87
Step by step video & image solution for The Table given below presents the annual expenses (in thousands) on various heads made by a firm during 2006-2010. By how much percentage (correct up to two decimal places) is the average expenditure on purchases more than the average expenditure on rent? नीचे दी गयी तालिका एक फर्म के द्वारा 2006-2010 के दौरान विभिन्न मदों पर किये गए वार्षिक व्ययों ( हज़ार में ) को दर्शाती है | क्रय पर किया गया औसत व्यय किराये पर किये गए औसत व्यय से कितना प्रतिशत ( दो दशमलव स्थान तक ) अधिक है ? by Maths experts to help you in doubts & scoring excellent marks in Class 14 exams.
Updated on:21/07/2023Topper's Solved these Questions
Similar Questions
The graphs of the equations 3x+y-5=0 and 2x-y-5=0 intersect at the point P(α,β). What is the value of (3α+β) ?
समीकरण 3x+y-5=0 तथा 2x-y-5=0 के आरेख एक बिंदु P(α,β) पर एक-दूसरे को काटते है (3α+β) का मान क्या है ?
View SolutionAfter giving two successive discounts, each of x%, on the marked price of an article, total discount is Rs. 259.20. If the marked price of the article is Rs. 720, then the value of x is :
View SolutionThe following pie-chart shows the monthly expenditure of a family on various items. If the family spends Rs. 825 on clothing, answer the question. निम्नलिखित पाई-चार्ट में किसी परिवार के विभिन्न मदों पर होने वाले खर्च का दर्शाया गया है। यदि परिवार वस्त्रों पर 825 रू खर्च करे तो प्रश्न का उत्तर दीजिए। The ratio of average of expenses on food, clothing and miscellaneous items to the average of expenses on savings and rent is भोजन, वस्त्र ओर विविध मदों पर होने वाले खर्च के औसत का बचत और किराये पर होने वाले खर्च के औसत से अनुपात क्या है?
View SolutionThe table shows Income and expenditure of a person for 3 years (in thousands)
यह तालिका 3 वर्षों के दौरान किसी व्यक्ति के आय एवं व्यय (हज़ार में ) को दर्शाती है |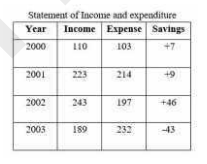 In the given table, if a person invested his savings every year at 8% simple interest, how much
interest will be earned at the end of 2003?
दी गयी तालिका के अनुसार, यदि व्यक्ति ने हर वर्ष अपनी बचत 8% साधारण ब्याज पर निवेश कर दी, तो 2003 के अंत में कितना ब्याज प्राप्त होगा ?
View SolutionThe table shows Income and expenditure of a person for 3 years (in thousands)
यह तालिका 3 वर्षों के दौरान किसी व्यक्ति के आय एवं व्यय (हज़ार में ) को दर्शाती है |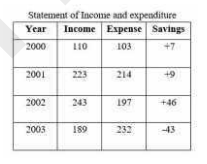 In the given table, what is the percentage of expenditure on income in the year 2002? (round
off)
दी गयी तालिका के अनुसार, वर्ष 2002 में आय पर व्यय का प्रतिशत कया है?
View SolutionThe table shows Income and expenditure of a person for 3 years (in thousands)
यह तालिका 3 वर्षों के दौरान किसी व्यक्ति के आय एवं व्यय (हज़ार में ) को दर्शाती है |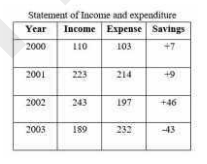 In the given table, if a person reduced his expenditure by 10% by how much would his total
savings increased?
दी गयी तालिका के अनुसार यदि व्यक्ति अपने व्यय में 10% की कमी कर ले, तो उसकी बचत में कुल कितनी वृद्धि होगी ?
View SolutionThe table shows the production of different types of cars (in thousands). यह तालिका एक कंपनी द्वारा अलग-अलग कारों के उत्पादन (हज़ार में ) को दर्शाती है | The average production of type A cars during the five years is what percent of the total production of type C cars during the five years? पांच वर्षों के दौरान A प्रकार की कारों का औसत उत्पादन पांच वर्षों के दौरान C प्रकार की कारों के कुल उत्पादन का कितना प्रतिशत है ?
View SolutionThe Table given below presents the marks obtained by three students in five examinations. नीचे दी गयी तालिका पांच परीक्षाओं के तीन विषयों में छात्रों के द्वारा प्राप्त किये गए अंकों को दर्शाती है | The marks obtained by S1 in Exam E5 is how much percentage (correct up to two places of decimal) more than that obtained by S2 in Exam E3? S1 के द्वारा परीक्षा E5 में प्राप्त किये गए अंक S2 के द्वारा परीक्षा E3 में प्राप्त किये गए अंक से कितने प्रतिशत अधिक ( दो दशमलव स्थान तक) हैं ?
View SolutionThe Table given below presents the marks obtained by three students in five examinations. नीचे दी गयी तालिका पांच परीक्षाओं के तीन विषयों में छात्रों के द्वारा प्राप्त किये गए अंकों को दर्शाती है | What is the average of marks obtained by S3 per exam? S3 द्वारा हर परीक्षा में प्राप्त किये गए अंकों का औसत कितना है ?
View SolutionThe Table given below presents the marks obtained by three students in five examinations. नीचे दी गयी तालिका पांच परीक्षाओं के तीन विषयों में छात्रों के द्वारा प्राप्त किये गए अंकों को दर्शाती है | What is the sum of marks obtained by S1 in Exam E4, S2 in Exam E1, S3 in Exam E3 and E5? S1 के द्वारा परीक्षा E4 में, S2 के द्वारा परीक्षा E1 में, तथा S3 के द्वारा परीक्षा E3 और E5 में प्राप्त किये गए अंकों का जोड़ कितना है ?
View SolutionThe Table given below presents the Rainfall (in mm) in two cities on different days of a week.
नीचे दी गयी तालिका दो शहरों में सप्ताह के अलग-अलग दिन हुई बारिश (मिमी में ) को दर्शाती है |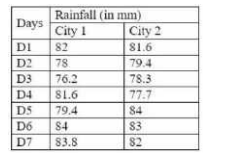 What is the difference (correct up to two decimal places) in average rainfall in two cities per day?
प्रति दिन इन दो शहरों में होने वाली औसत वर्षा में क्या अंतर ( दशमलव के दो स्थान तक) है ?
View SolutionThe bar graph given below shows the profit (in multiples of thousand rupees) of a company during the year 2010-2018. The average profit for the year 2015-2017 is what percentage more than the 2012 profit? नीचे दिए गए दंड आरेख में वर्ष 2010-2018 के दौरान किसी कंपनी के लाभ (हजार रुपए के गुणक में) को दर्शाया गया है | वर्ष 2015-2017 का औसत लाभ 2012 के लाभ से कितना प्रतिशत अधिक है ?
View SolutionThe Pie-chart given below shows the figures of various heads of expenditure incurred by Anurag in a year. In how many heads is his expenditure less than the expenditure he incurred on tax?
नीचे दिया गया वृत्त आरेख अनुराग द्वारा किसी वर्ष में किए गए व्यय के विभिन्न शीर्षों के आंकड़ों को दर्शाता है | उसके द्वारा टैक्स पर किए गए व्यय की तुलना में कितने शीर्षों में उसके व्यय कम हैं ?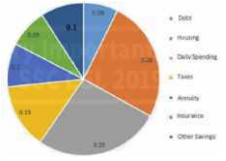
View SolutionThe Pie chart given below presents the figures of different heads of expenditure made in a year by Anurag. If his total annual income is Rs1,20,000, then how much did he spend on Housing?
नीचे दिया गया वृत्त आरेख एक वर्ष में अनुराग के द्वारा किये गए विभिन्न प्रकार के व्ययों को दर्शाता है | यदि उसकी कुल वार्षिक आय 1,20,000 है, तो उसने आवास पर कितना खर्च किया ?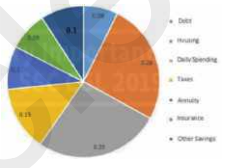
View SolutionThe table given below presents the figures of the production (in thousands) of different types of vehicles by a company during the year 2013-18.
नीचे दी गयी तालिका वर्ष 2013-18 के दौरान एक कंपनी के द्वारा विभिन्न प्रकार के वाहनों के उत्पादन ( हज़ार में)के आंकड़ों को प्रस्तुत करती है |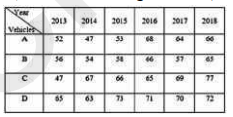 In how many years is the production of type C vehicles, below the average production of type D vehicles over six years?
कितने वर्ष C प्रकार के वाहनों का उत्पादन इन छः वर्षों में D प्रकार के वाहनों के औसत उत्पादन से कम रहा है ?
View Solution