The given table shows the number (in thousands) of cars of five different models A, B, C, D and E produced during years 2012-2017. Study the table and answer the questions that follow.
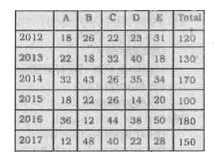
In the year 2015, which type of car constitutes exactly 20% of the total number of cars produced that year?
D
B
E
A
Step by step video & image solution for The given table shows the number (in thousands) of cars of five different models A, B, C, D and E produced during years 2012-2017. Study the table and answer the questions that follow. In the year 2015, which type of car constitutes exactly 20% of the total number of cars produced that year? by Maths experts to help you in doubts & scoring excellent marks in Class 14 exams.
Updated on:21/07/2023Topper's Solved these Questions
Similar Questions
The given table shows the number (in thousands) of cars of five different models A, B, C, D and E produced during years 2012-2017. Study the table and answer the questions that follow.
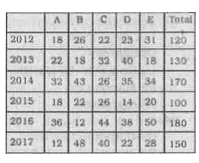
If years 2013 and 2014 are taken together, which type of cars constitue exactly 25% of the total number of cars produced in those two years?
View SolutionThe given table shows the number (in thousands) of cars of five different models A, B, C, D and E produced during years 2012-2017. Study the table and answer the questions that follow.
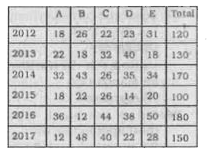
The percentage increase in the total cars in 2016 over 2012, is:
View Solution
Knowledge Check
Direction∶ The given table shows the number (in thousands) of cars of five different models A, B, C, D and E produced during years 2012-2017. Study the table and answer the question that follow.
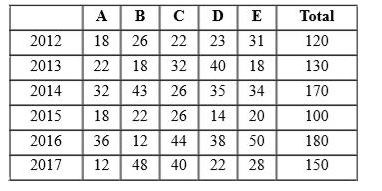
The percentage decrease in the production of which type of car in 2017, with reference to 2016, was the maximum?ADBCCADEIf 2013 and 2014 are put together, which type of cards constitute exactly 25% of the total number of cars produced in those 2 years?
AEBDCCDBThe given table represents the sale (in thousands) of cars by four companies A, B, C and D in six years. Study the table and answer the question that follows.
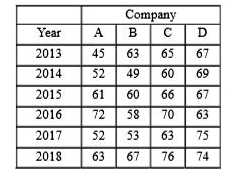
The total number of cars sold by company C in 2018 exceeds the average number of cars sold by company A during 2014 to 2018 by:A12000B14000C16000D15000
The given table shows the number (in thousands) of cars of five different models A, B, C, D and E produced during years 2012-2017. Study the table and answer the questions that follow.
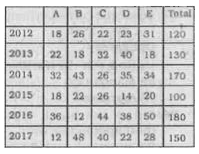
The percentage decrease in the production of which type of car in 2017, with reference to 2016, was the maximum
View SolutionThe given table shows the number (in thousands) of cars of five different models A, B, C, D and E produced during Years 2012-2017. Study the table and answer the questions that follows:
दी गयी तालिका पाँच अलग-अलग मॉडलों- A, B, C, D और E की कारों की संख्या ( हज़ार में ) दर्शाती है, जिनका उत्पादन वर्ष 2012-2017 के दौरान किया गया है | इस तालिका का अध्ययन करें और फिर पूछे गए प्रश्न का उत्तर दें |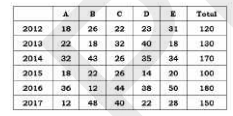 If 2013 and 2014 are put together, which type of cars constitute exactly 25% of the total number of cars produced in those two years?
यदि 2013 और 2014 को मिला दिया जाए, तो इन दो वर्षों में उत्पादित कारों की कुल संख्या का ठीक 25% भाग किस प्रकार की कारों का है ?
View SolutionThe given table shows the number (in thousands) of cars of five different models A, B, C, D and E produced during Years 2012-2017. Study the table and answer the questions that follows:
दी गयी तालिका पाँच अलग-अलग मॉडलों- A, B, C, D और E की कारों की संख्या ( हज़ार में ) दर्शाती है, जिनका उत्पादन वर्ष 2012-2017 के दौरान किया गया है | इस तालिका का अध्ययन करें और फिर पूछे गए प्रश्न का उत्तर दें |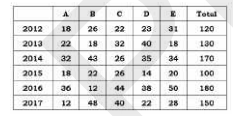 The percentage increase in the total cars in 2016 over 2012 is:
2012 की तुलना में 2016 में कुल कारों में कितने प्रतिशत की वृद्धि हुई
View SolutionStudy the graph and answer the question.
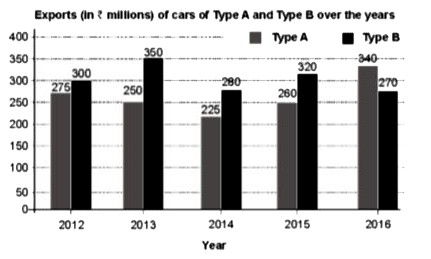
In which year, were the exports of type B cars exactly 20% more than the exports of type A cars in 2014?
View SolutionStudy the graph and answer the question
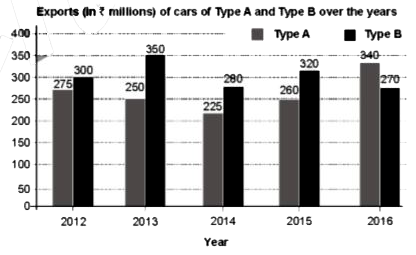
In which year, were the exports of type B cars exactly 20% more than the exports of type A cars in 2014?
View Solution
