From the following table, how many patients were in the age group 40-60?
दिए गए तालिका के अनुसार कितने मरीज़ 40-60 आयु वर्ग के थे ?

16
6
29
45
Step by step video & image solution for From the following table, how many patients were in the age group 40-60? दिए गए तालिका के अनुसार कितने मरीज़ 40-60 आयु वर्ग के थे ? by Maths experts to help you in doubts & scoring excellent marks in Class 14 exams.
Updated on:21/07/2023Topper's Solved these Questions
Similar Questions
The table below shows the admission and transfer in standards 1-3 of a school.

In the given table, in Standard 1, how many students were there at the end of year 2016?
View SolutionHow many squares are there in the following figure?
दिए गए चित्र में कितने वर्ग हैं ?
View SolutionThe following table gives the frequency of vowels used in the page of a book.
निम्नलिखित तालिका एक पुस्तक के पन्नों में प्रयोग किये गए स्वर ( vowels) की आवृत्ति को दर्शाती है | As per the given data, which vowels occur less than 80 times?
दिए गए आंकड़ों के अनुसार, किन स्वरों का प्रयोग 80 बार से कम किया गया है ?
View SolutionIn the following diagram, the rectangle represents ‘doctors’, the triangle represents ‘players’, the circle represents ‘philosophers’. The numbers in different segments show the number of persons.
निम्नलिखित आरेख में आयत चिकित्स्कों का प्रतिनिधित्व करता है, त्रिभुज खिलाड़ियों? का प्रतिनिधित्व करता है तथा वृत्त 'दार्शनिकों' का प्रतिनिधित्व करता है | विभिन्न खंडो में दी गयी संख्याएं लोगों की संख्या बताती हैं | According to the given diagram, How many players are philosophers but not Doctors?
दिए गए आरेख के अनुसार कितने खिलाड़ी दार्शनिक हैं लेकिन चिकित्सक नहीं ?
View SolutionThe following table showing the percentage of the total population of a state in different age groups. Out of every 50,000 people, find the approximate number of persons below the age of 35?
निम्नलिखित तालिका एक राज्य में अलग-अलग आयु वर्ग की कुल आबादी के प्रतिशत को दर्शाती है |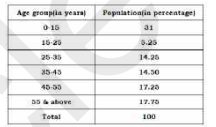
प्रत्येक 50,000 लोगों में से, 35 वर्ष से कम उम्र के लोगों की संख्या (लगभग) ज्ञात करें |
View SolutionStudy the given graph and answer the question that follows. The number of patients aged 10 or more years but below 40 years is what per cent less than the number of patients aged 50 or more years but below 80 years?
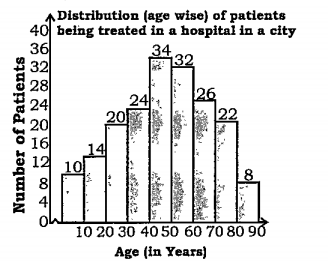
दिए गए ग्राफ का अध्ययन करें और नीचे दिए गए प्रश्न का उत्तर दें । 10 या उससे अधिक वर्ष लेकिन 40 वर्ष से कम आयु वालें मरीजों की संख्या, 50 वर्ष या उससे अधिक लेकिन 80 वर्ष से कम आयु वाले मरीजों को संख्या से कितने प्रतिशत कम हैं?
View SolutionAs per the data shown in the following table, what is the percentage of students who got less than 50 marks?
निम्नलिखित तालिका में दिए गए आंकड़ों के अनुसार, उन छात्रों का प्रतिशत क्या है जिन्हें 50 अंक से कम अंक आए हैं ?
View SolutionThe given pie-chart favourite sport of students of a school.
दिया गया पाई चार्ट एक विद्यालय के छात्रों के पसंदीदा खेल को दर्शाता है |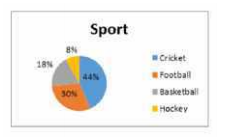 In the given pie-chart, if the school strength was 2500, how many liked cricket more than hockey?
इस पाई चार्ट के अनुसार, यदि विद्यालय में कुल 2500 छात्र थे , तो कितने छात्र क्रिकेट को हॉकी से ज्यादा पसंद करते थे ?
View SolutionThe given bar graph shows the imports and exports (in Rs crores) of steel by a country from 2013 to 2017.
दिया गया दंड आरेख एक देश के द्वारा 2013 से 2017 तक इस्पात के आयात और निर्यात ( करोड़ रुपये में) को दर्शाता है |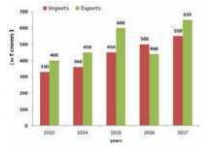 In how many years were the imports more than 80% of the average exports (per year) of the
country during the given 5 years?
दिए गए 5 वर्षों के दौरान कितने वर्ष देश के आयात देश के औसत निर्यात ( प्रति वर्ष ) के 80% से अधिक रहे हैं?
View SolutionThe given table represents the number of computers sold by four dealers A,B, C and D during the first six months of 2016. Study the table carefully and answer the questions that follows:
दी गयी तालिका चार विक्रेताओं A, B, C और D के द्वारा 2016 के पहले छः महीनों में बेचे गए कंप्यूटरों की संख्या दर्शाती है | इस तालिका का ध्यानपूर्वक अध्ययन करें तथा पूछे गए प्रश्नों का उत्तर दें |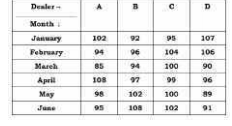 The number of months, in which the number of computers sold by dealer B was less than the
average number of computers sold by dealer C over six months, was: /
ऐसे कितने महीने हैं, जिनमें विक्रेता B के द्वारा बेचे गए कंप्पूटरों की संख्या इन छः महीनों में विक्रेता C के द्वारा बेचे गए कंप्यूटरों की औसत संख्या से कम है ?
View Solution
