Study the given chart and answer the following questions:
दिए गए चार्ट का अध्ययन करें और निम्नलिखित प्रश्नों के उत्तर दें:
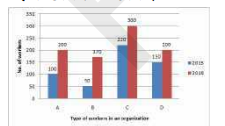 The percentage increase in the number of workers in 2018 is maximum as compared to that is
2015 in case of workers of type:
2018 में श्रमिकों की संख्या में प्रतिशत वृद्धि 2015 की तुलना में अधिकतम है, जो कि किस प्रकार के श्रमिकों के मामले में है?
C
B
D
A
Step by step video & image solution for Study the given chart and answer the following questions: दिए गए चार्ट का अध्ययन करें और निम्नलिखित प्रश्नों के उत्तर दें: The percentage increase in the number of workers in 2018 is maximum as compared to that is 2015 in case of workers of type: 2018 में श्रमिकों की संख्या में प्रतिशत वृद्धि 2015 की तुलना में अधिकतम है, जो कि किस प्रकार के श्रमिकों के मामले में है? by Maths experts to help you in doubts & scoring excellent marks in Class 14 exams.
Updated on:21/07/2023Topper's Solved these Questions
Similar Questions
In the given bar graph, the percentage decrease in the number of students in Institute A in 2016 is what percent of students in 2015.
इस दंड आरेख में संस्थान A में 2016 में छात्रों की संख्या में प्रतिशत कमी 2015 के छात्रों की संख्या का क्या प्रतिशत है ?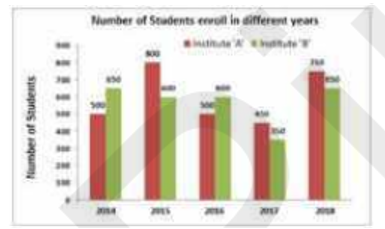
View SolutionThe following table shows the number of students of 7 college participating in extra curricular activities:
निम्न सारणी उन कॉलेजों के छात्रों की संख्या दर्शाती है, जो पाठ्येत्तर क्रियाकलापों में भाग लेते हैं।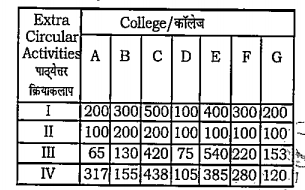 Read the table and answer the following question.
तालिका पढ़ें और निम्नलिखित प्रश्नों के उत्तर दें।
The difference of range of number of students in activity IV and the average of number of students in activity III per college is
क्रियाकलाप IV में छात्रों की संख्या के परिसर और क्रियाकलाप III में छात्रों की औसत संख्या प्रति कॉलेज का अंतर है-
View Solution
Knowledge Check
Study the following bar diagram carefully and answer the following questions :
निम्नलिखित आरेख का ध्यानपूर्वक अध्ययन करें और दिए गए प्रश्नों का उत्तर दें:
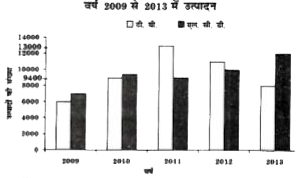
The ratio of production of TVs in the years 2009 and 2010 is.
वर्ष 2009 और 2010 में टी. वी. के उत्पादन का अनुपात -A(a)7:6B(b) 2:3C(c) 6:7D(d) 3:2Study the following bar diagram carefully and answer the following questions :
:
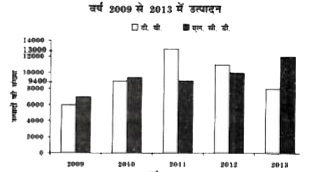
The total number of a products of electronic items is maximum in the year.A(a) 2010B(b) 2009C(c) 2011D(d) 2013Study the following bar diagram carefully and answer the following questions :
निम्नलिखित आरेख का ध्यानपूर्वक अध्ययन करें और दिए गए प्रश्नों का उत्तर दें:
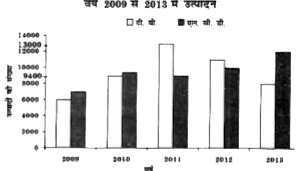
The ratio of production of LCDs in the year 2011 and 2013 is.
वर्ष 2011 और 2013 में एल. सी. डी. के उत्पादन का अनुपात हैA(a) 4:3B(b) 2:3C(c)1:4D(d)3:4
The following graph shows the number of boys and girls in class V, class VI, class VII and class VIII. Study the graph and answer the question.
निम्नलिखित आरेख कक्षा V, कक्षा VI, कक्षा VII और कक्षा VIII में लड़कों और लड़कियों की संख्या दर्शाता है। आरेख का अध्ययन करें और प्रश्न का उत्तर दें। In which class, the percentage increase in the number of boys as compared to its previous class is least?
किस कक्षा में लड़कों की संख्या में पिछले कक्षा की तुलना में प्रतिशत की वृद्धि सबसे कम है?
View SolutionStudy the given chart carefully and answer the question accordingly:
दिए गए चार्ट का ध्यानपूर्वक अध्ययन करें और उसके अनुसार प्रश्न का उत्तर दें: In which of the following years was the percentage increase in production from the previous year, the maximum among the given years?
पिछले वर्ष की तुलना में निम्नलिखित वर्षों में से किस वर्ष में उत्पादन में अधिकतम प्रतिशत वृद्धि हुई?
View SolutionThe given pie chart shows the percentage distribution of 450 employees in an organization. Study the pie chart and answer the questions that follow
दिए गए पाई चार्ट एक संगठन में 450 कर्मचारियों के प्रतिशत को दर्शाता है। पाई चार्ट का अध्ययन करें और आने वाले प्रश्नों का उत्तर दें।
What is the central angle of the sector representing the number of employees in department A?
विभाग A में कर्मचारियों की संख्या का प्रतिनिधित्व करने वाले क्षेत्र का केंद्रीय कोण क्या है?
View SolutionStudy the chart and answer the questions:
In which of the given years is the percentage increase in the number of hotels in comparison to the previous year, is the maximum?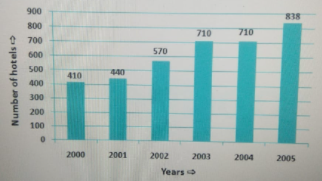
चार्ट का अध्ययन करें और प्रश्नों का उत्तर दें:पिछले वर्ष की तुलना में होटलों की संख्या में किस वर्ष में अधिकतम प्रतिशत वृद्धि हुई है?
View SolutionStudy the graph and answer the question that follows.
आरेख का अध्ययन करें एवं इसके बाद पूछे गए प्रश्नों के उत्तर दें |
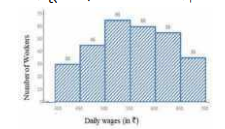 What is the ratio of the total number of workers whose daily wages are less than Rs 500 to the total number of workers whose daily wages are Rs600 and above?
500 रुपये से कम दैनिक मजदूरी वाले श्रमिकों की कुल संख्या और 600 रुपये तथा अधिक की दैनिक मजदूरी वाले श्रमिकों की कुल संख्या में अनुपात ज्ञात करें |
View Solution
