A study was made for the number of persons of different age groups visited in a library in a
week which is shown in the histogram. Study the histogram and answer the questions given below.
एक सप्ताह में एक पुस्तकालय में जाने वाले विभिन्न आयु समूहों के व्यक्तियों की संख्या के लिए एक अध्ययन किया गया था जो हिस्टोग्राम में दिखाया गया है। हिस्टोग्राम का अध्ययन करें और नीचे दिए गए प्रश्नों के उत्तर दें
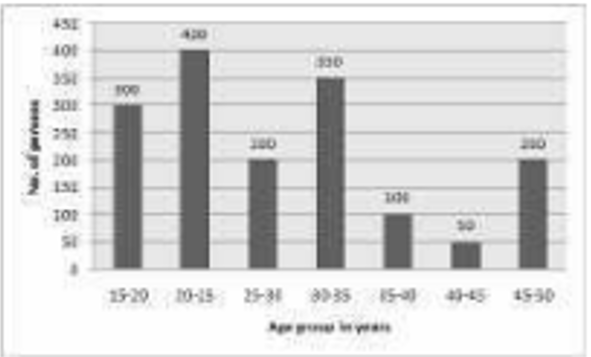 The ratio of the number of persons in the age groups 15-20 years and 20-25 years together, to
the number of persons in the age group 30-35 years and 35-40 years together, is:
14:9
14:17
13:9
15:19
Step by step video & image solution for A study was made for the number of persons of different age groups visited in a library in a week which is shown in the histogram. Study the histogram and answer the questions given below. एक सप्ताह में एक पुस्तकालय में जाने वाले विभिन्न आयु समूहों के व्यक्तियों की संख्या के लिए एक अध्ययन किया गया था जो हिस्टोग्राम में दिखाया गया है। हिस्टोग्राम का अध्ययन करें और नीचे दिए गए प्रश्नों के उत्तर दें The ratio of the number of persons in the age groups 15-20 years and 20-25 years together, to the number of persons in the age group 30-35 years and 35-40 years together, is: by Maths experts to help you in doubts & scoring excellent marks in Class 14 exams.
Updated on:21/07/2023Topper's Solved these Questions
Similar Questions
A study was made for the number of persons of different age groups visited in a library in a week which is shown in the histogram. Study the histogram and answer the questions given below. What percentage of the total number of persons visiting the library in the week was the number of persons of age group 25-30 years?
एक सप्ताह में एक पुस्तकालय में जाने वाले विभिन्न आयु समूहों के व्यक्तियों की संख्या के लिए एक अध्ययन किया गया था जो हिस्टोग्राम में दिखाया गया है। हिस्टोग्राम का अध्ययन करें और नीचे दिए गए प्रश्नों के उत्तर दें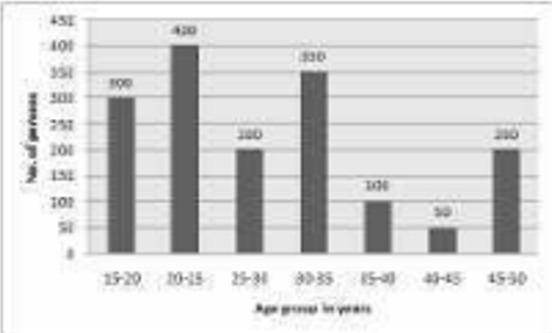
सप्ताह में पुस्तकालय जाने वाले व्यक्तियों की कुल संख्या का कितना प्रतिशत 25-30 वर्ष आयु वर्ग के व्यक्तियों की संख्या थी
View SolutionA study was made for the number of persons of different age group visited in a library in a week which is shown in the histogram. Study the histogram and answer the question given below.
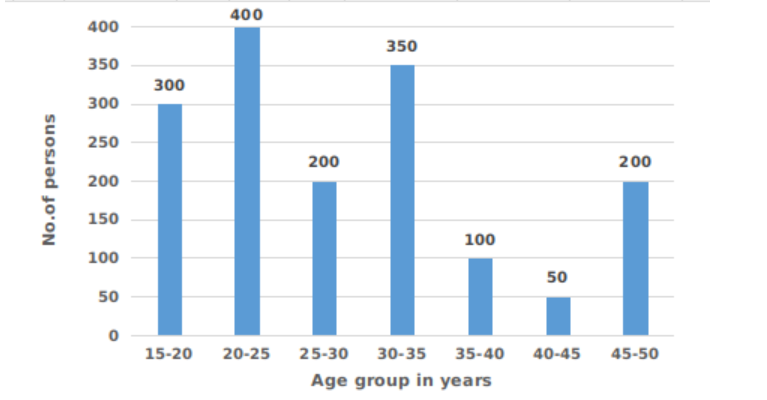
The ratio of the number of persons in the age groups 15-20 years and 20-25 years together, to the number of persons in the age groups 30-35 years and 35-40 years together, is:
View Solution
Knowledge Check
बेन्जीन के एक अणु में sp2 संकरित कक्षकों की संख्या है
A18B6C12D24नीचे लिखे वाक्य के लिए एक शब्द बताइये जो युद्ध में स्थिर रहता है-
Aयशस्वीBसत्याग्रहीCयुधिष्ठिरDअश्वारोहपत्रकारिता के विभिन्न आयामों में से एक है
AटेलीफोनBदूरदर्शनCसंपादकीयDफिल्म
Study the following histogram and answer the given question.
A study was made for the number of persons of different age group visited in a library in a week which is shown in given in the histogram. Study the histogram and answer the question given below.
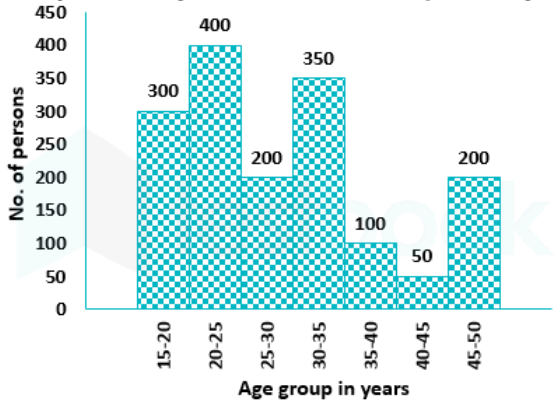
What percent of the total number of persons visiting library in the week was the number of persons of age group 25-30 years?
View SolutionThe pie-chart provided below gives the distribution of land (in a village) under various food crops. Study the pie-chart carefully and answer the questions.
नीचे दिए गए वृत्तारेखा में विभिन खाद्य फसलों के ( एक गाँव में ) भूमि का वितरण दिखाया गया हैं। वृत्तारेखा का अध्ययन कीजिए और प्रश्नों के उत्तर दीजिए।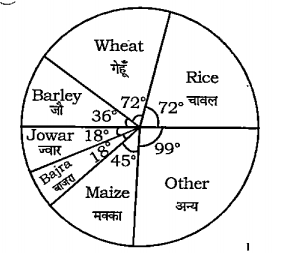 The ratio of the land used for rice and barley is
चावल और जौ के उत्पादन के लिए प्रयुक्त भूमि का अनुपात है-
View SolutionThe sub divided bar diagram given below depicts the result of class XII students of a school for three years. Study the diagram and answer the questions given below.
निम्नलिखित दण्ड आरेख तीन वर्षों के लिए एक स्कूल के कक्षा XII के छात्रों का परीक्षा परिणाम दिखाता है। दण्ड आरेख का अध्ययन कीजिए और निम्नलिखित प्रश्नों का उत्तर दीजिए :
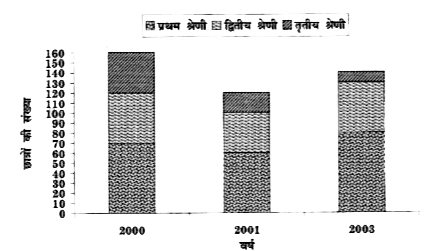
The number of students passed with Third class in the year 2002 is.
वर्ष 2002 में तृतीय श्रेणी में उत्तीर्ण छात्रों की संख्या है
View Solutionपत्रकारिता के विभिन्न आयामों में से एक है
View Solutionहिन्दी में एक ध्वनि के लिए
View Solution
