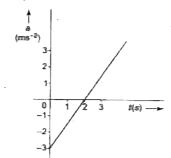
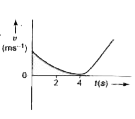
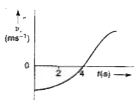
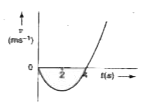
Figure shows the acceleration time (a-t) graph of a body moving in a straight line. Which graph in fig show the velocity time (v-t) of the motion of the body? Assume that x=0 and v=0 at t=0
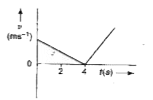
The correct Answer is:C
Slope of a a-t graph is =−3−2=32ms−2 per s. Intercept c=−3ms−2. Therefore the equation of the line is
a=32t−3
⇒dvdt=32t−3
⇒dv=(32t−3)dt
Integrating ∫v0dv=∫10(32t−3)dt
⇒v=3t24−3t=3t4(t−4)
Thus v=0 at t=4s and v-t graph is a parabola.
Similar Questions
The figure below shows the velocity-time graph of a body moving in a straight line.
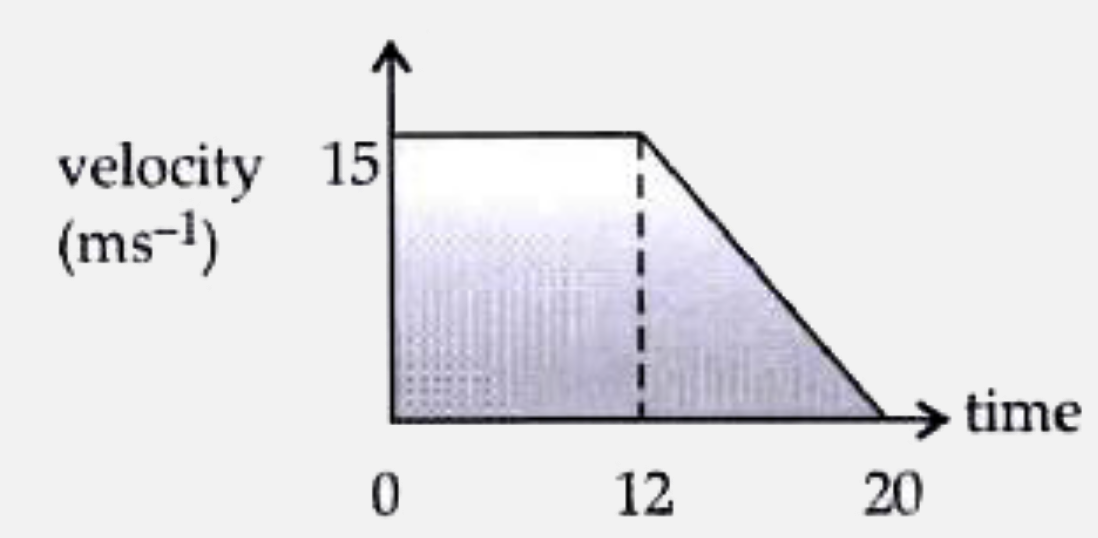
Find the total displacement of the body.
View SolutionThe acceleration-time graph of a patticle moving in a straight line is as shown below. Sketch the v-t graph. The initial velocity of the particle is zero.
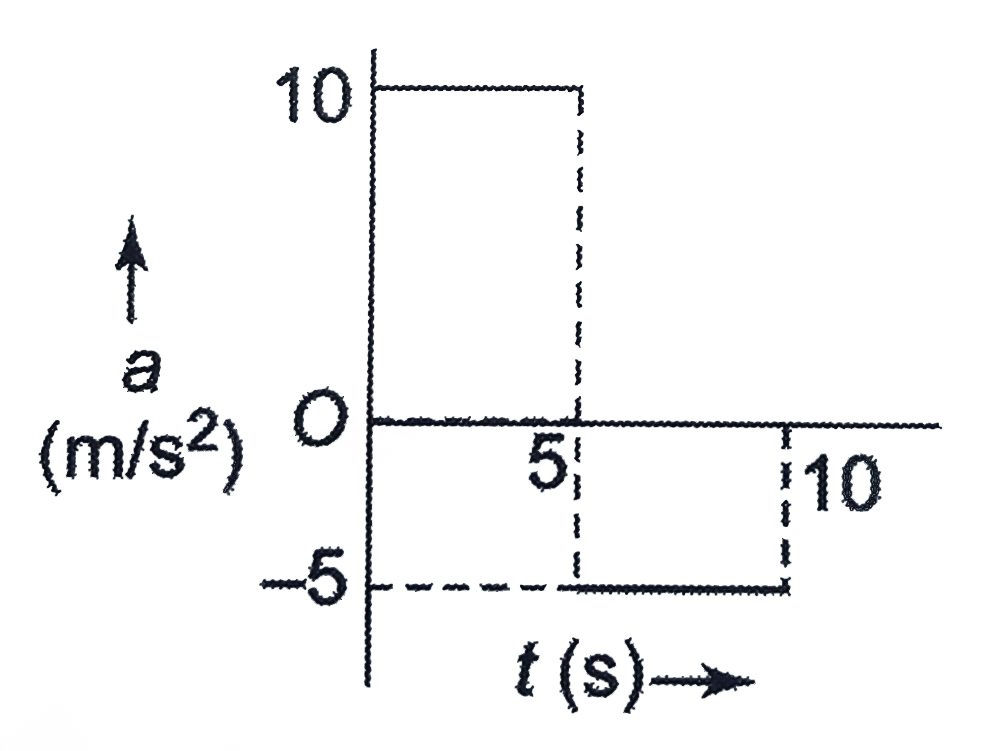
View Solution
Knowledge Check

Figure shows the displacement tiime (x-t) graph of a body moving in a straight line which one of the graph shown in figure represents the velocity- time (v-t) graph of the motion of the body.A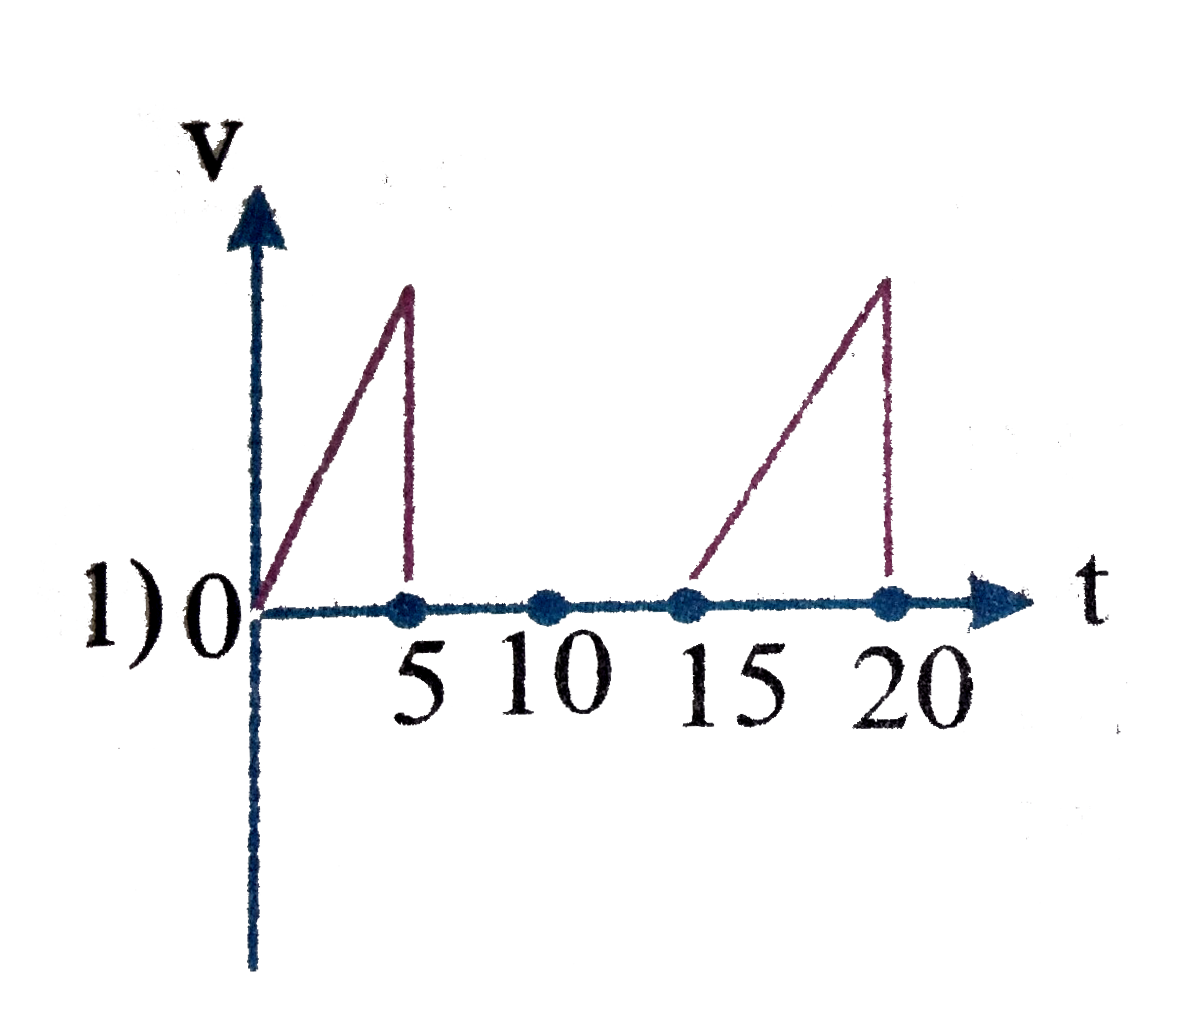 B
B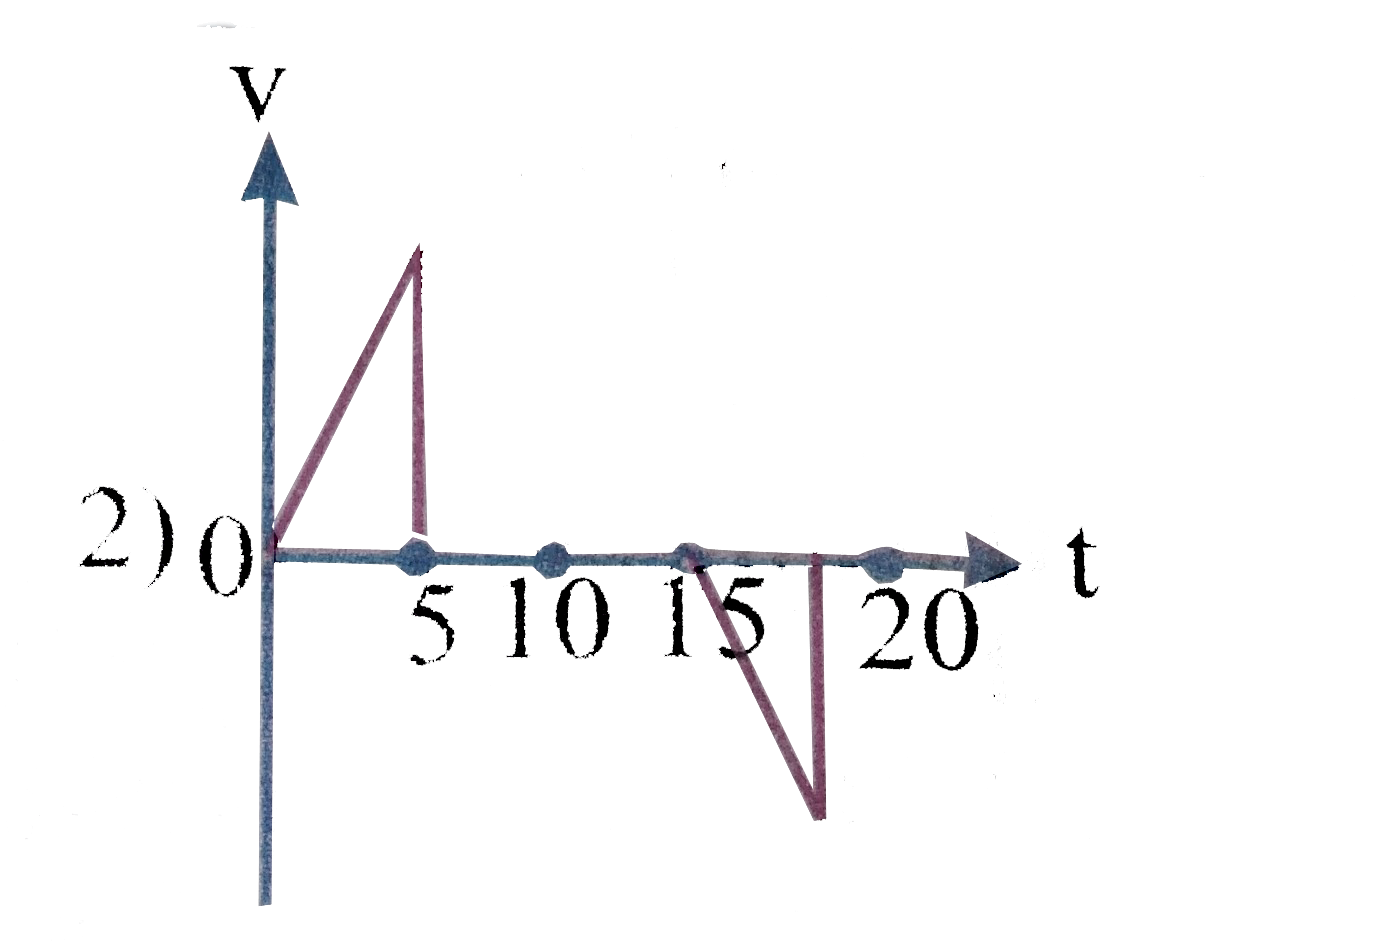 C
C D
D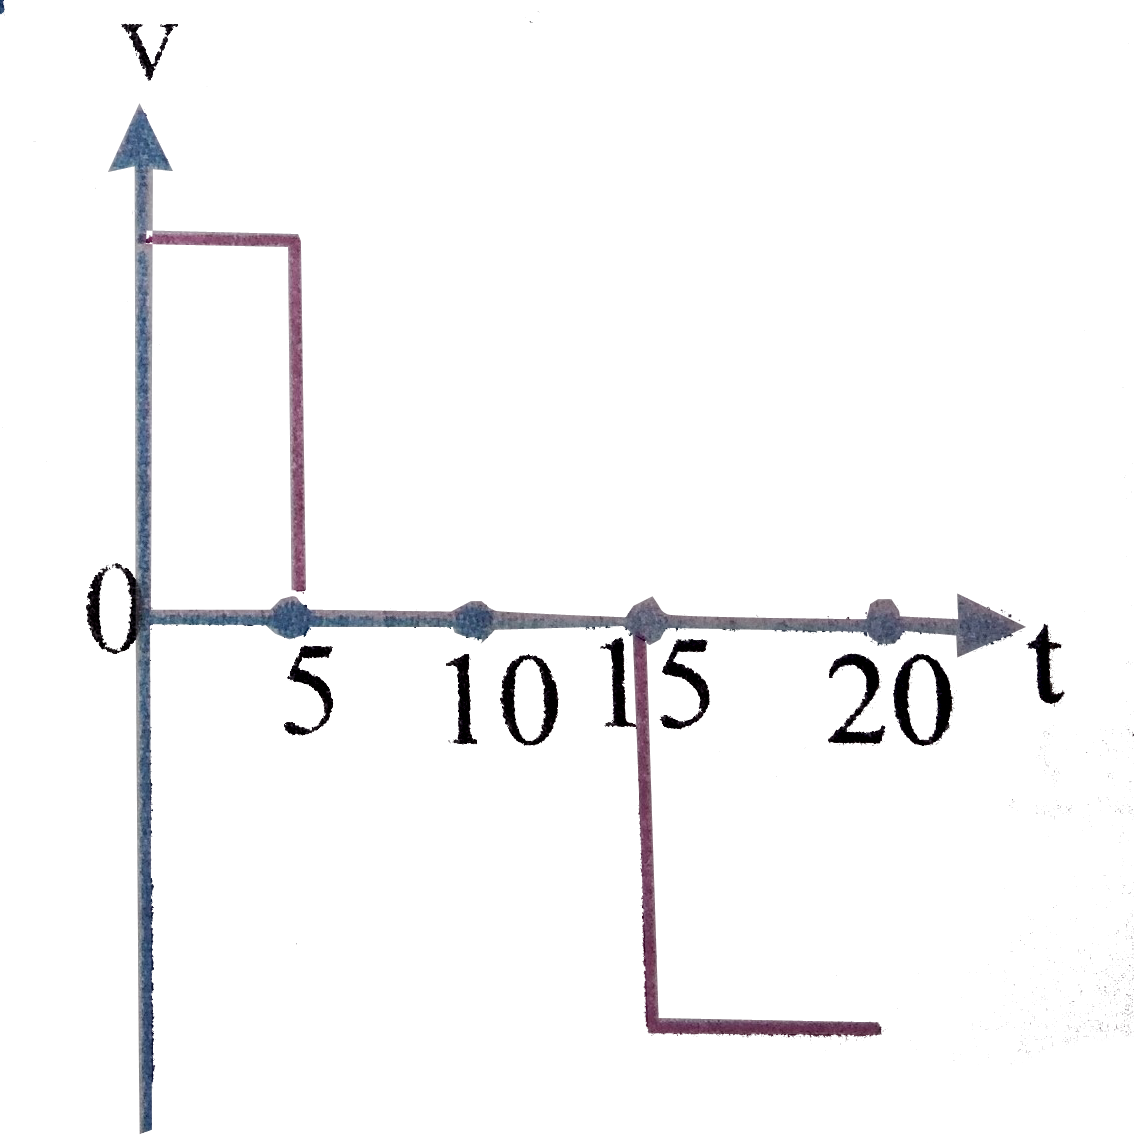
The velocity time graph of a body moving along a straight line is shown in figure. The ratio of the average velocities during the time t1 and t2 is.
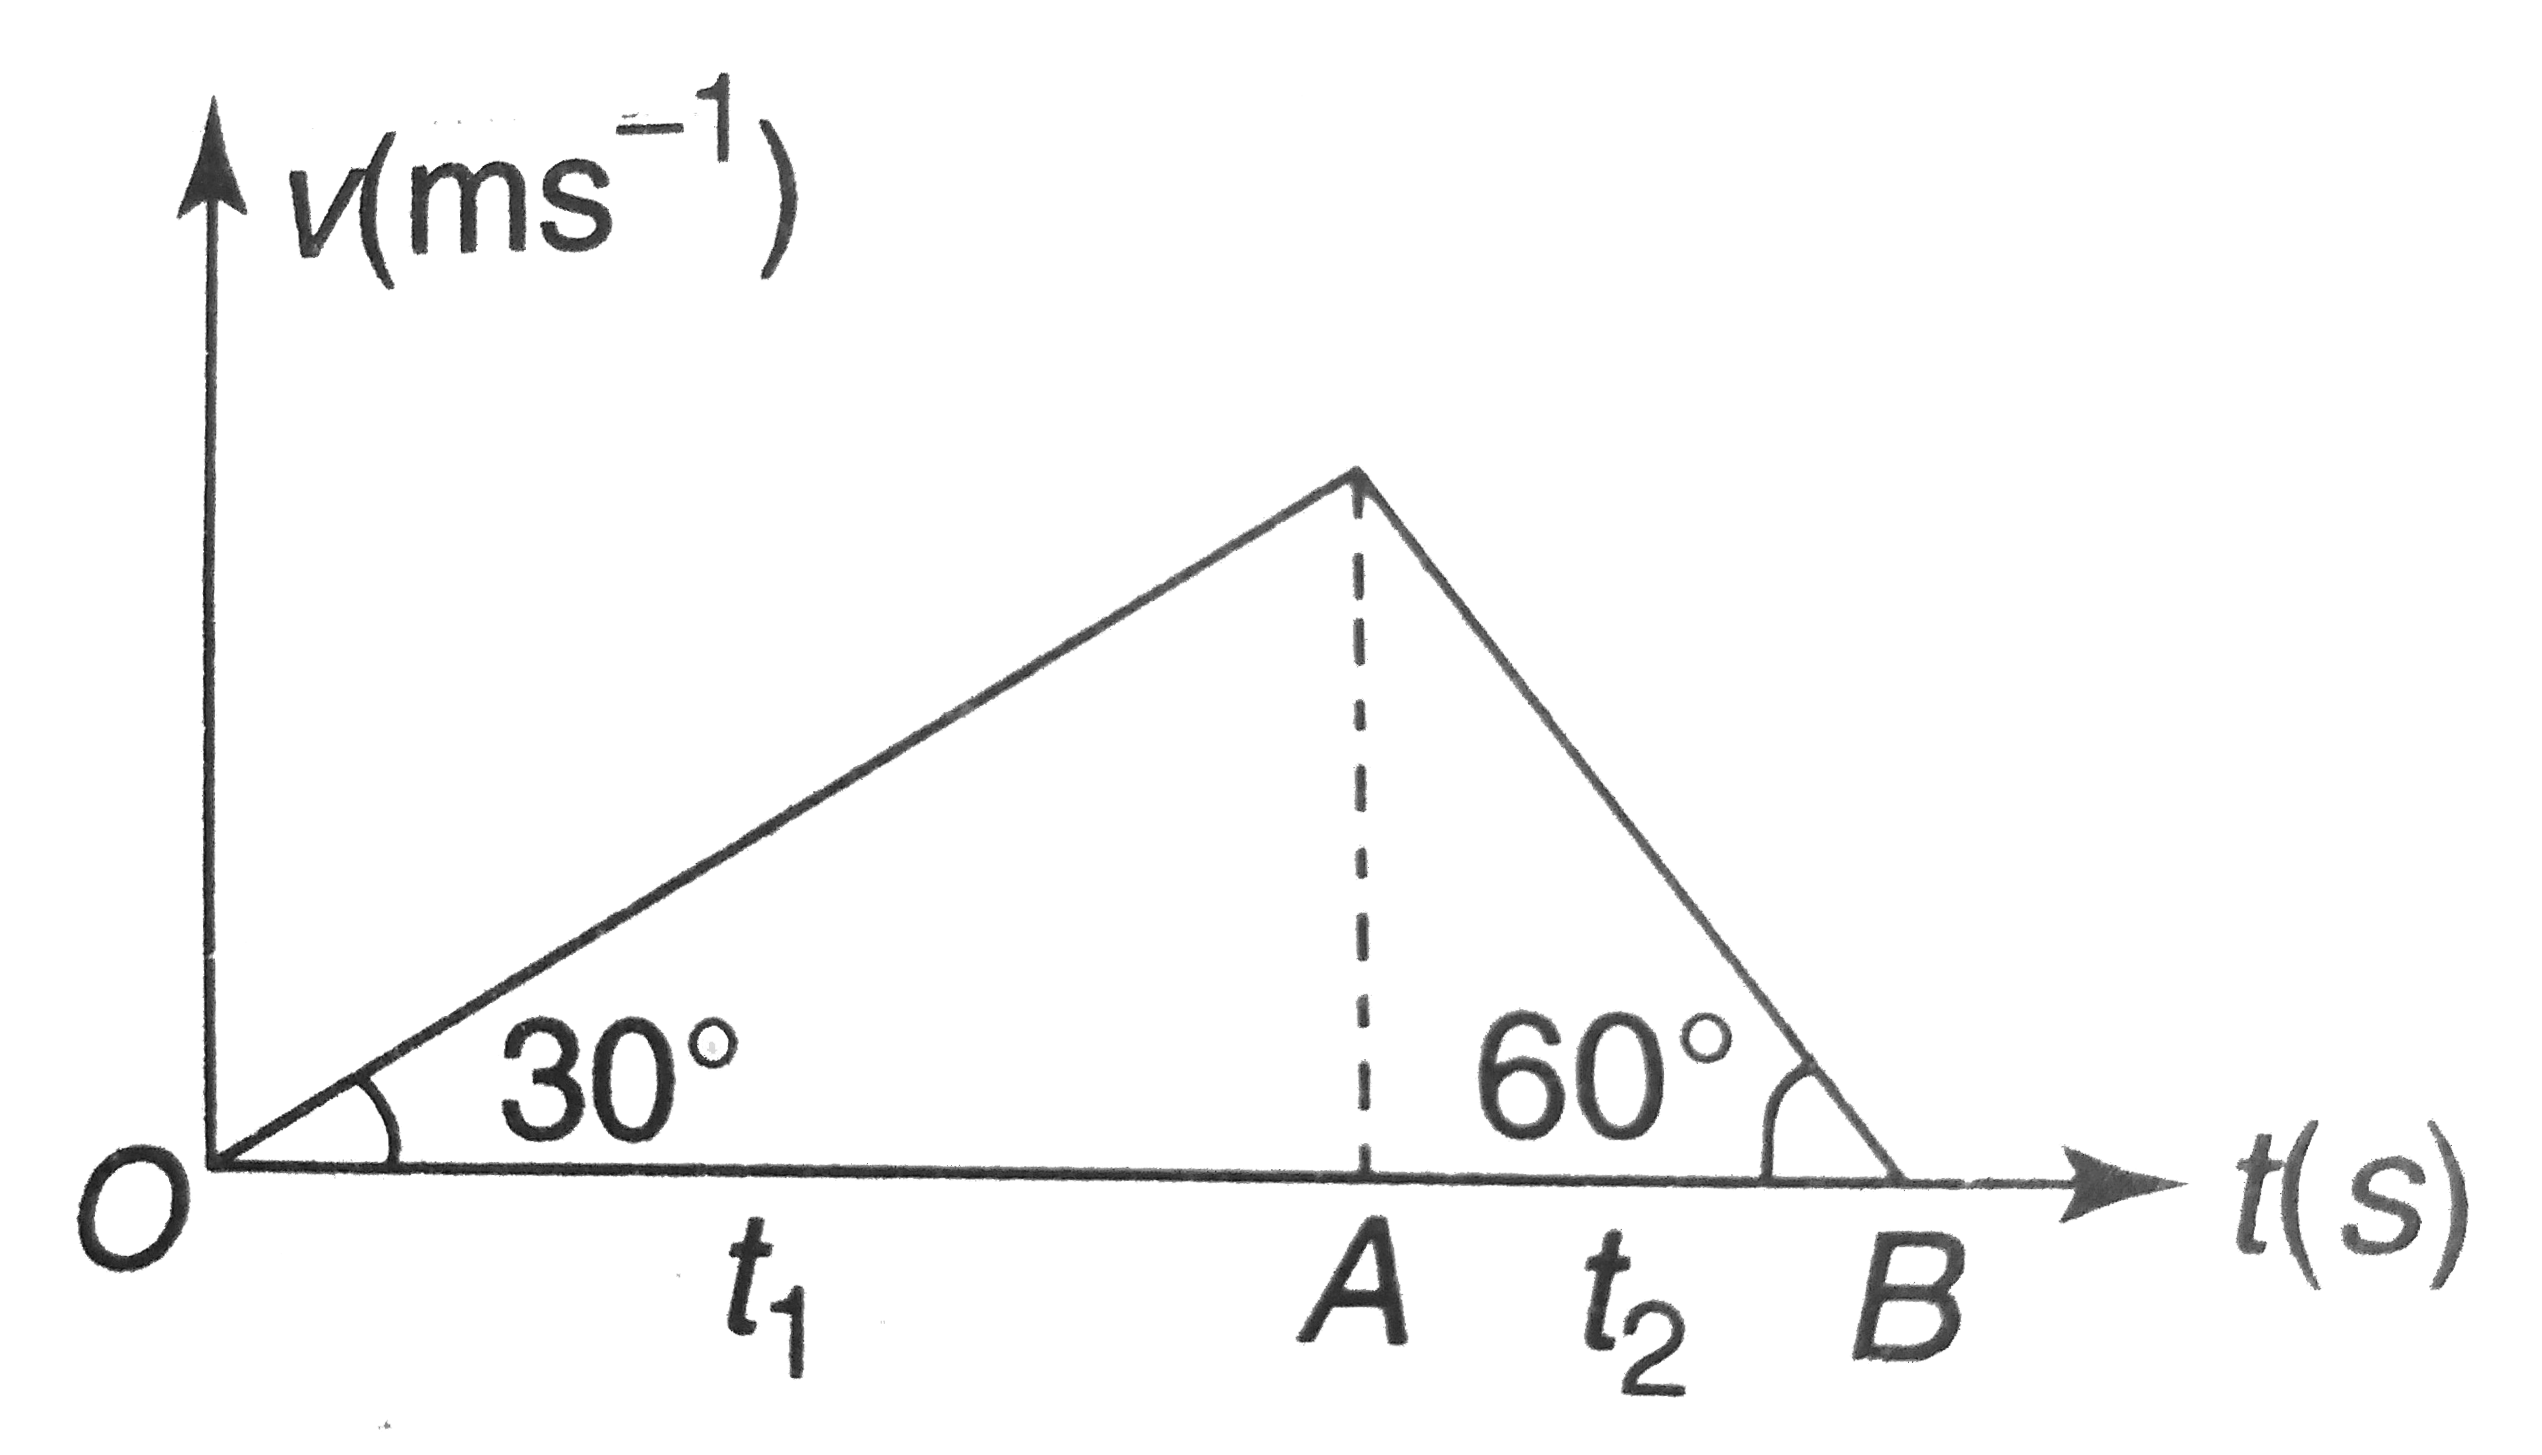 A1:1B2:1C3:1D1:3
The velocity -time (v−t) graph of a particle moving in a straight line is shown in figure. The acceleration of the particle at t=9 is:
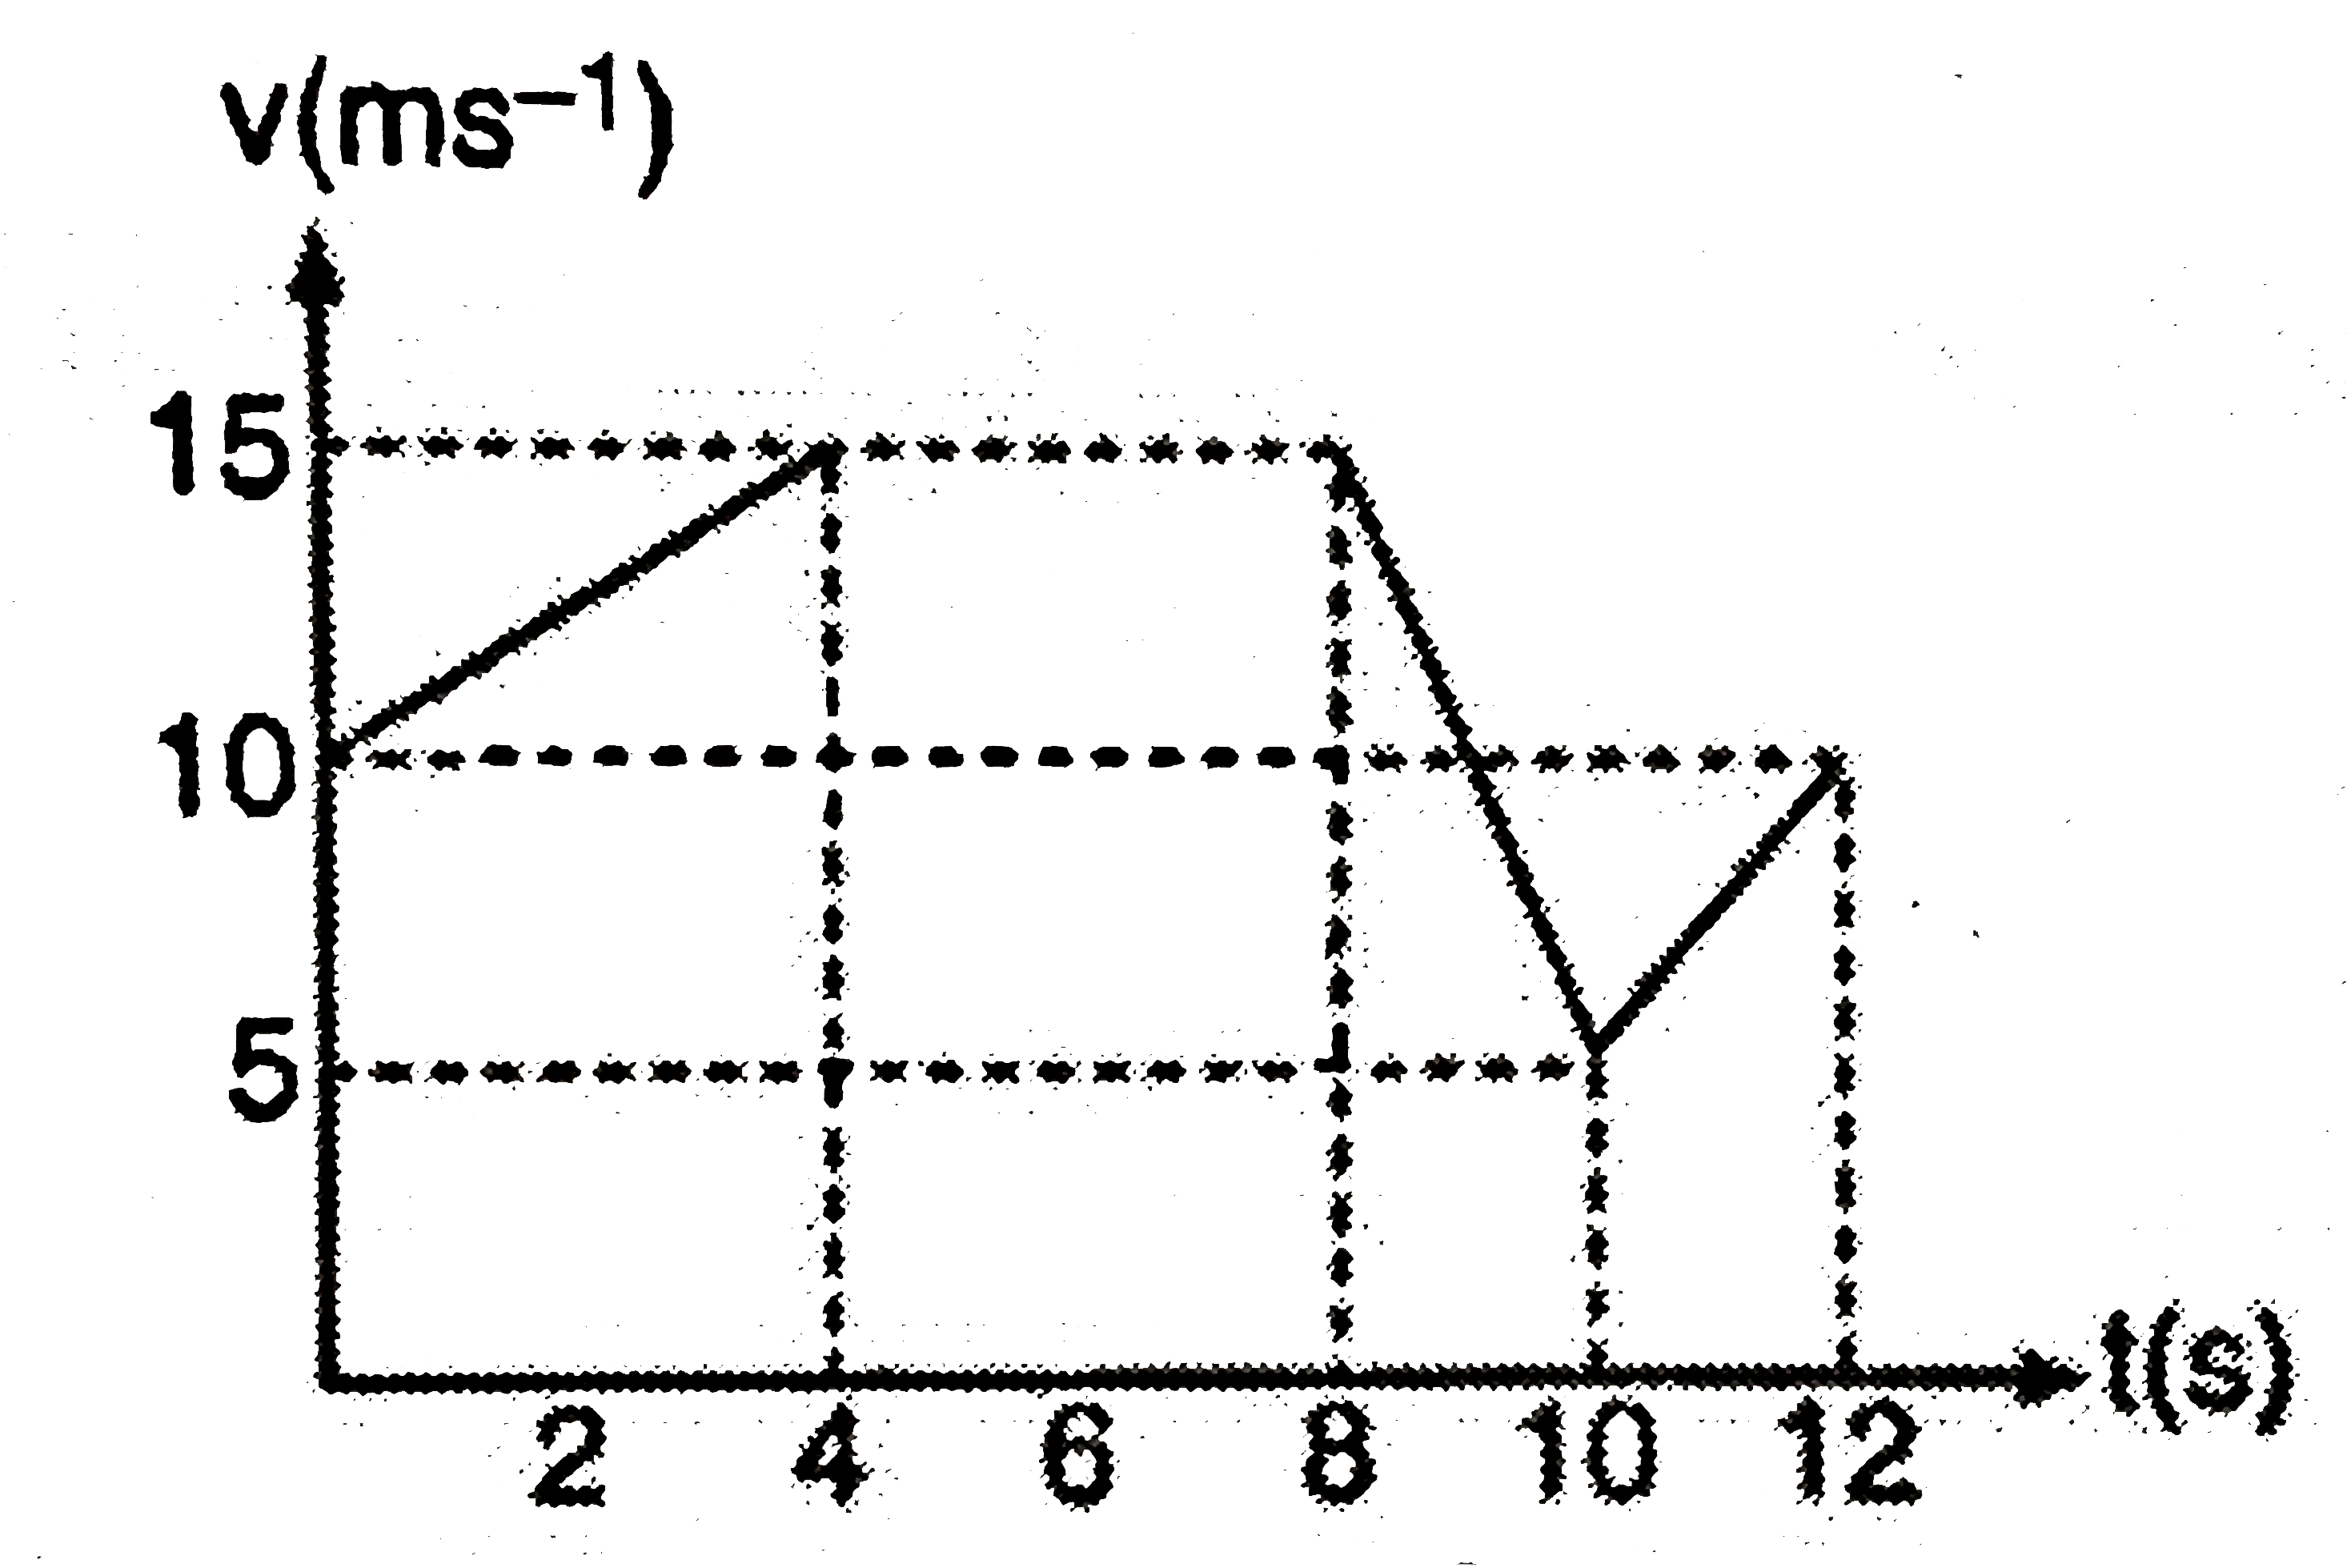 AzeroB5ms−2C−5ms2D−2ms−2
The figure below shows the velocity-time graph of a body moving in a straight line.

Find the time interval in which the body is moving with zero acceleration
View SolutionThe acceleration versus time graph of a particle moving along a straight line is shown in the figure. Draw the respective velocity-time graph Given v=0 at t=0.
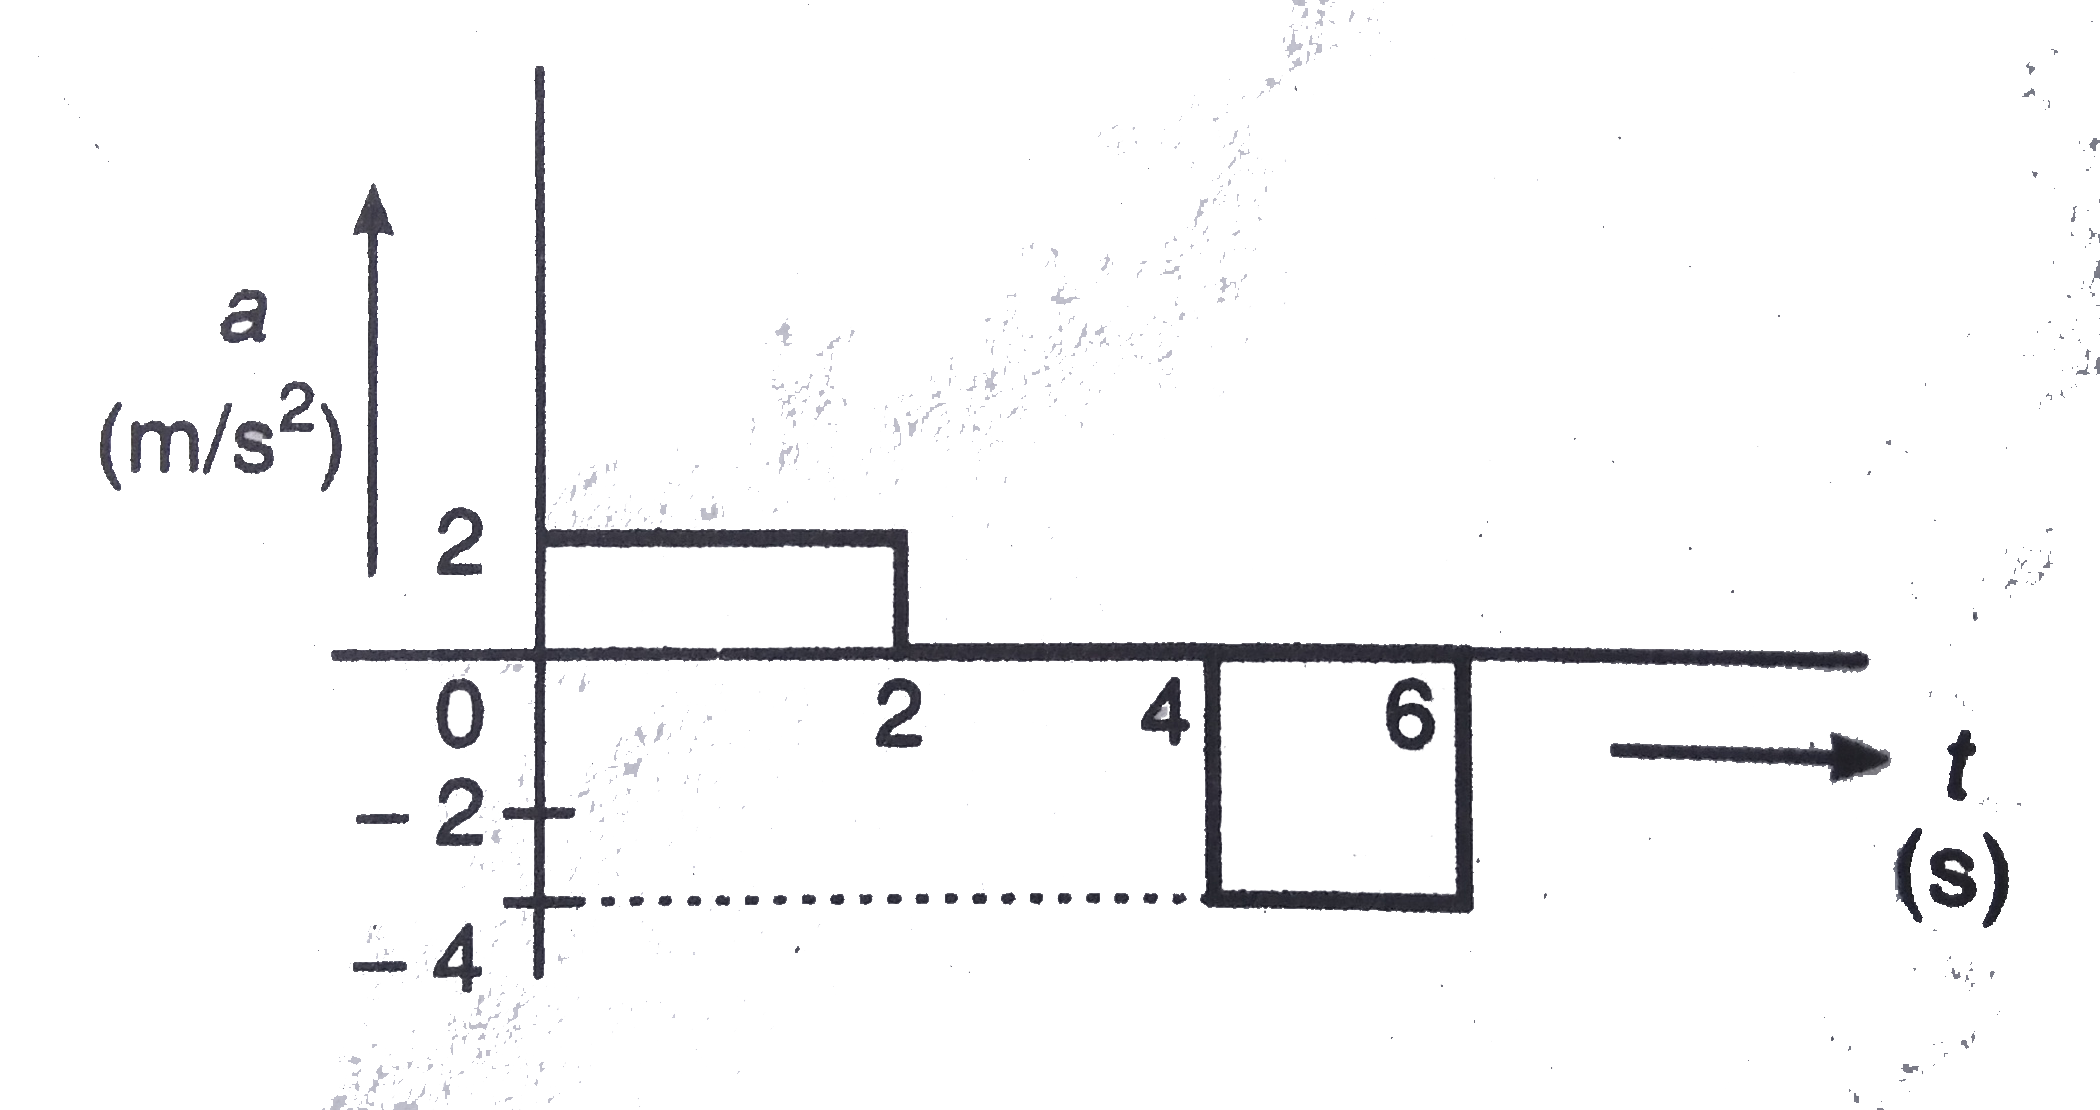
View SolutionThe acceleration versus time graph of a particle moving along a straight line is shown in the figure. Draw the respective velocity-time graph Given v=0 at t=0.

View SolutionFigure shows the velocity time graph of a particle moving along straight line (v is m/s and t is in second). It average velocity in 20 seconds will be:
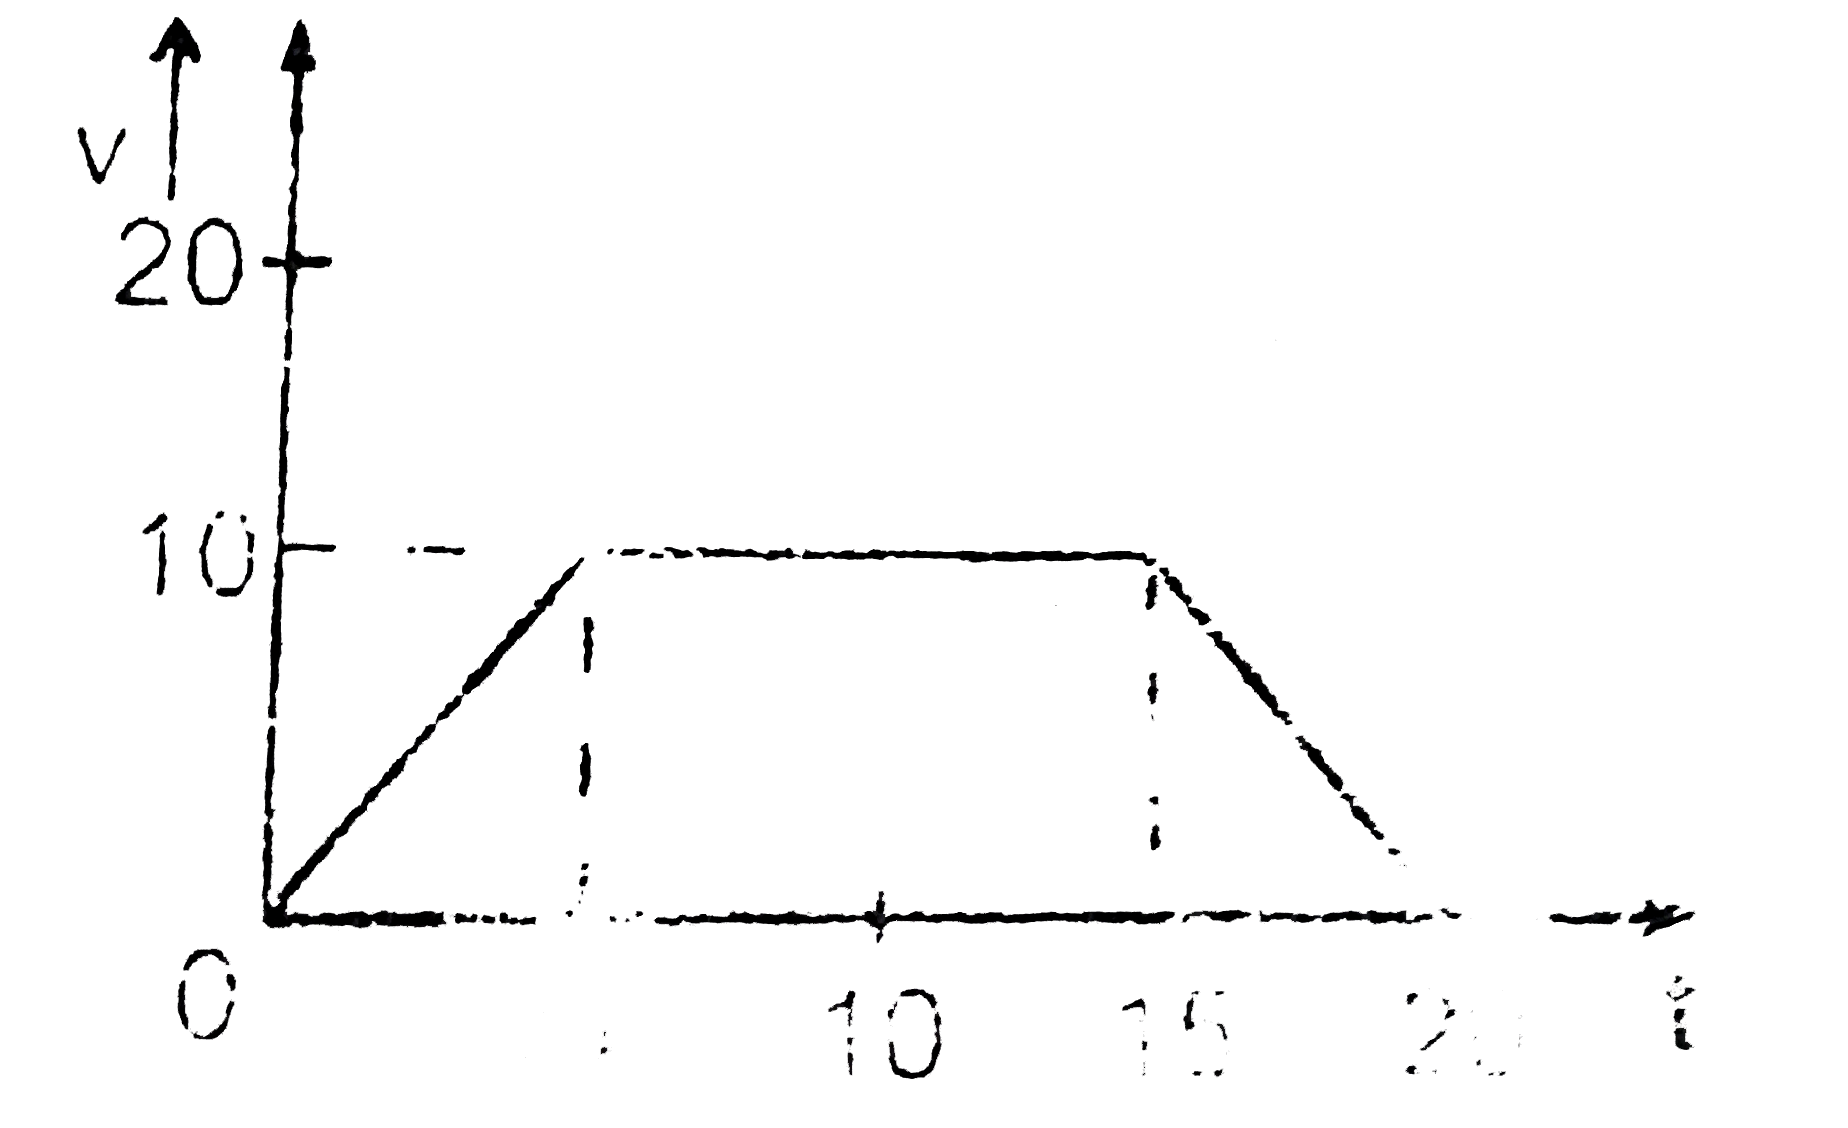 .
.
View SolutionFigure shows the velocity time graph of a particle moving along straight line (v is m/s and t is in second). It average velocity in 20 seconds will be:
 .
.
View Solution
