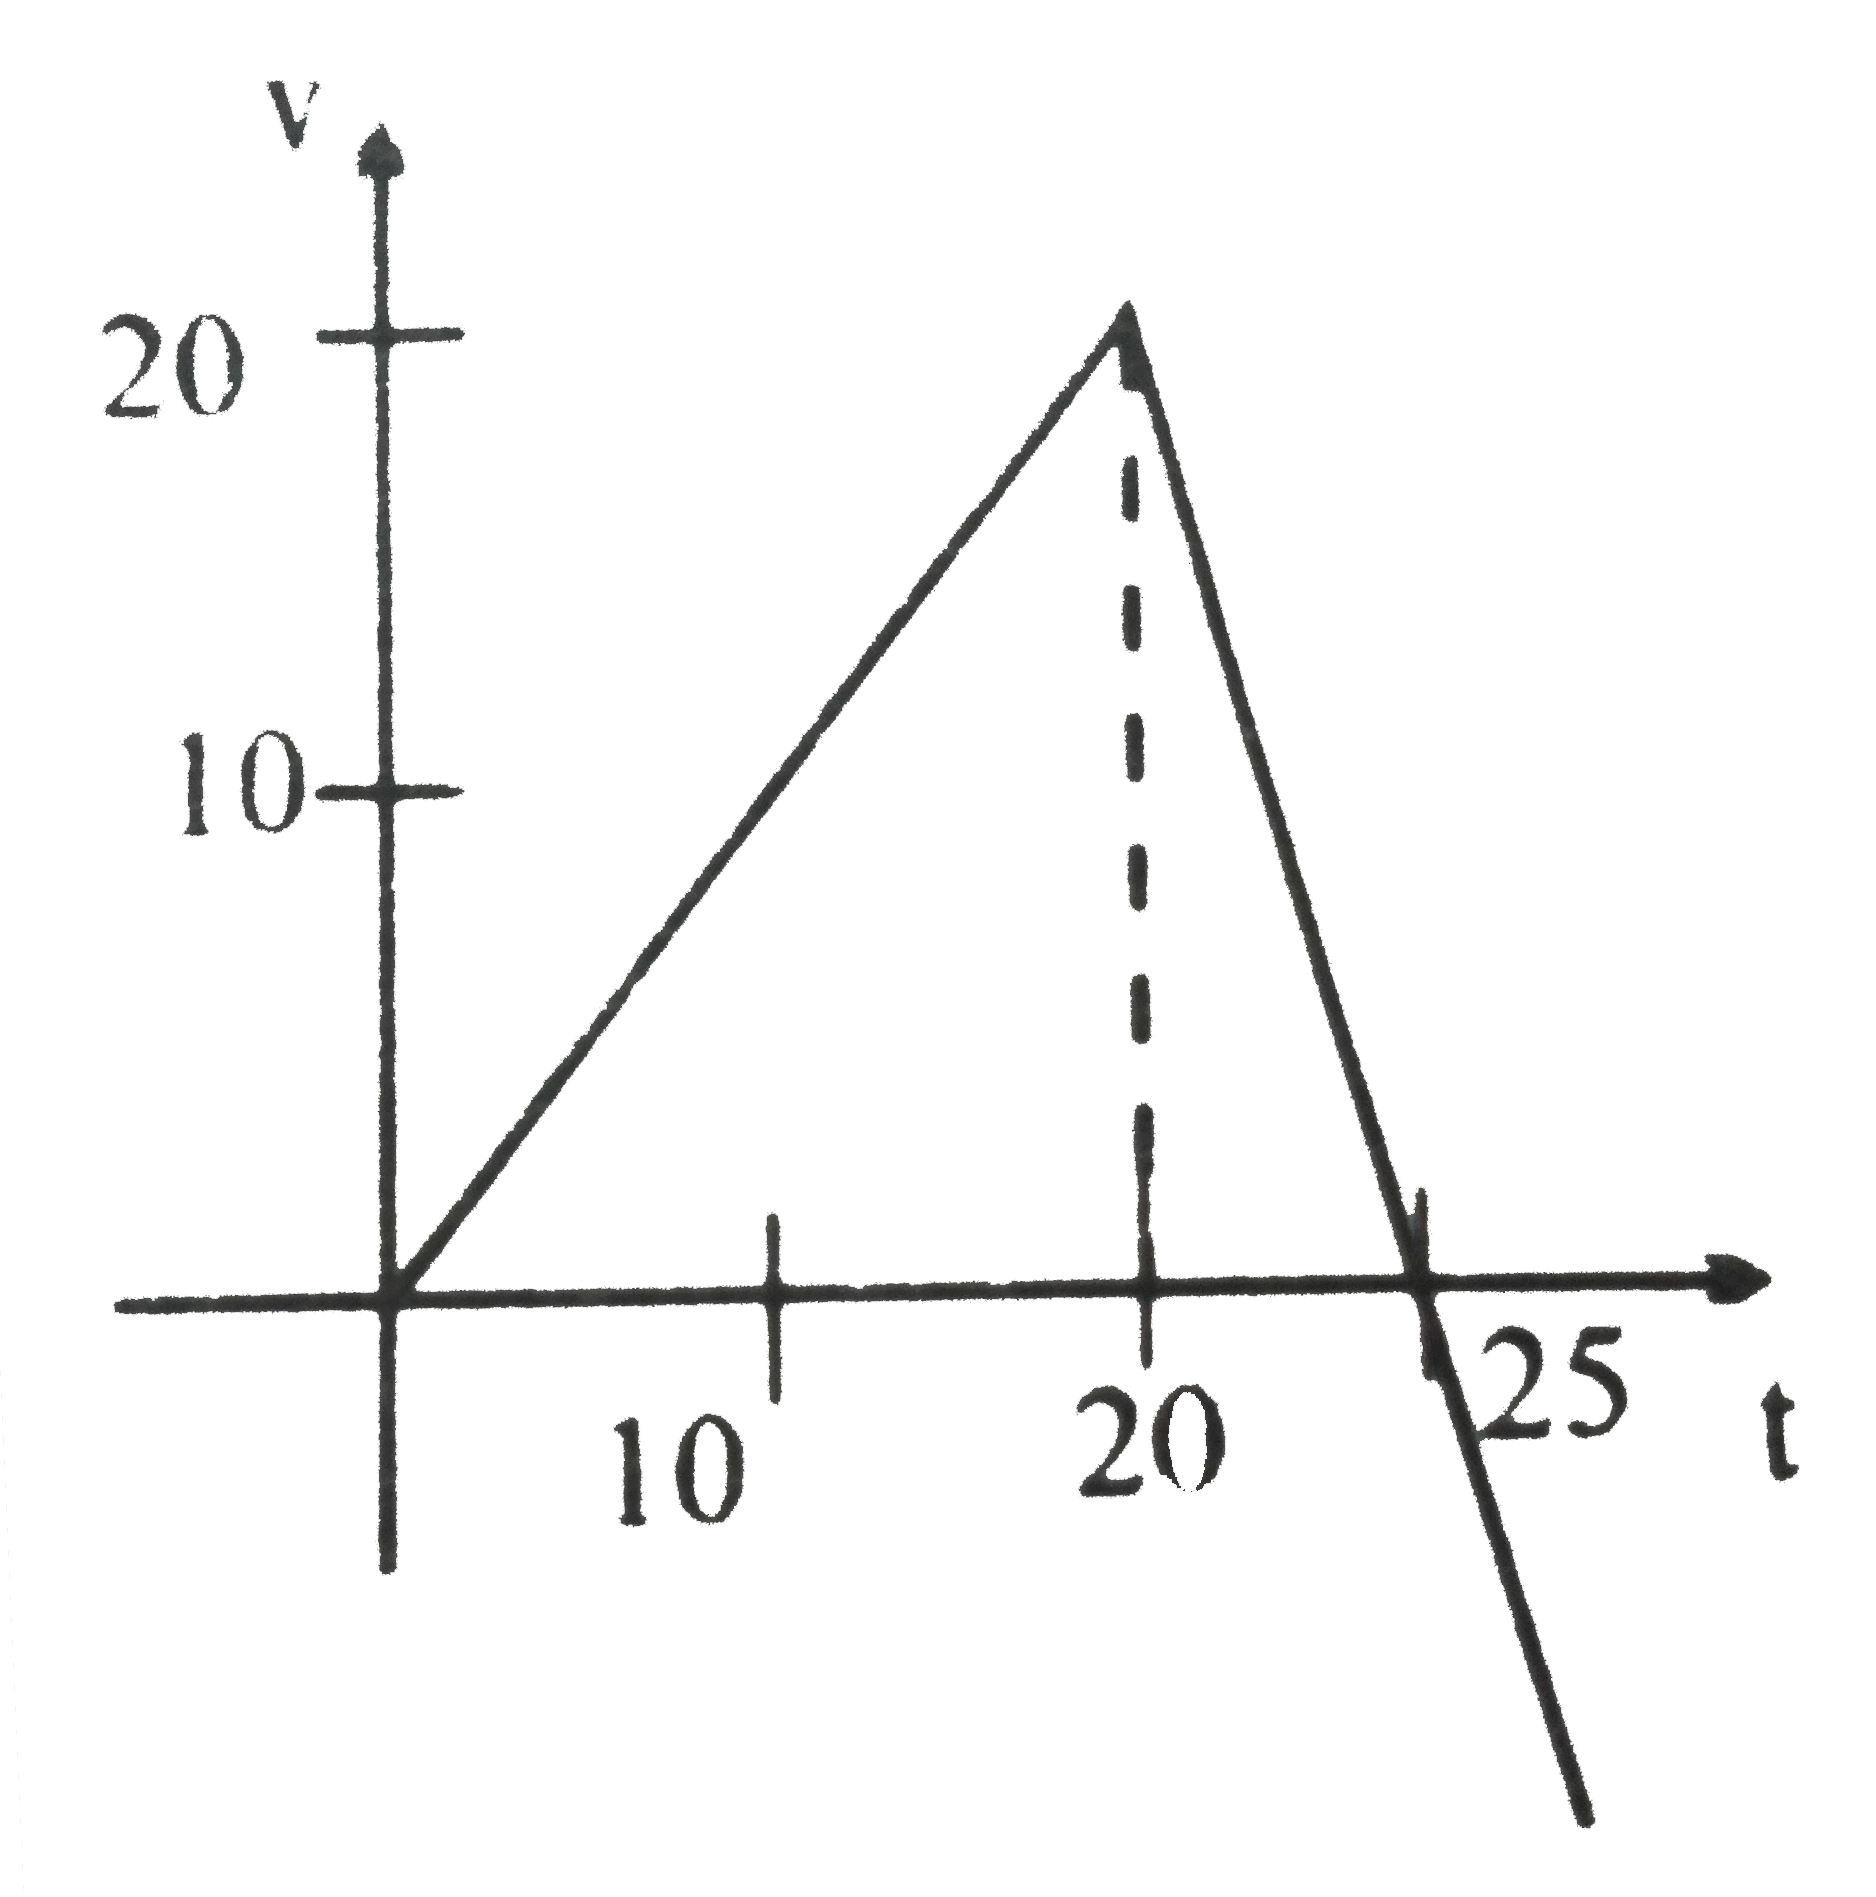
The fig. shows the v−t graph of a particle moving in straight line. Find the time when particle returns to the starting point.
The correct Answer is:36.2sec.
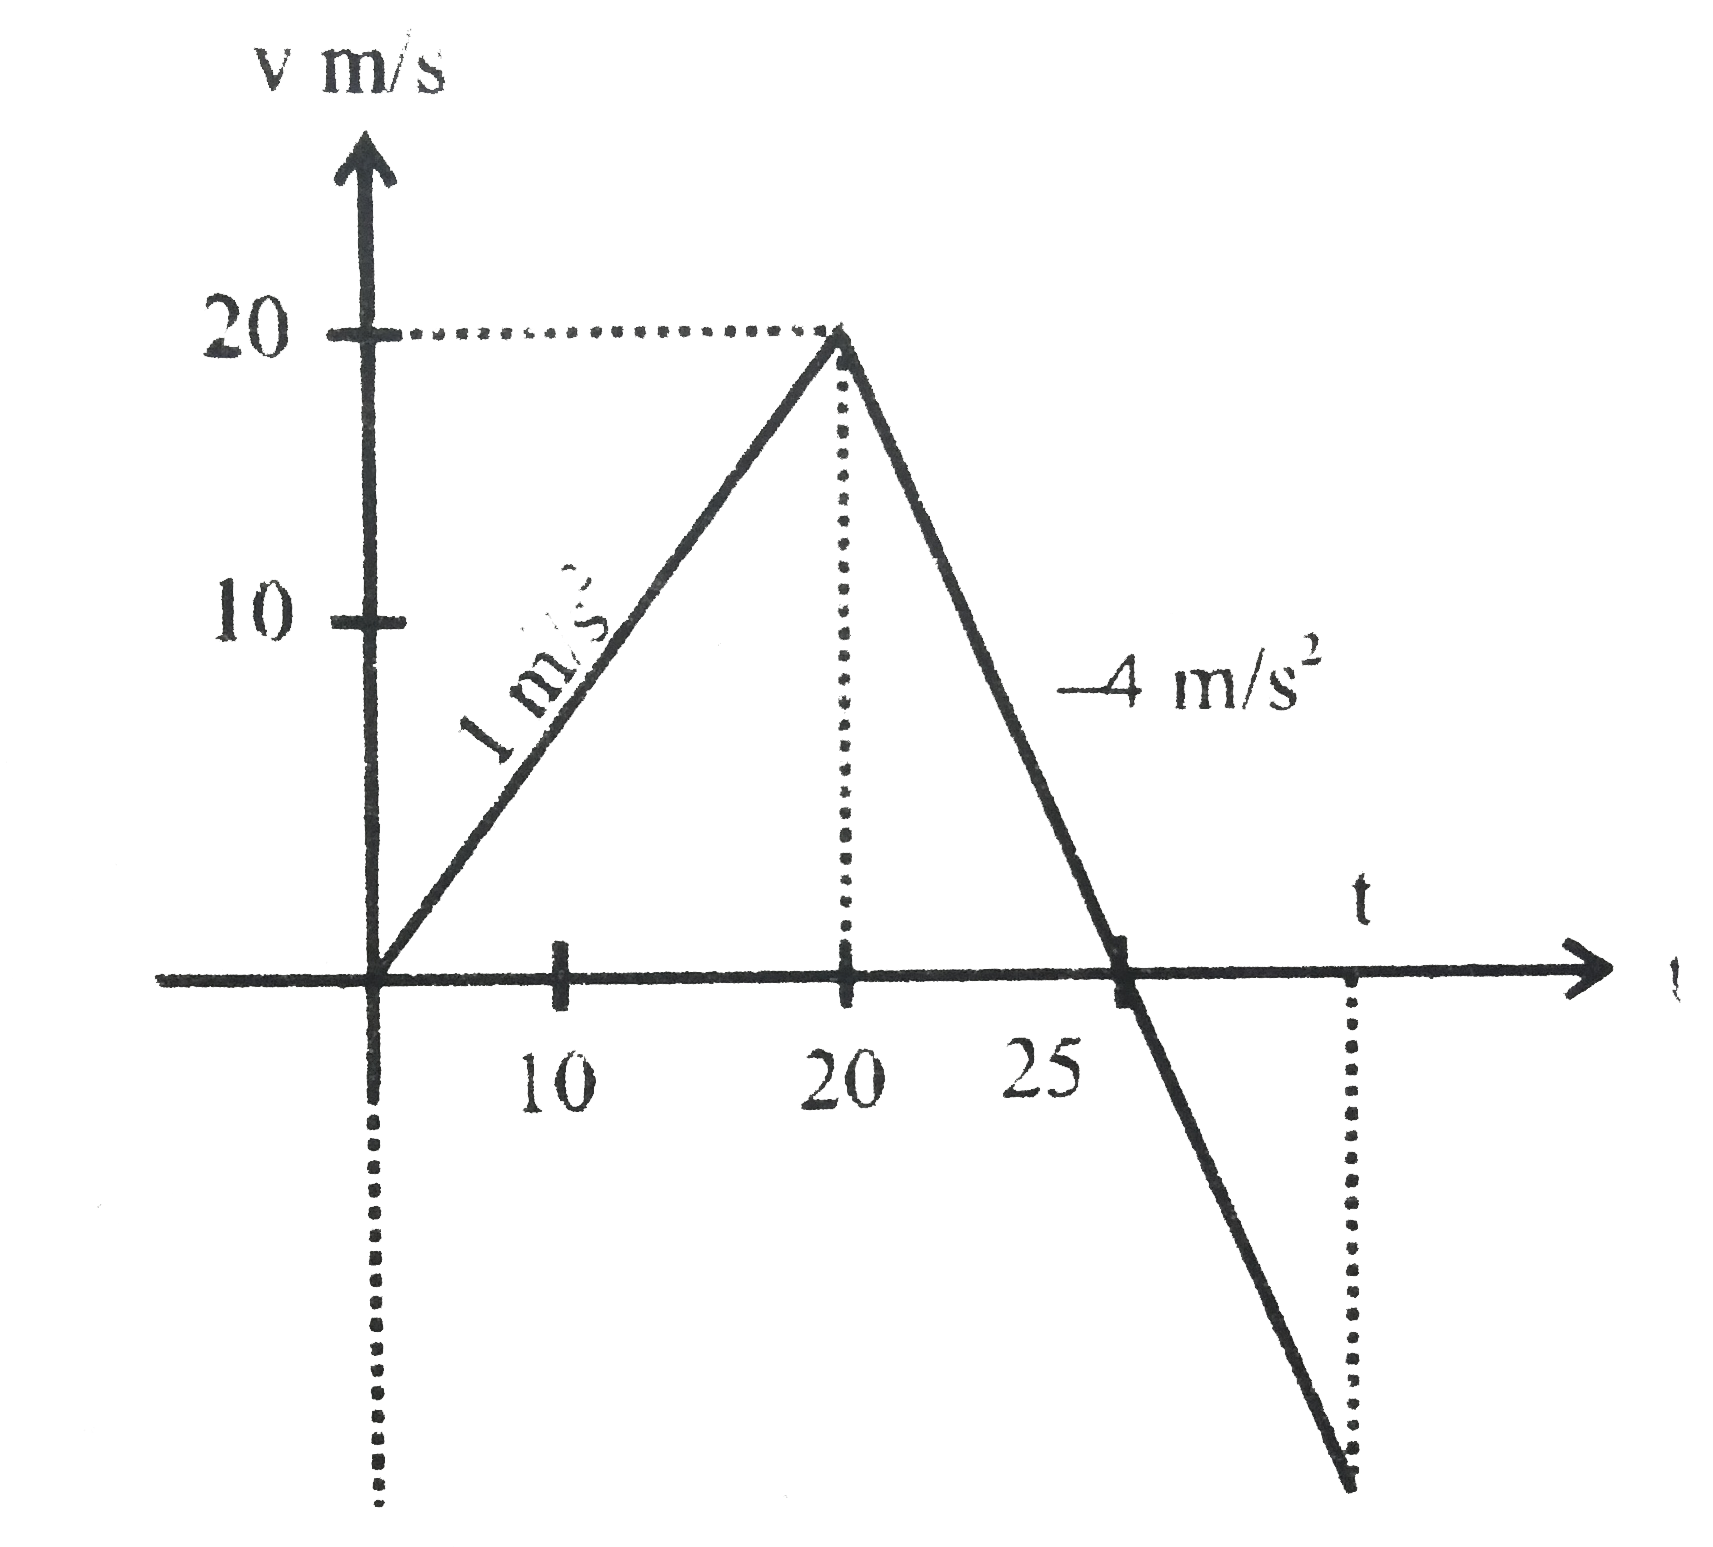
For particle to return to origin. Net displacement is zero.
0=12×25×25+12×(−4)×(t−25)2
2(t−25)2=125
t−25=±11.2
t=36.2sec.
Similar Questions
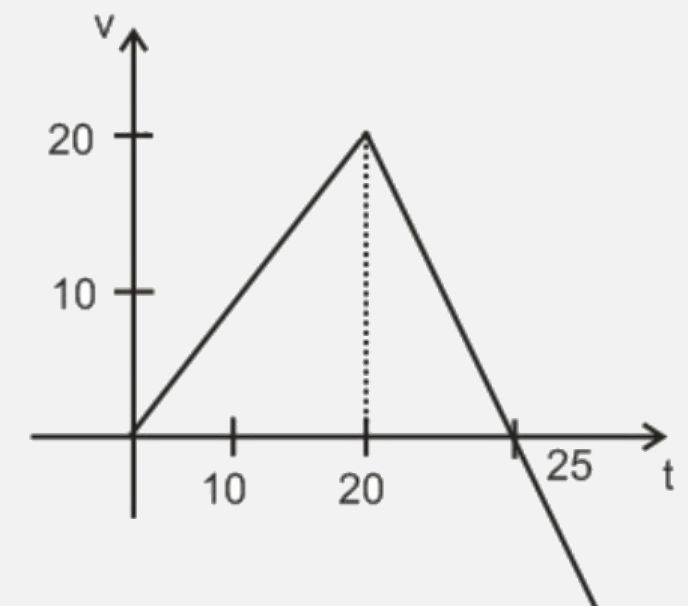
The figure shows the v−t graph of a particle moving in a straight line. Starting from rest, the time after which the particle returns to its starting position is
View SolutionThe figure shows a velocity-time graph of a particle moving along a straight line
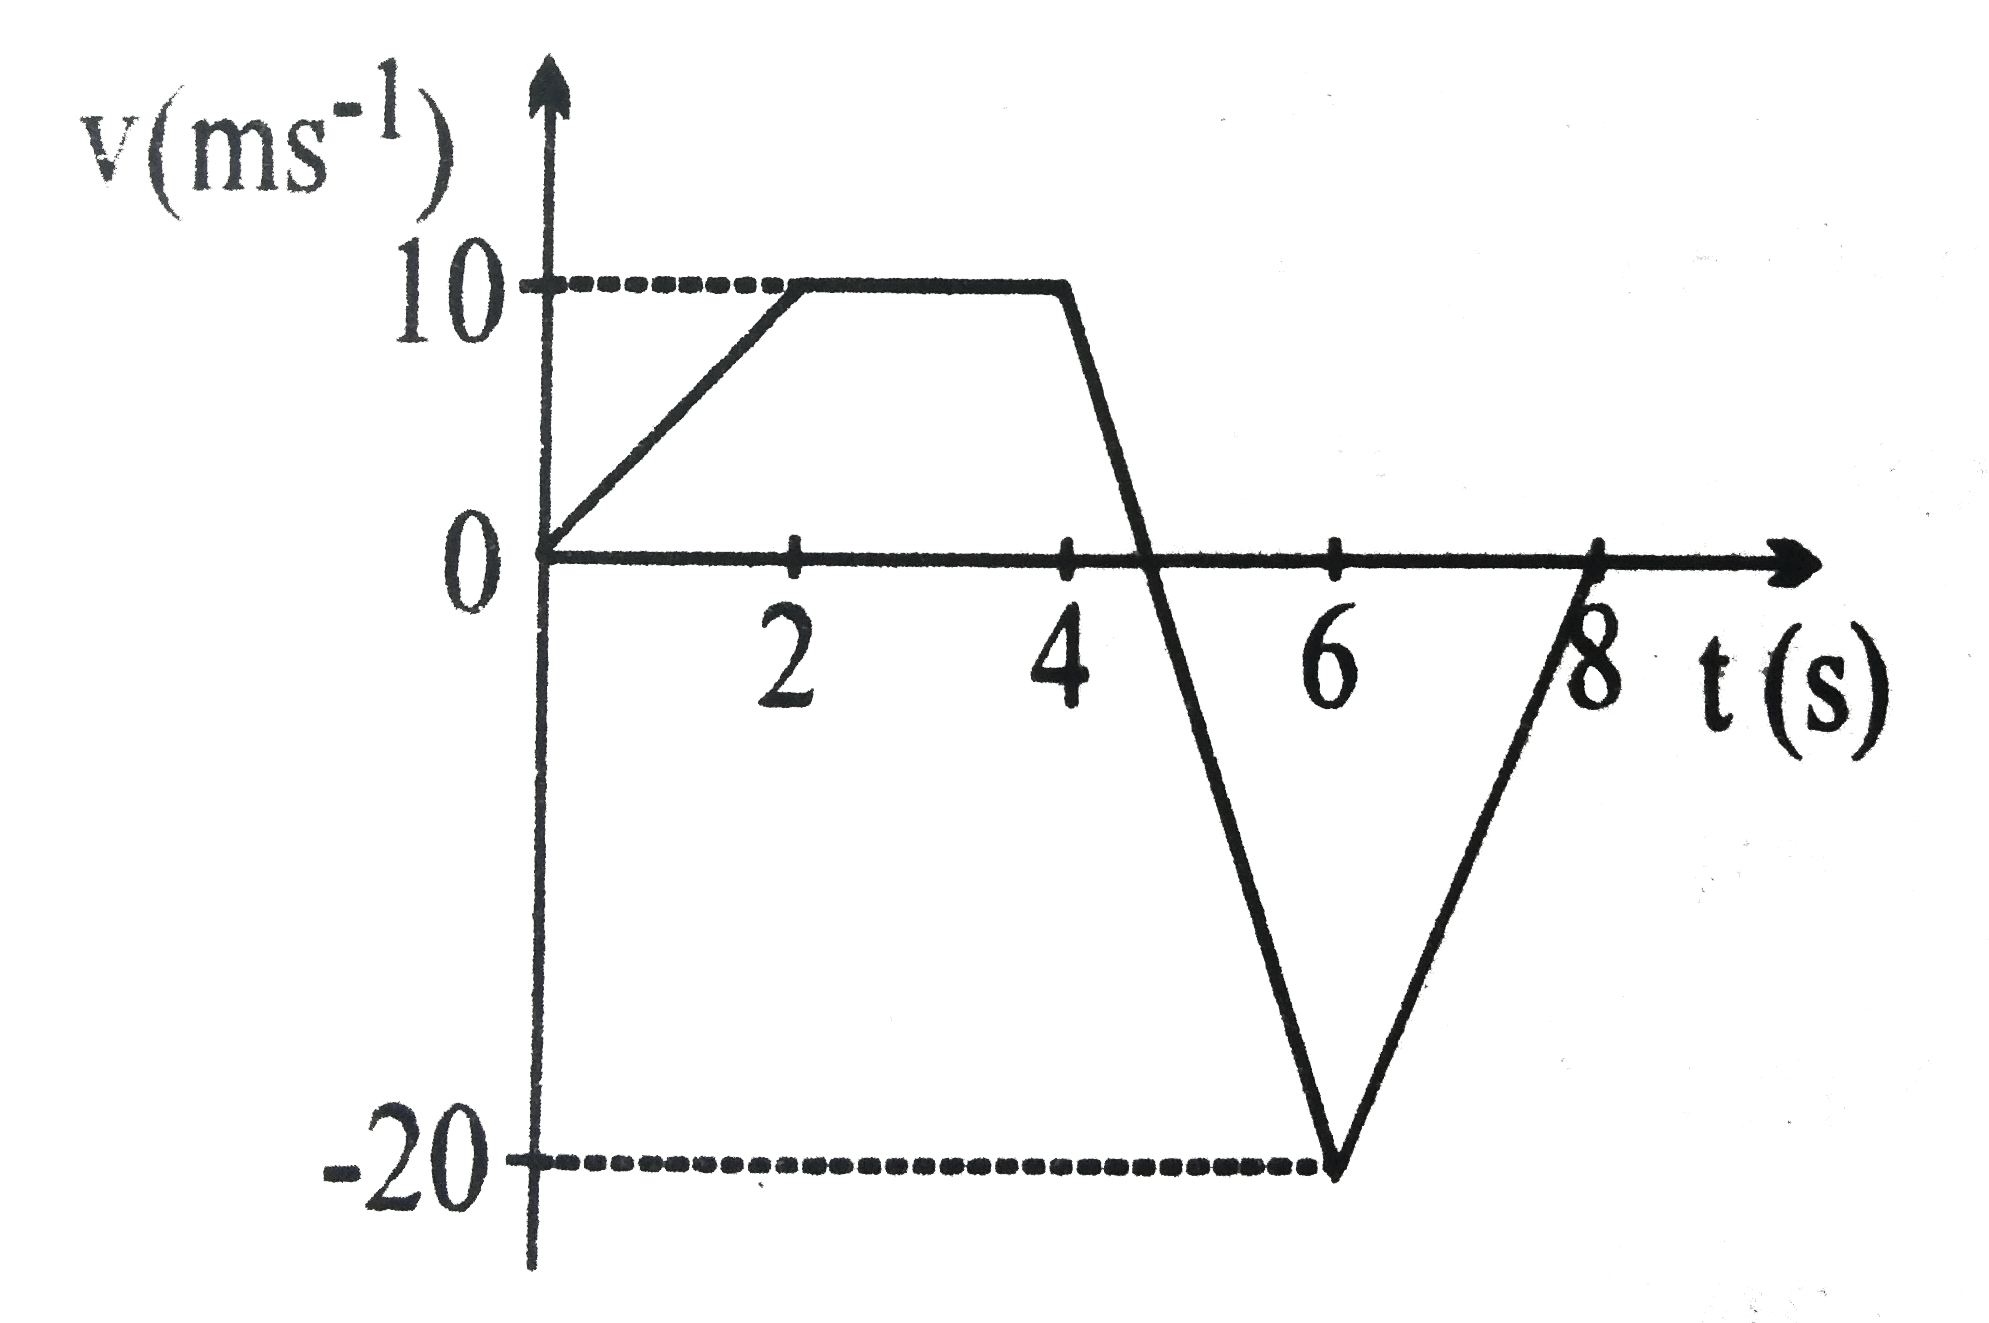
The maximum displacement of the particle is
View Solution
Knowledge Check
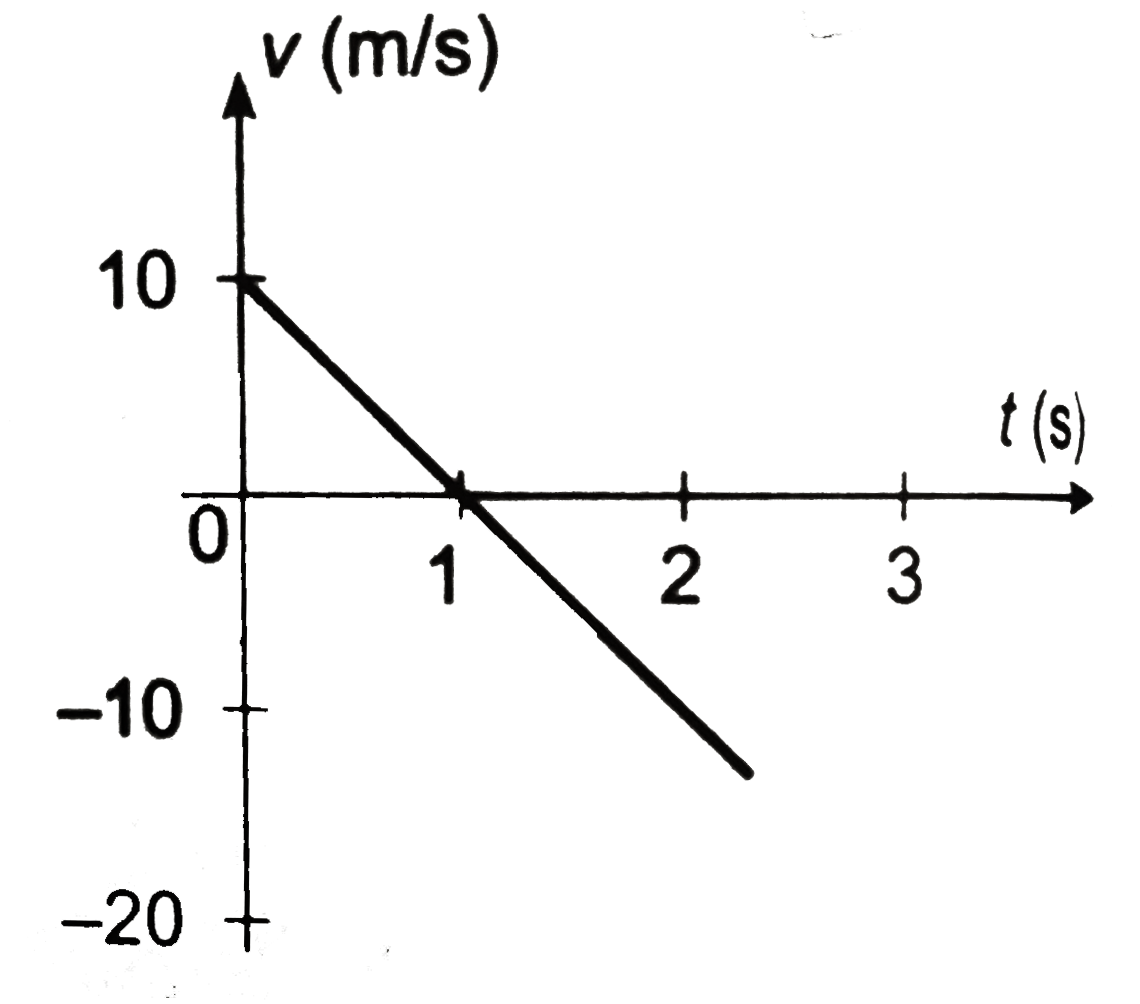
The figure shows a velocity-time graph of a particle moving along a straight line
If the particle starts from the position x0=–15 m, then its position at t = 2s will beA−5mB5mC10 mD15 mThe figure shows a velocity-time graph of a particle moving along a straight line
Q. If the particle starts from the position x0 = –15 m, then its position at t = 2s will beA−5mB5mC10mD15mThe figure shows a velocity-time graph of a particle moving along a straight line
If the particles starts form the position x0=−15m, then its position at t=2s will beA−5B5mC10mD15m
The figure shows velocity-time graph of a particle moving along a straight line. Identify the correct statement.
View SolutionThe figure shows a velocity-time graph of a particle moving along a straight line
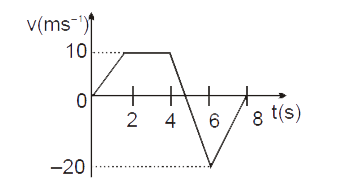
The maximum of displacement of the particle is
View SolutionThe velocity -time (v−t) graph of a particle moving in a straight line is shown in figure. The acceleration of the particle at t=9 is:
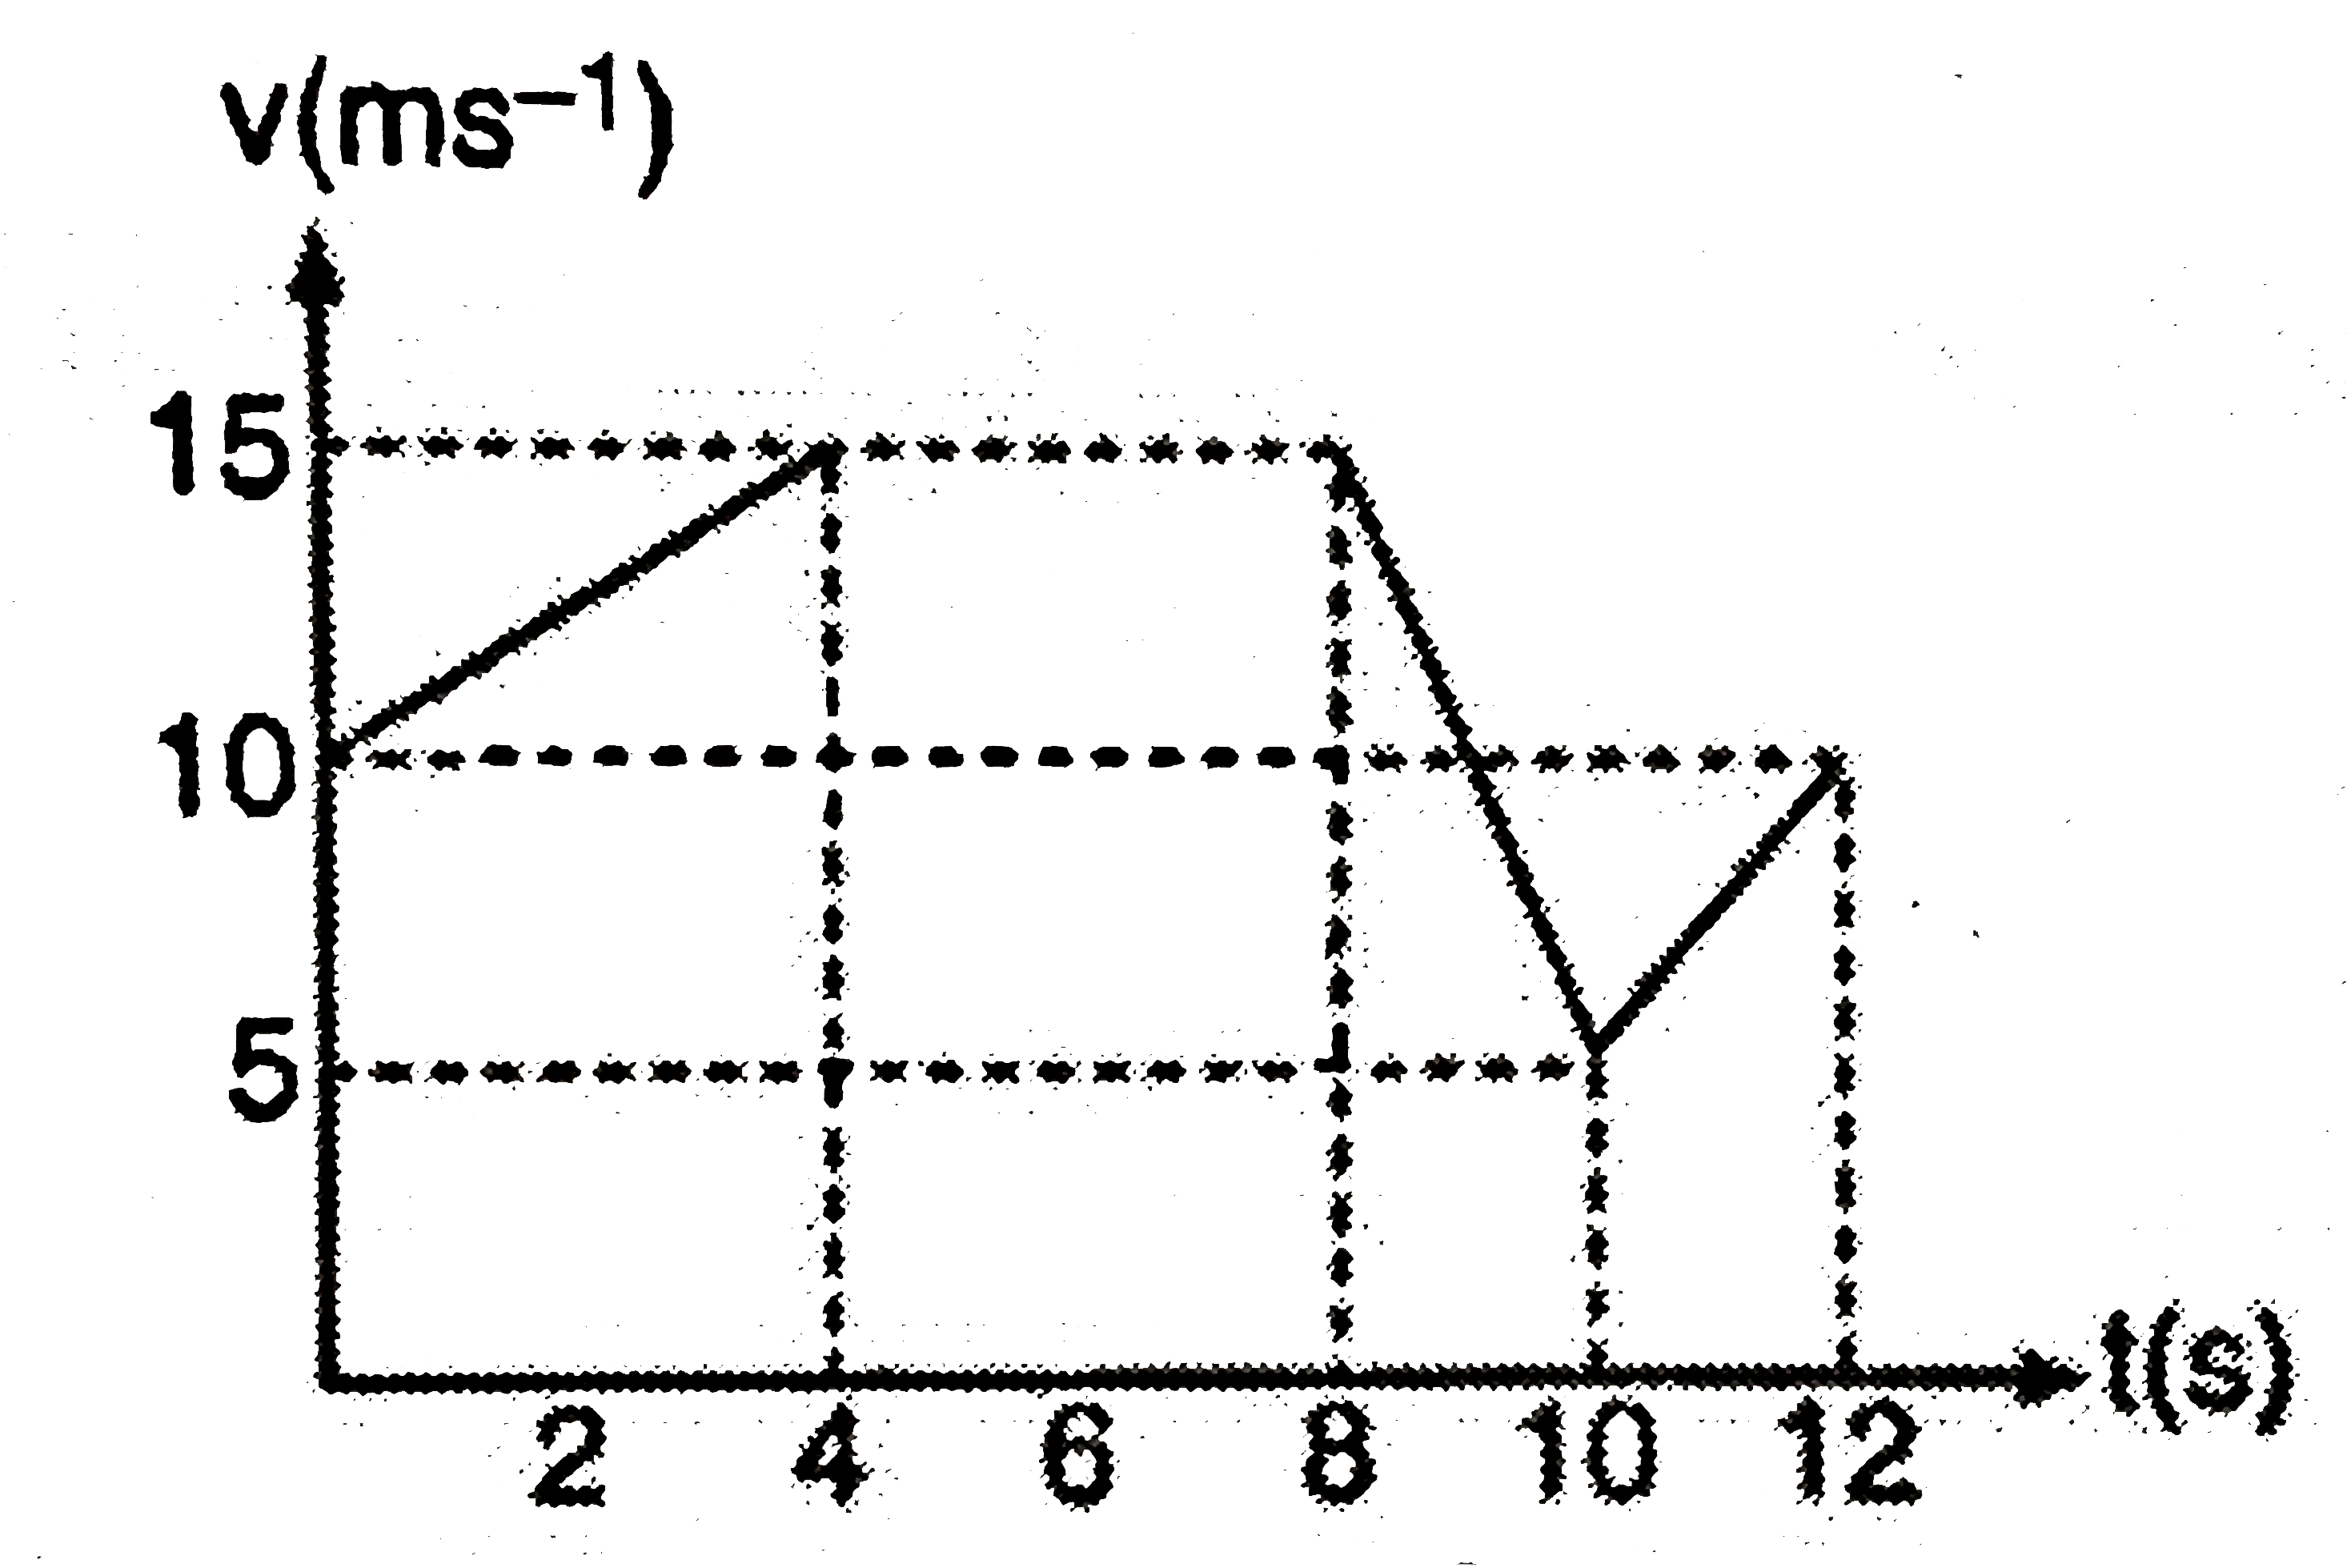
View SolutionThe diagram shows the displacement-time graph for a particle moving in a straight line. Find the average velocity for the interval from t=0 to t=5s.
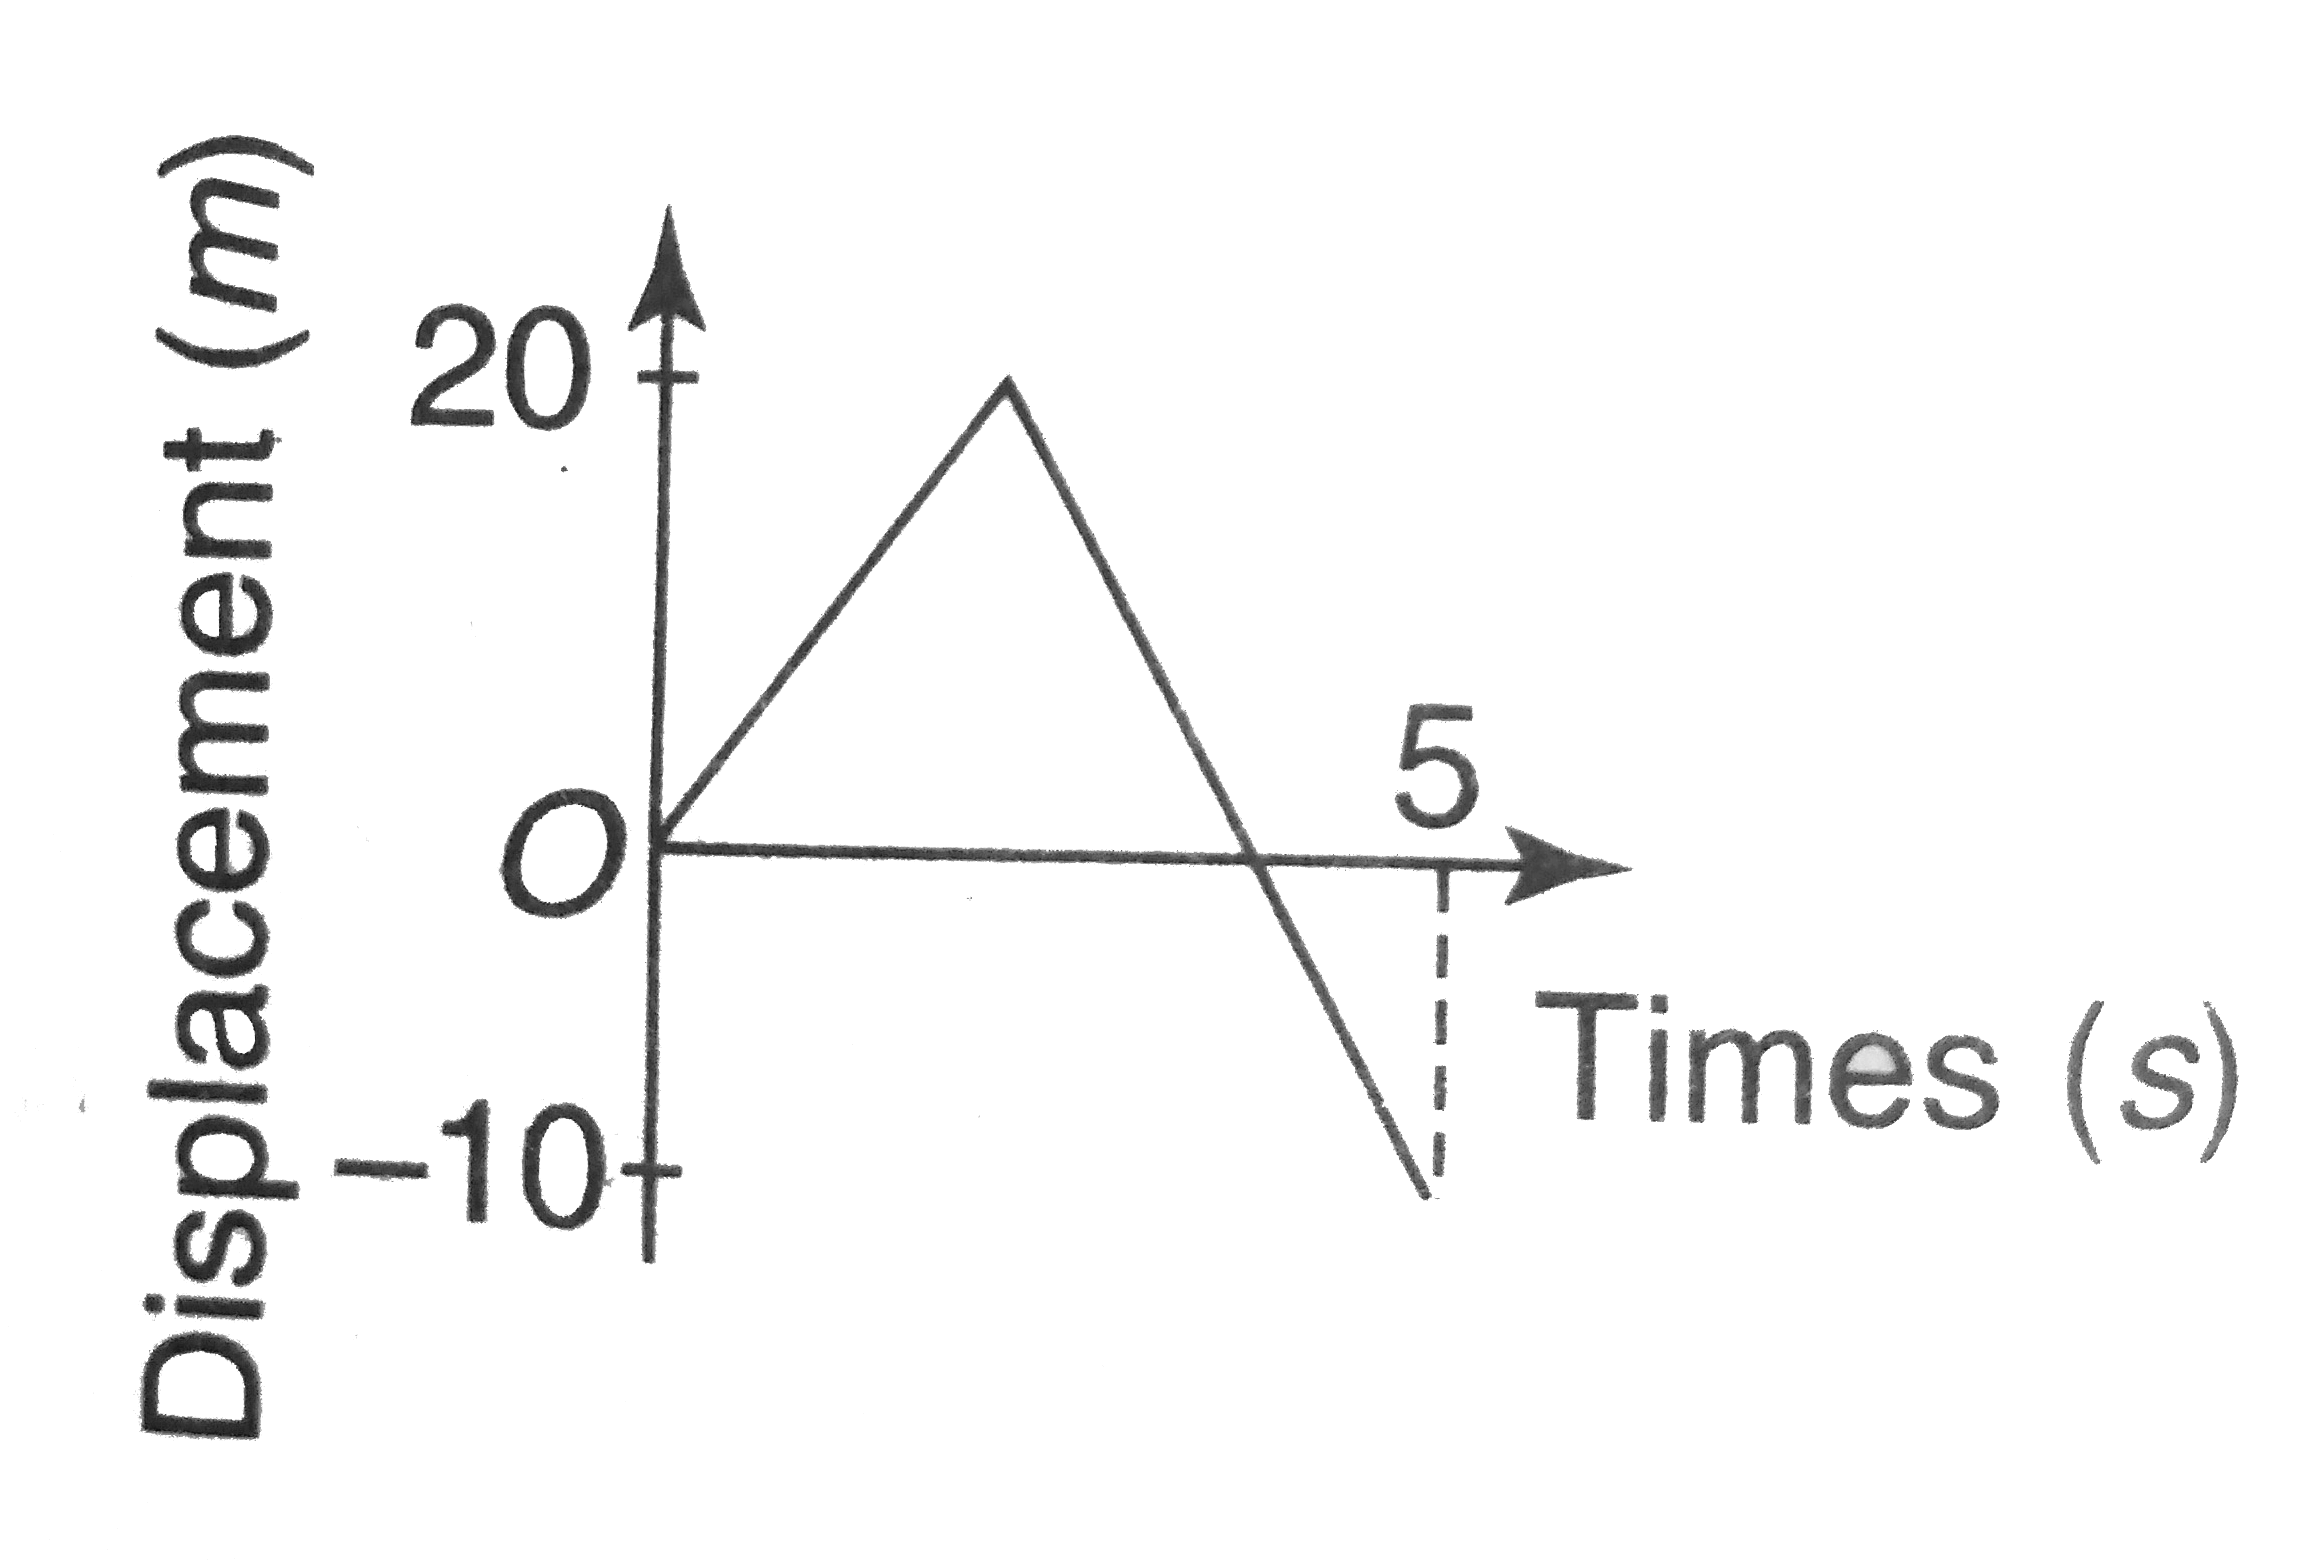
View SolutionThe diagram shows the displacement-time graph for a particle moving in a straight line. Find the average velocity for the interval from t=0 to t=5s.

View Solution