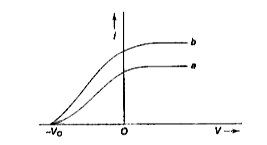
Figure shows the variation of photoelectric current (i) with anode potential (V) for a photosensitive surface for two radiations of intensities and frequencies for the curves a and b respectively. It follows from the graph that
The correct Answer is:B
If follows from the figure that the stopping potential is the same for the two radiations. We know that Since is the same , nd hence v is the same for radiations a and b. Hence since the saturation current is greater for radiation b than for radiation a, the intensity is greater than
Similar Questions
Plot a graph showing the variation of photoelectric current with anode potential for two light beam of same wavelength but different intensity.
View SolutionDraw a plot showing the variation of photoelectric current versus the intensity of incident radiation on a given photosenstive surface.
View Solution
Knowledge Check
The fig. shows the variation of photon current with anode potential for a photo-sensitive surface for three different radiation. Let Ia,IbandIc be the intensities and fa,fbandfc be the frequency for the curves a,b and c respectively.
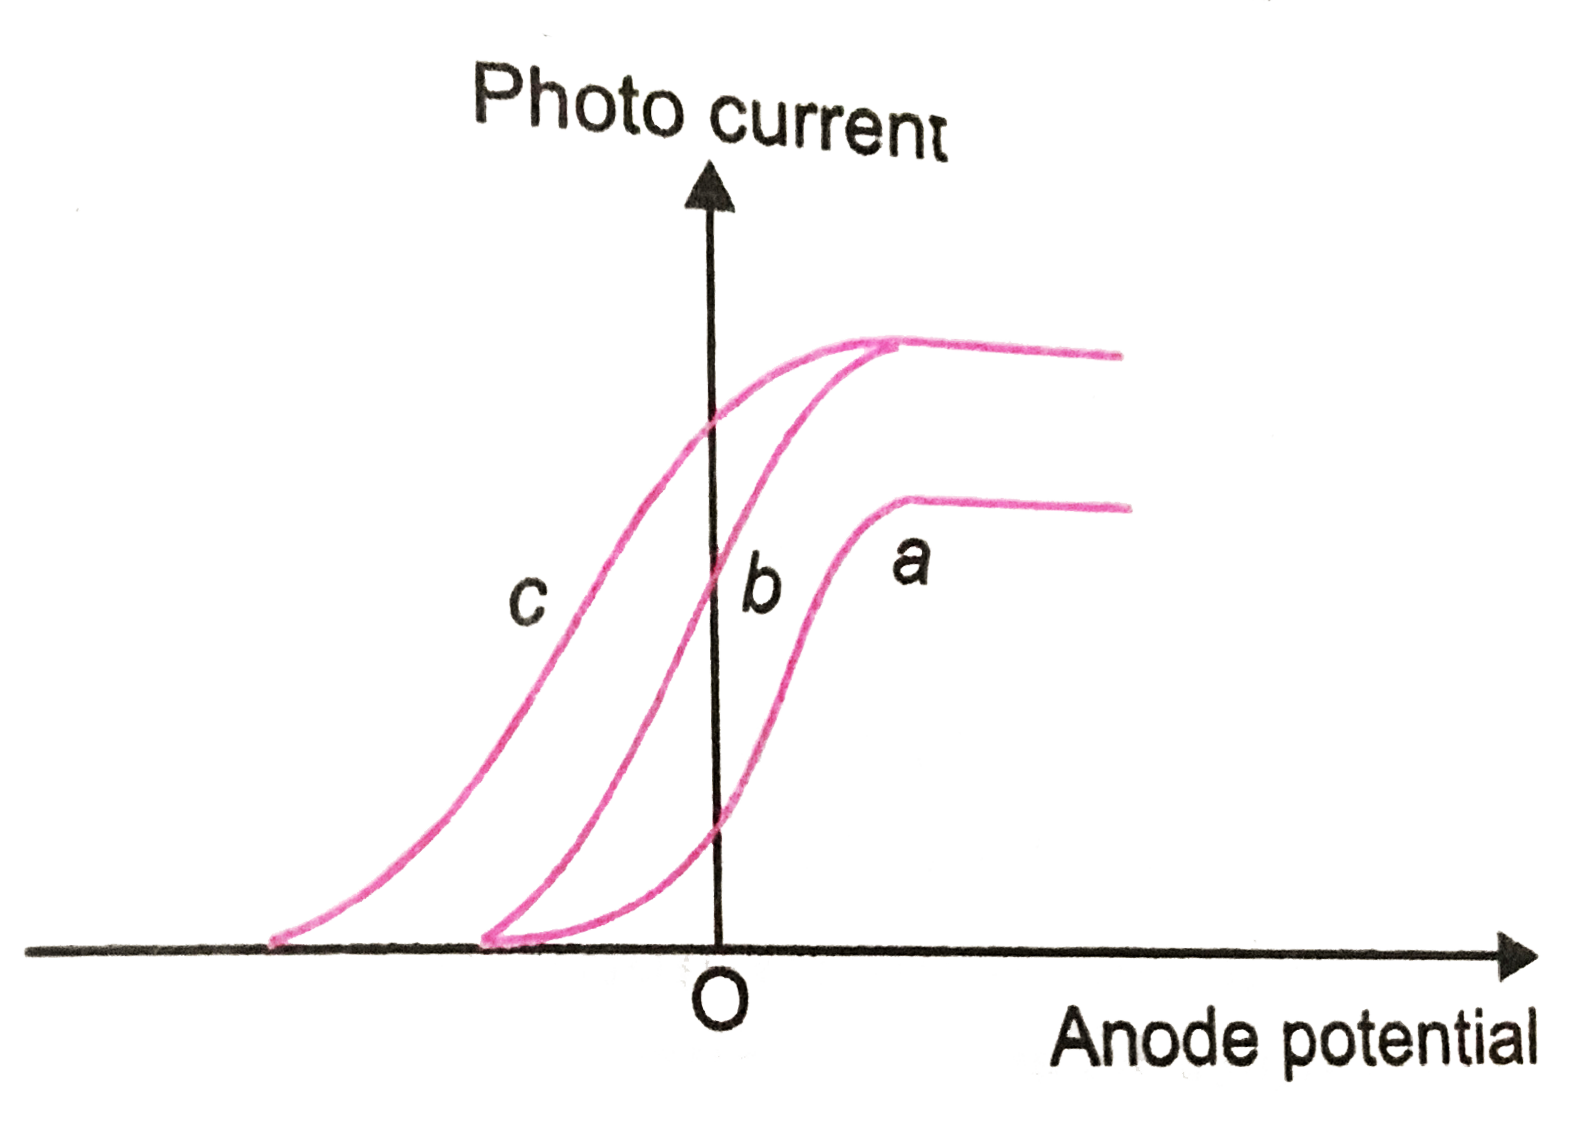 Afa=fbandIa≠IbBfa=fcandIa=IcCfa=fbandIa=IbDfb=fcandIb=Ic
The fig. shows the variation of photon current with anode potential for a photo-sensitive surface for three different radiation. Let Ia,IbandIc be the intensities and fa,fbandfc be the frequency for the curves a,b and c respectively.
 Ava=vbandIa≠IbBva=vcandIa=IcCva=vbandIa=IbDvb=vcandIb=Ic
In the following figure shows the variation of photocurrent with potential of the collector plate for a photosensitive surface for three different radiations. Let Ia,IbandIc be the intensities and fa,fbandfc be the frequencies for the curves a, b, and c, respectively.
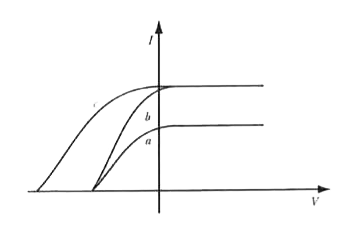 Afa=fbandIa=IbBfa=fcandIa=IcCfa=fbandIa<IbDfa=fcandIb=Ic
Draw a plot showing the variation of photoelectric current versus the intensity of incident radiation on a given photosensitive surface.
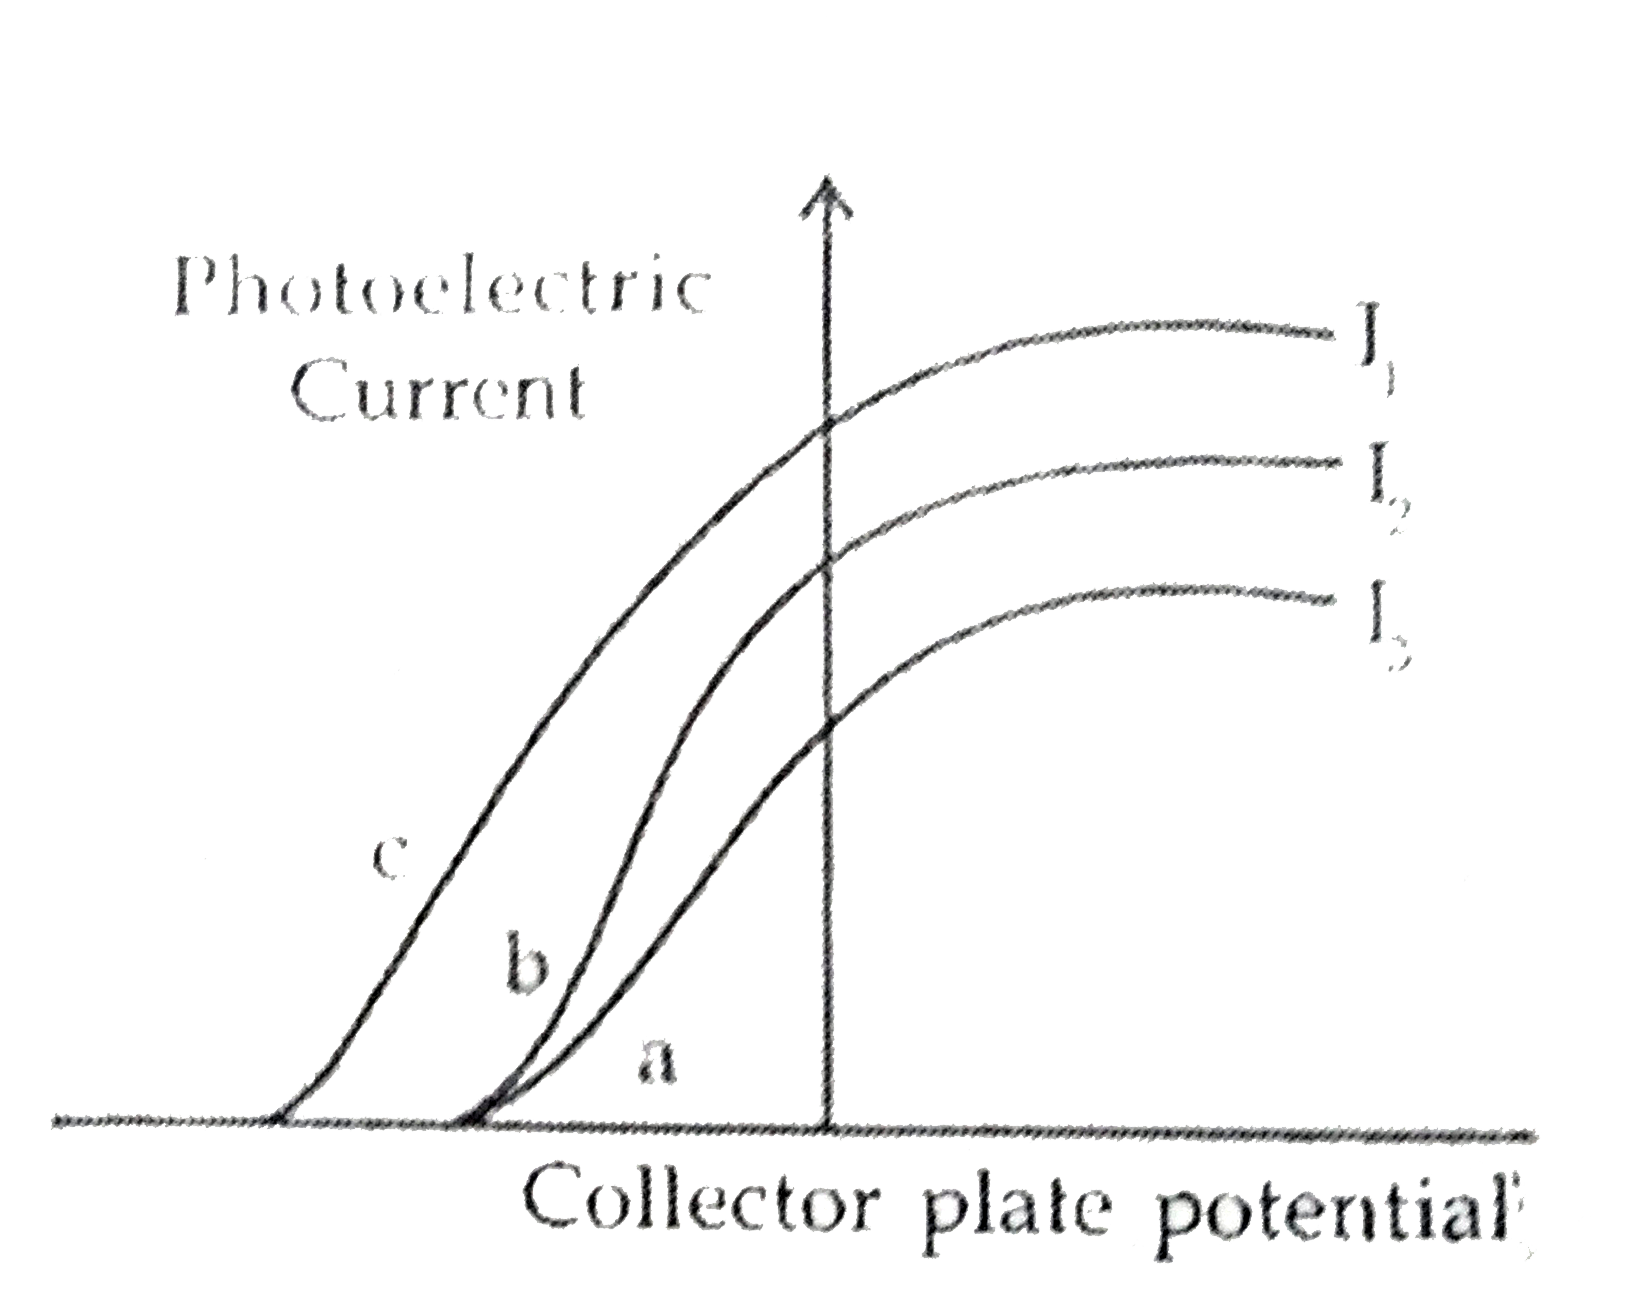
View SolutionThe figure shows a plot of three curves a, b, c, showing variation of photocurrent vs collector plate potential for three different intensities I1,I2andI3 having frequencies v1,v2andv3 respectively incident on a photosensitive surface.
Point out the two curves for which the incident radioations have same frequency but different intensities.
View SolutionThe graph of Fig. shows the variation of photoelectric current (I) versus applied voltage (V) for the two different photosensitive materials for two different intensities of the incident radiation. Identify the pairs of curves that correspond to different materials but same intensity of incident radiation.
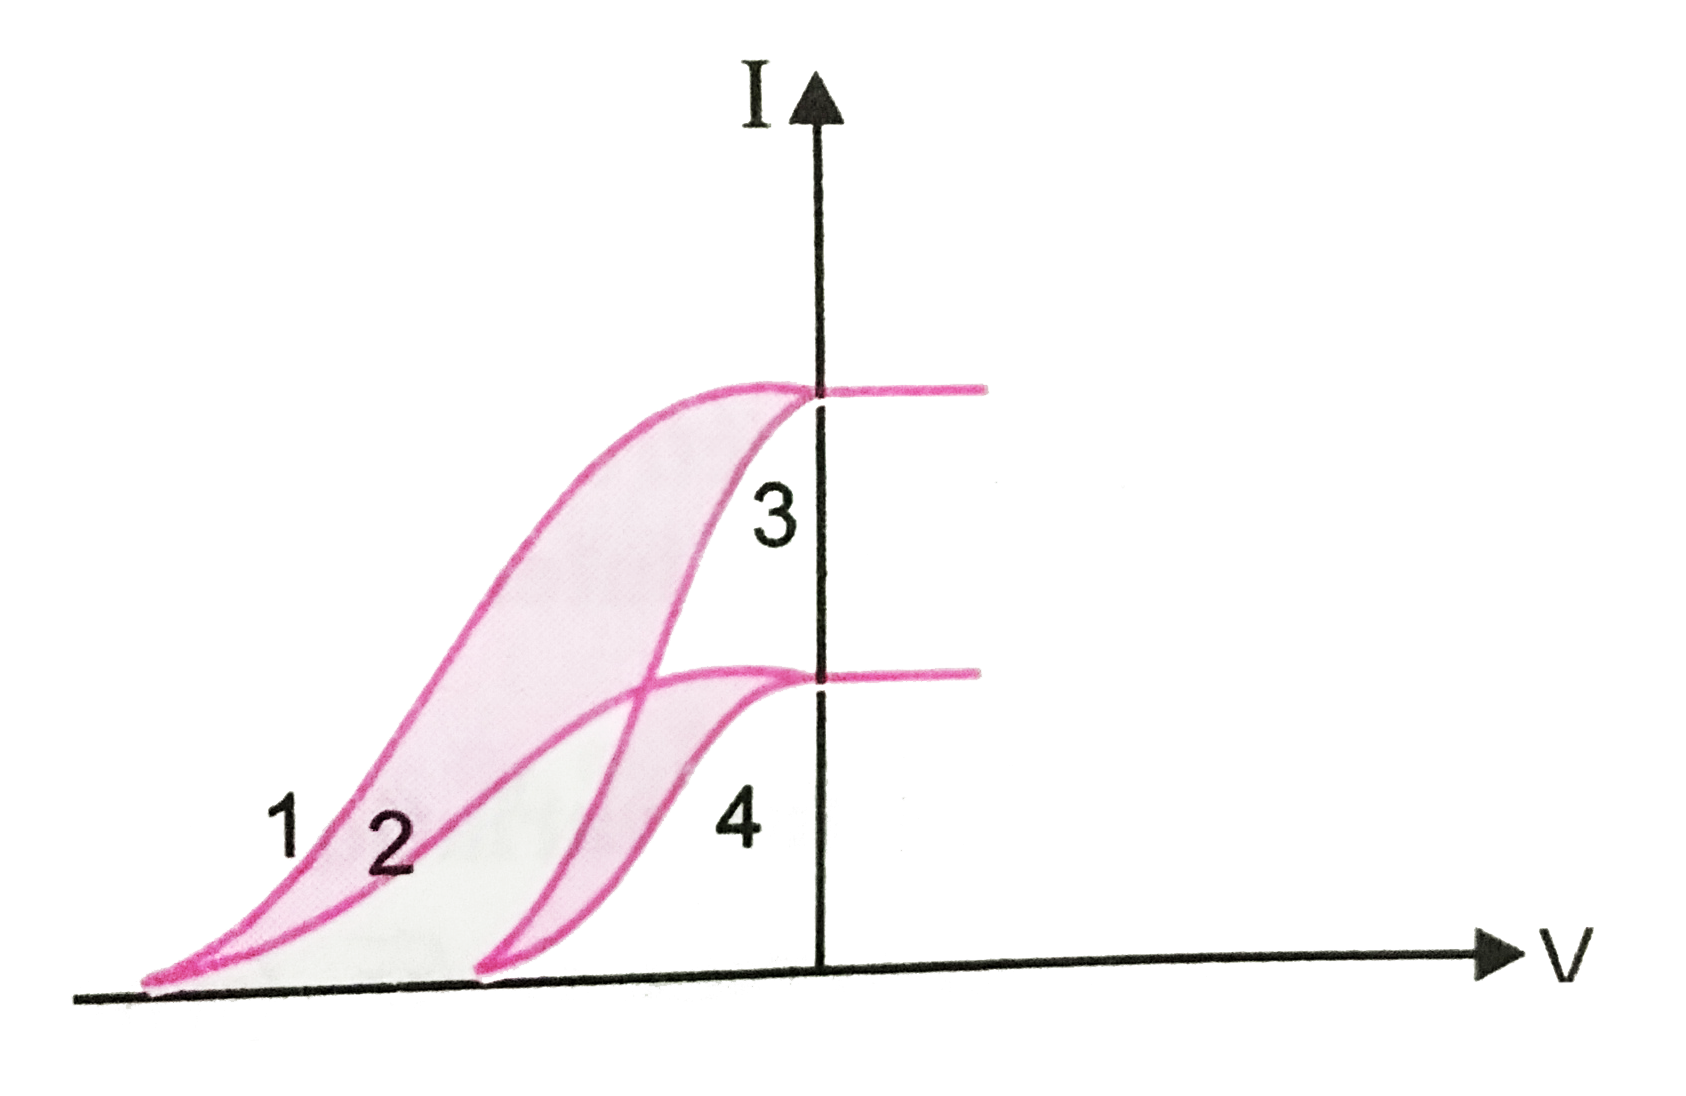
View SolutionThe graph of Fig. shows the variation of photoelectric current (I) versus applied voltage (V) for the two different photosensitive materials for two different intensities of the incident radiation. Identify the pairs of curves that correspond to different materials but same intensity of incident radiation.

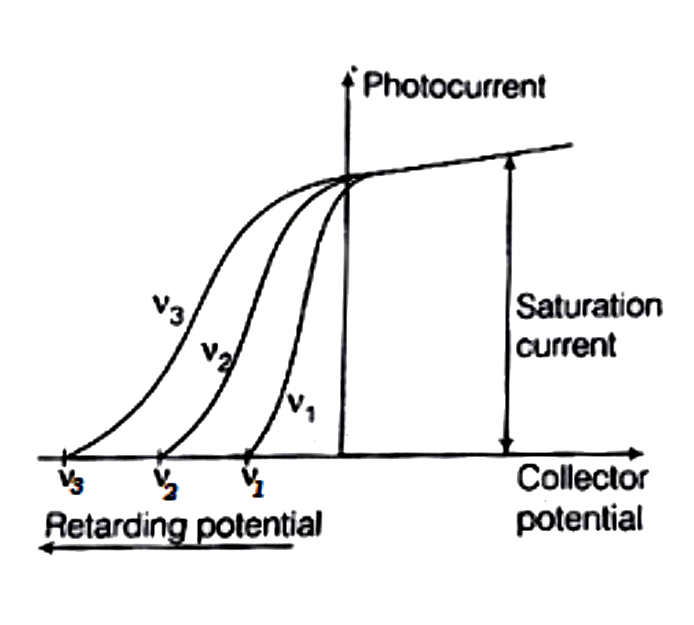
View SolutionThe variation of photocurrent with collector potential for different frequencies of incident radiation v1,v2,v3 is as shown in the the graph , then
View Solution
