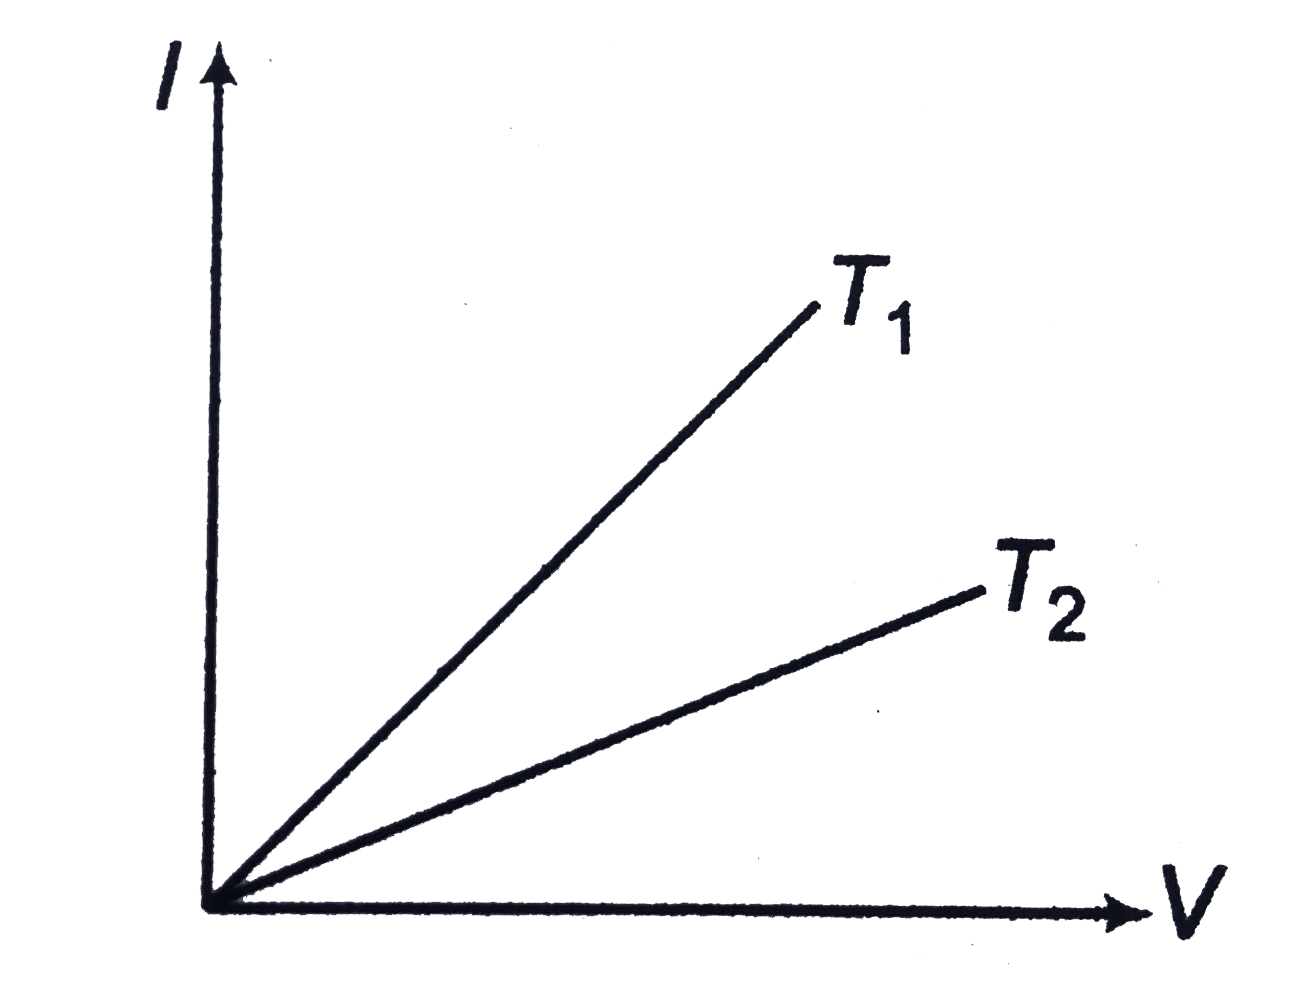
V-I graph for a mettalic wire at two different temperatures T1 and T2 is as shown in figure. WHich of the temperatures T1 and T2 is higher and why.
 Solution in Punjabi
Step by step video & image solution for V-I graph for a mettalic wire at two different temperatures T_1 and T_2 is as shown in figure. WHich of the temperatures T_1 and T_2 is higher and why. by Physics experts to help you in doubts & scoring excellent marks in Class 12 exams.
Updated on:21/07/2023Similar Questions
The current voltage graphs for a given metalic wire two different temperature T1 and T2 are shown in figure The temperature T2 is greater than T1. Is this statement true or false?

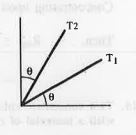
View SolutionThe VI graphs for a conductor at temperature T1 and T2 are shown in the figure
 . Here (T2−T1) is proportional to
View SolutionThe current voltage graphs for a given metalic wire two different temperature T1 and T2 are shown in figure The temperature T2 is greater than T1. Is this statement true or false?

View SolutionThe current - voltage graphs for a given metallic wire at two different temperatures T_1 and T_2 are shown in the figure. The temperature T_2 is greater than T_1 .
View SolutionThe current - voltage graphs for a given metallic wire at two different temperatures T_1 and T_2 are shown in the figure. The temperature T_2 is greater than T_1 .
View SolutionExplain why (a) Two bodies at different temperatures T_1 and T_2 if brought in thermal contact do not necessarily settle to the mean temperature (T_1, + T_2)//2 .
View SolutionThe V-I graph is drawn for a metal wire at two temperatures T_1 and T_2 If T_1 gt T_2 then which wire will have more resistance ?
View Solution
