Draw a plot showing the variation of photoelectric current versus the intensity of incident radiation on a given photosensitive surface.Solution in Punjabi
Step by step video & image solution for Draw a plot showing the variation of photoelectric current versus the intensity of incident radiation on a given photosensitive surface. by Physics experts to help you in doubts & scoring excellent marks in Class 12 exams.
Similar Questions
Draw a graph showing variation of photoelectric current (I) with anode potential ( V ) for different intensities of incident radiation. Name the characteristic of incident radiation that is kept constant in this experiment.
03:05View SolutionDraw a plot showing the variation of photoelectric current versus the intensity of incident radiation on a given photosenstive surface.
03:19View SolutionDraw graphs showing variation of photoelectric current with applied voltage for three incident radiations of equal frequency and different intensities. Mark the graph for the radiation of higher intensity.
View SolutionDraw a plot showing the variation of photoelectric current versus the intensity of incident radiation on a given photosensitive surface.
View SolutionExplain effect of variation of intensity of incident radiation on photoelectric current.
04:52View SolutionDraw a plot showing the variation of photoelectric current with collector plate potential for two different frequencies, v1>v2 of incident radiation having the same intensity. In which case will the stopping potential be higher? Justify your answer.
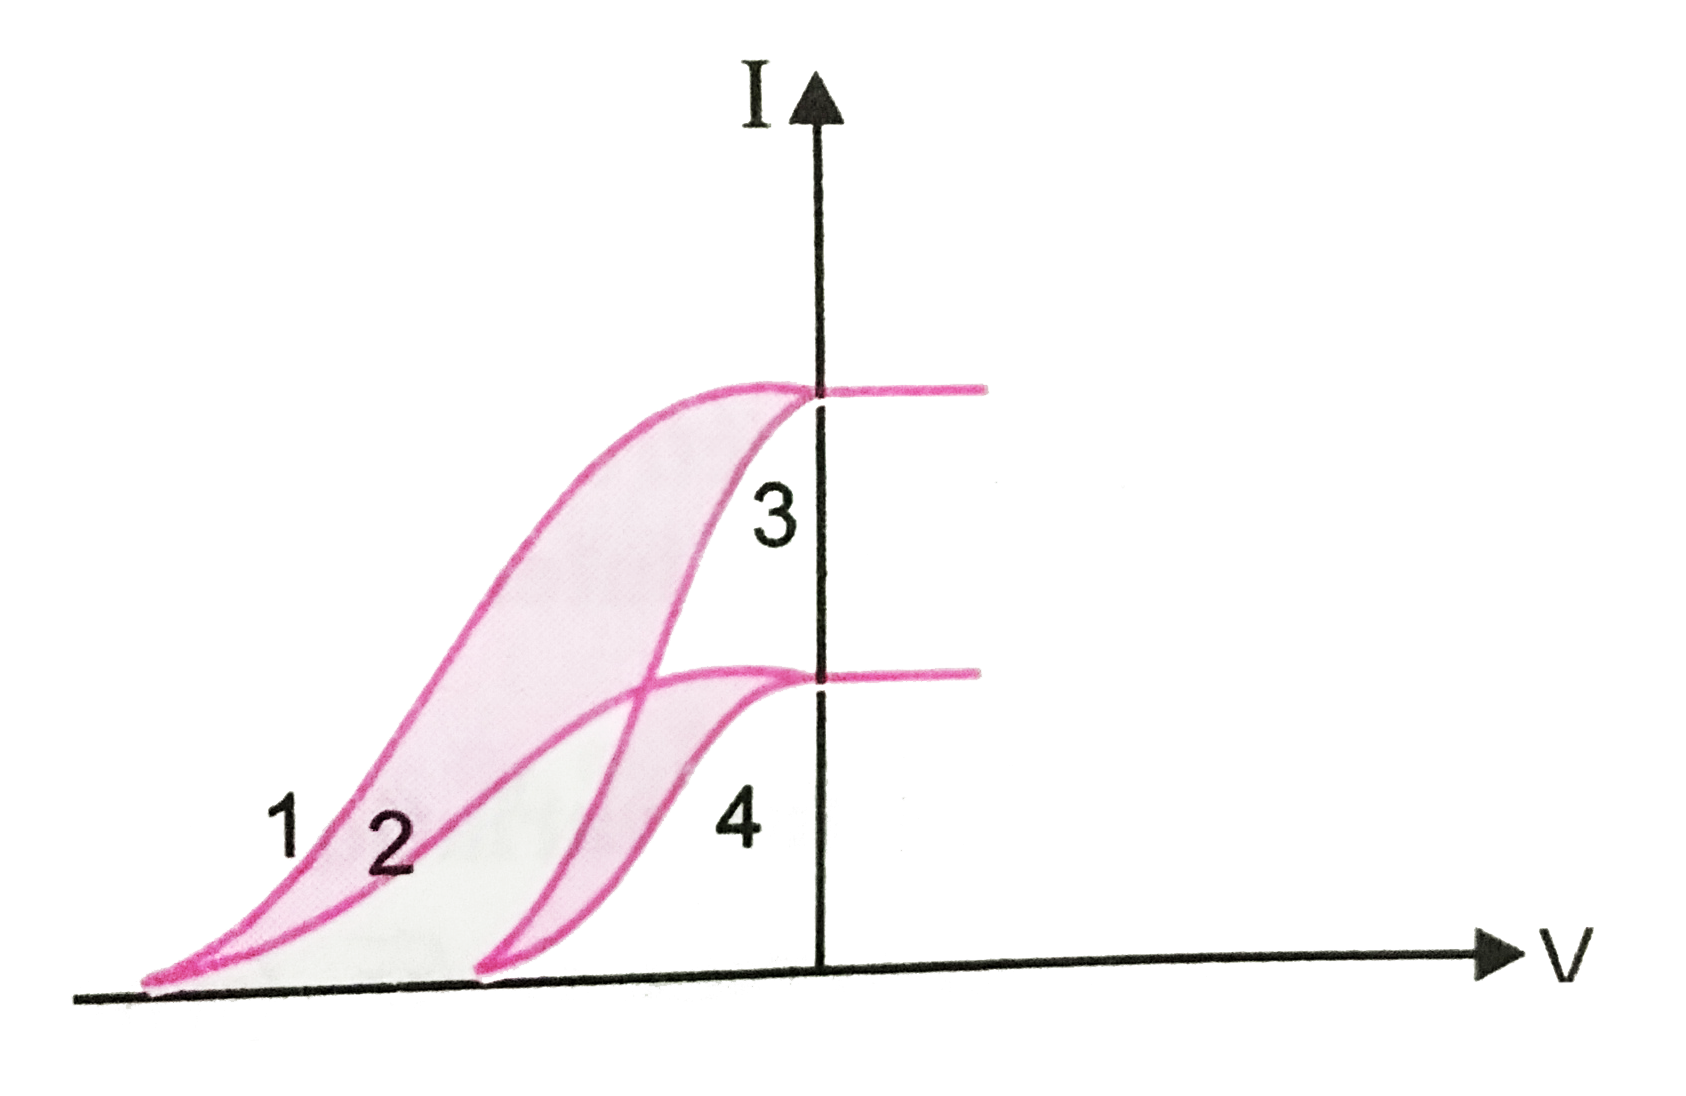
02:47View SolutionThe graph of Fig. shows the variation of photoelectric current (I) versus applied voltage (V) for the two different photosensitive materials for two different intensities of the incident radiation. Identify the pairs of curves that correspond to different materials but same intensity of incident radiation.
 01:00View Solution
(i) Mono chromatic light of frequency 6.0xx10^(14)Hz is produced by a laser. The power emitted is 2.0xx10^(-3)W . Estimate the number of photons emitted per second on an average by the source. (ii) Draw a plot showing the variation of photoelectric current versus the intensity of incident radiation on a given photosensitive surface.
04:58View Solution

