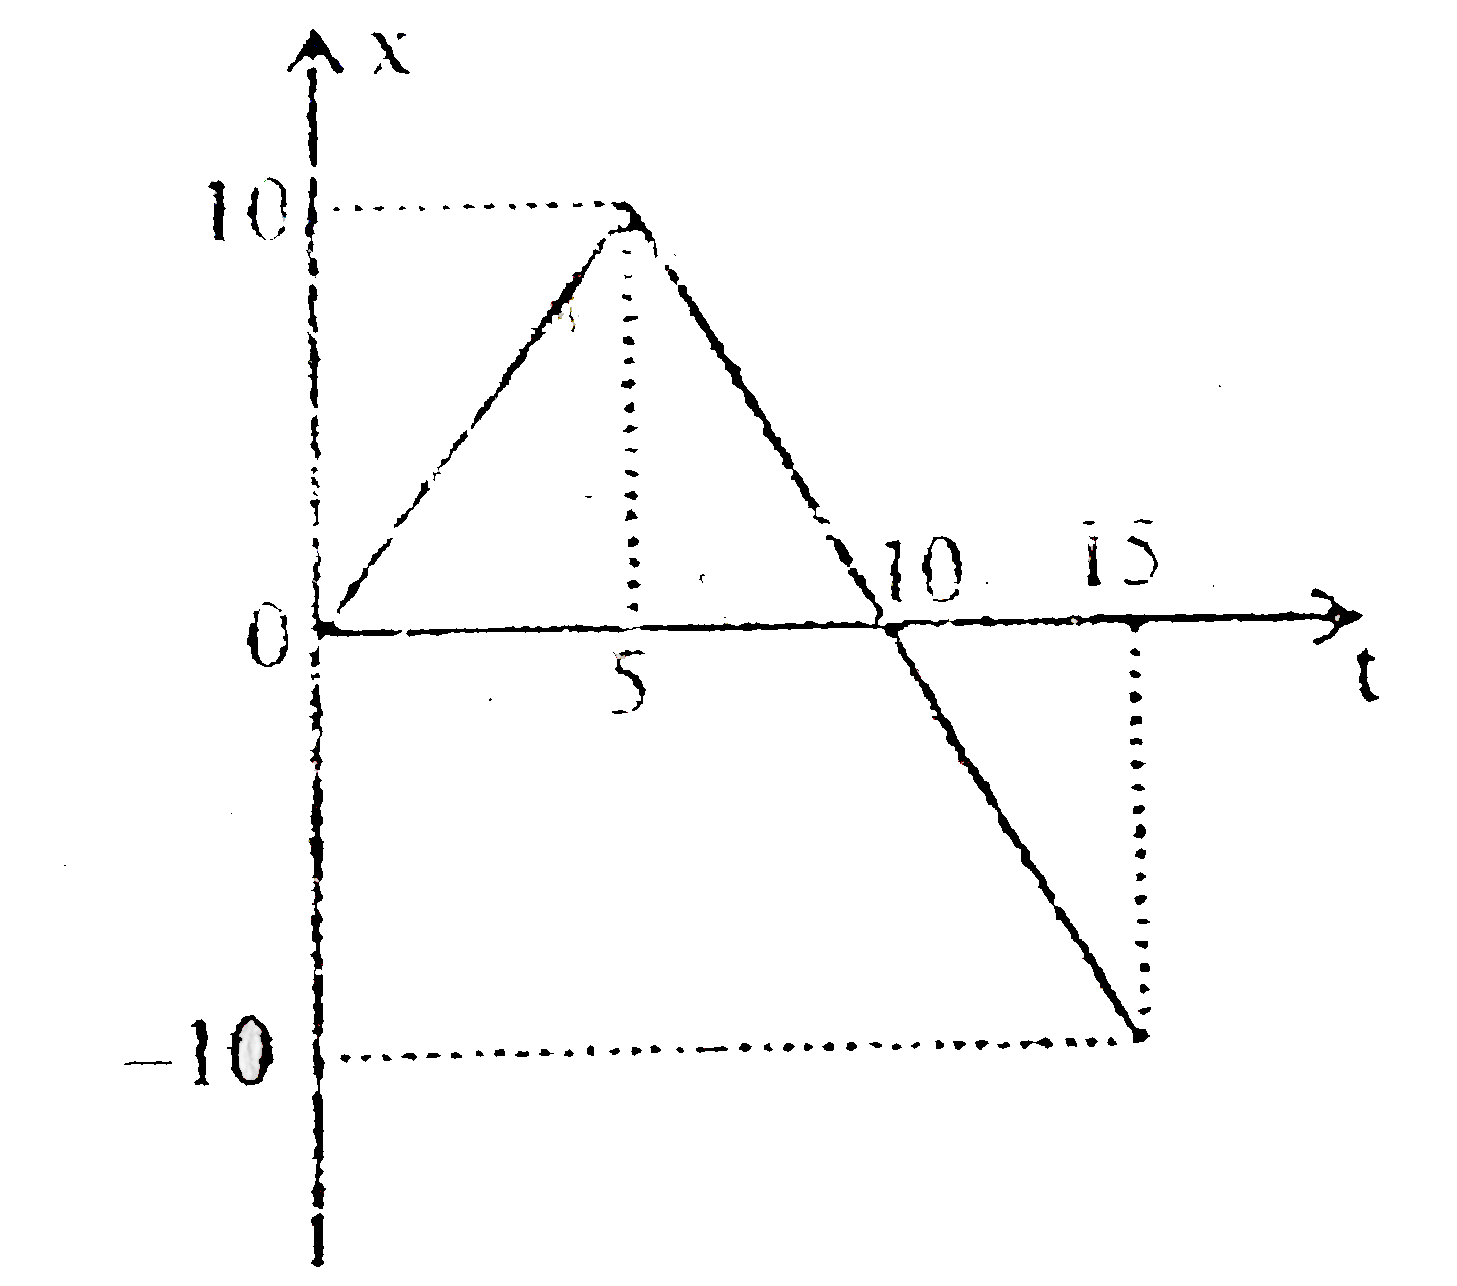
Position time graph is given find average speed in time t=0 and t=15sec is
 Solution in Gujrati
5m/s
53m/s
2m/s
23m/s
The correct Answer is:C
Average speed =30/15=2m/s
Topper's Solved these Questions
- TEST PAPERBOOK - ALLEN CHAPTER - TEST PAPEREXERCISE - Exercise (Physics)
330 Videos
- TEST PAPERBOOK - ALLEN CHAPTER - TEST PAPEREXERCISE - PHYSICS
4 Videos
- SIMPLE HARMONIC MOTIONBOOK - ALLEN CHAPTER - SIMPLE HARMONIC MOTIONEXERCISE - Example
1 Videos
- TEST PAPER 1BOOK - ALLEN CHAPTER - TEST PAPER 1EXERCISE - PHYSICS
11 Videos
Similar Questions
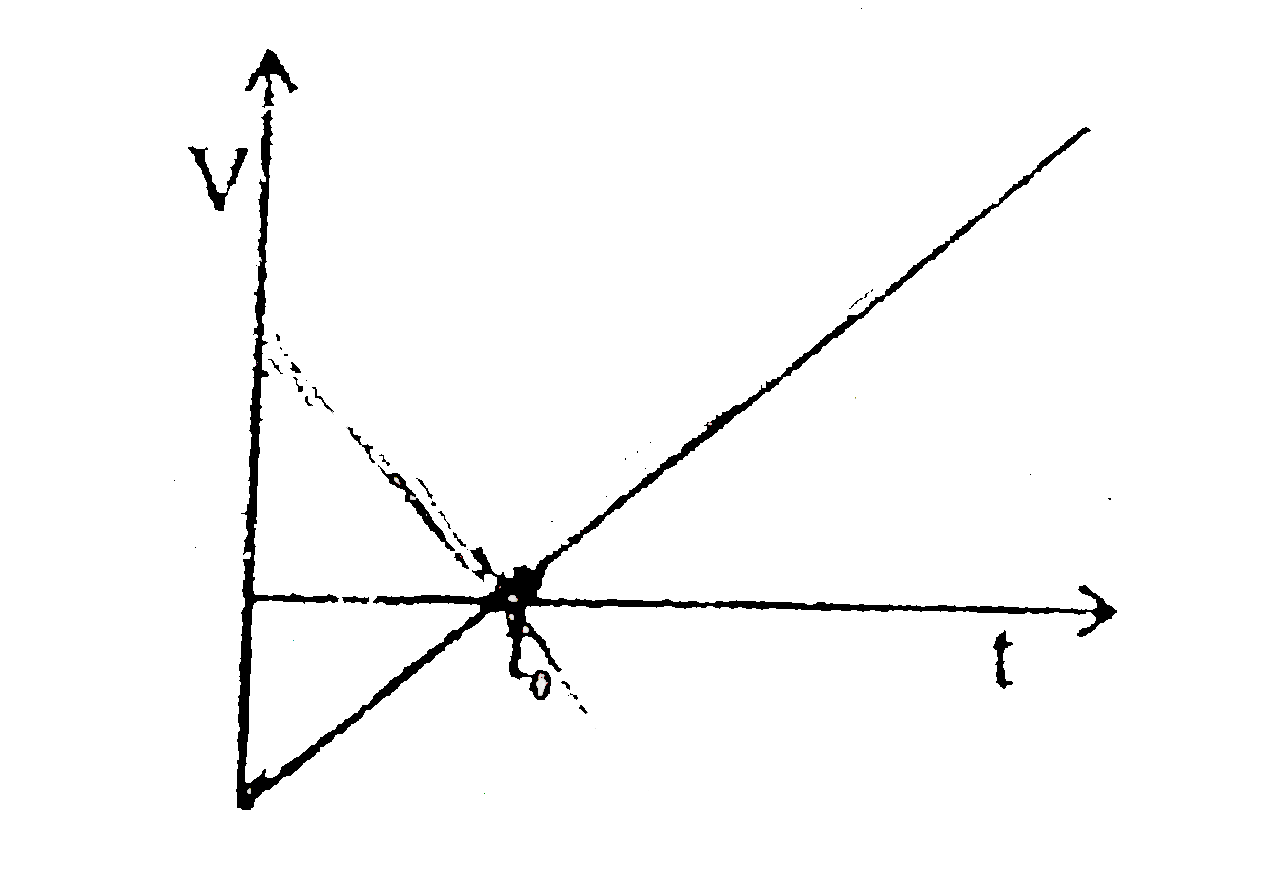
Figure shows velocity time graph of a particle moving in straight line. Which of the following statement(s) is / are CORRECT:−
View SolutionChoose the correct statement:
View SolutionA rod with rectangular cross section oscillates about a horizontal axis passing through one of its ends and it behaves like a seconds pendulum, its length will be
View SolutionWhy are electric field lines perpendicular at a point on an equipotential surface of a conductor ?
View SolutionVelocity-time graph of a particle moving in a straight line is shown in figure. In the time interval from t=0 to t=14s, find
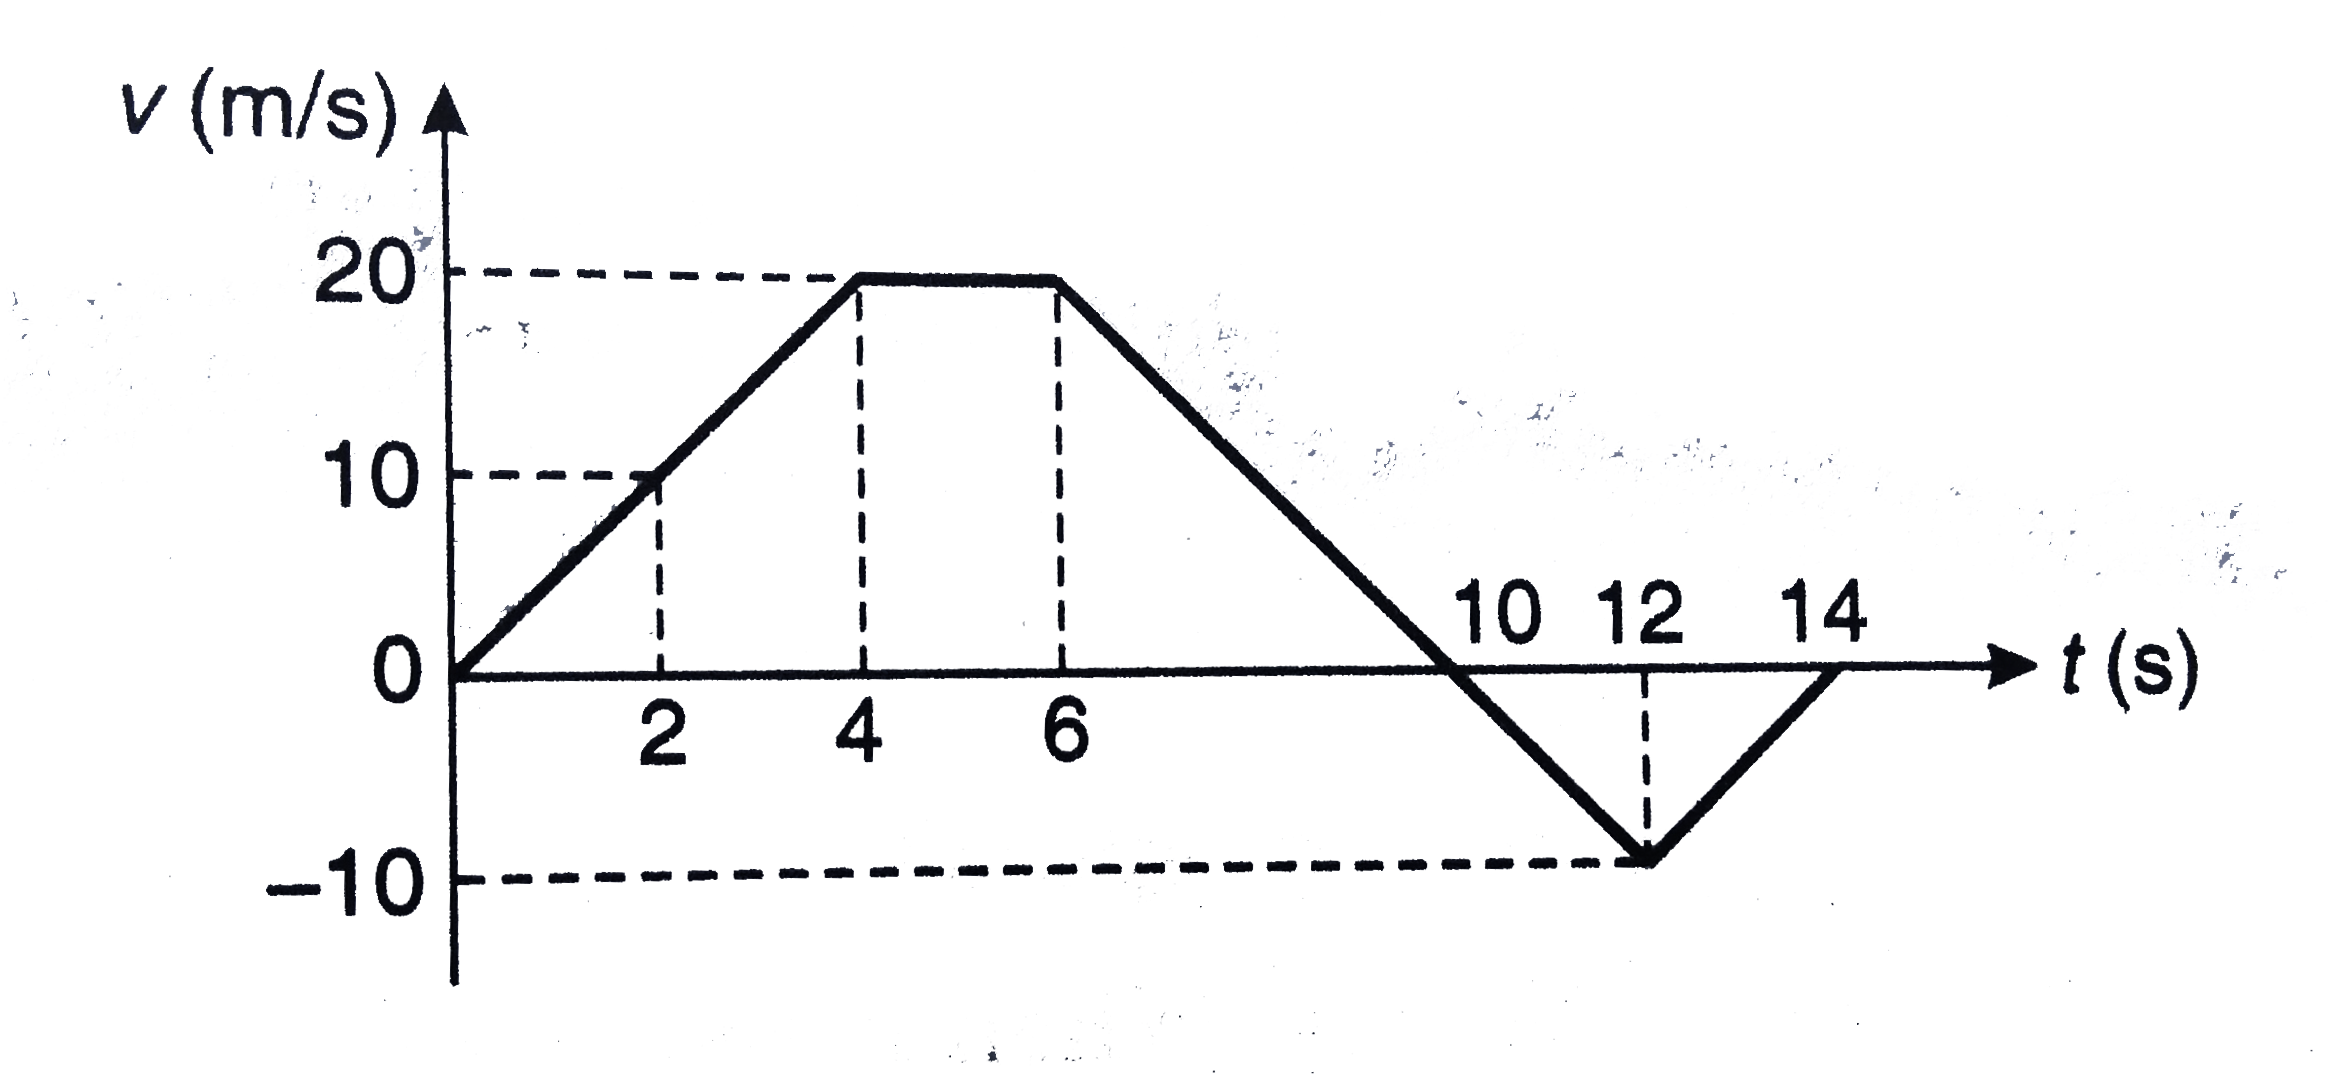
(a) average velocity and
(b) average speed of the particle.
View SolutionThe velocity-time graph of a body is given below. Find the average velocity from t = 0 to t = 40 s .
View SolutionA particle position as function of time is described as y (t) =5 cos (10 t + 15) in meters. What is the average velocity of the particle from t=0 at t= 3 sec ?
View SolutionPosition-time graph for a particle moving along x- direction is as shown in the figure. Average speed of the particle from t = 0 to t = 4 is :
View SolutionDuring one dimensional motion on x-axis Velocity time graph for particle is given.
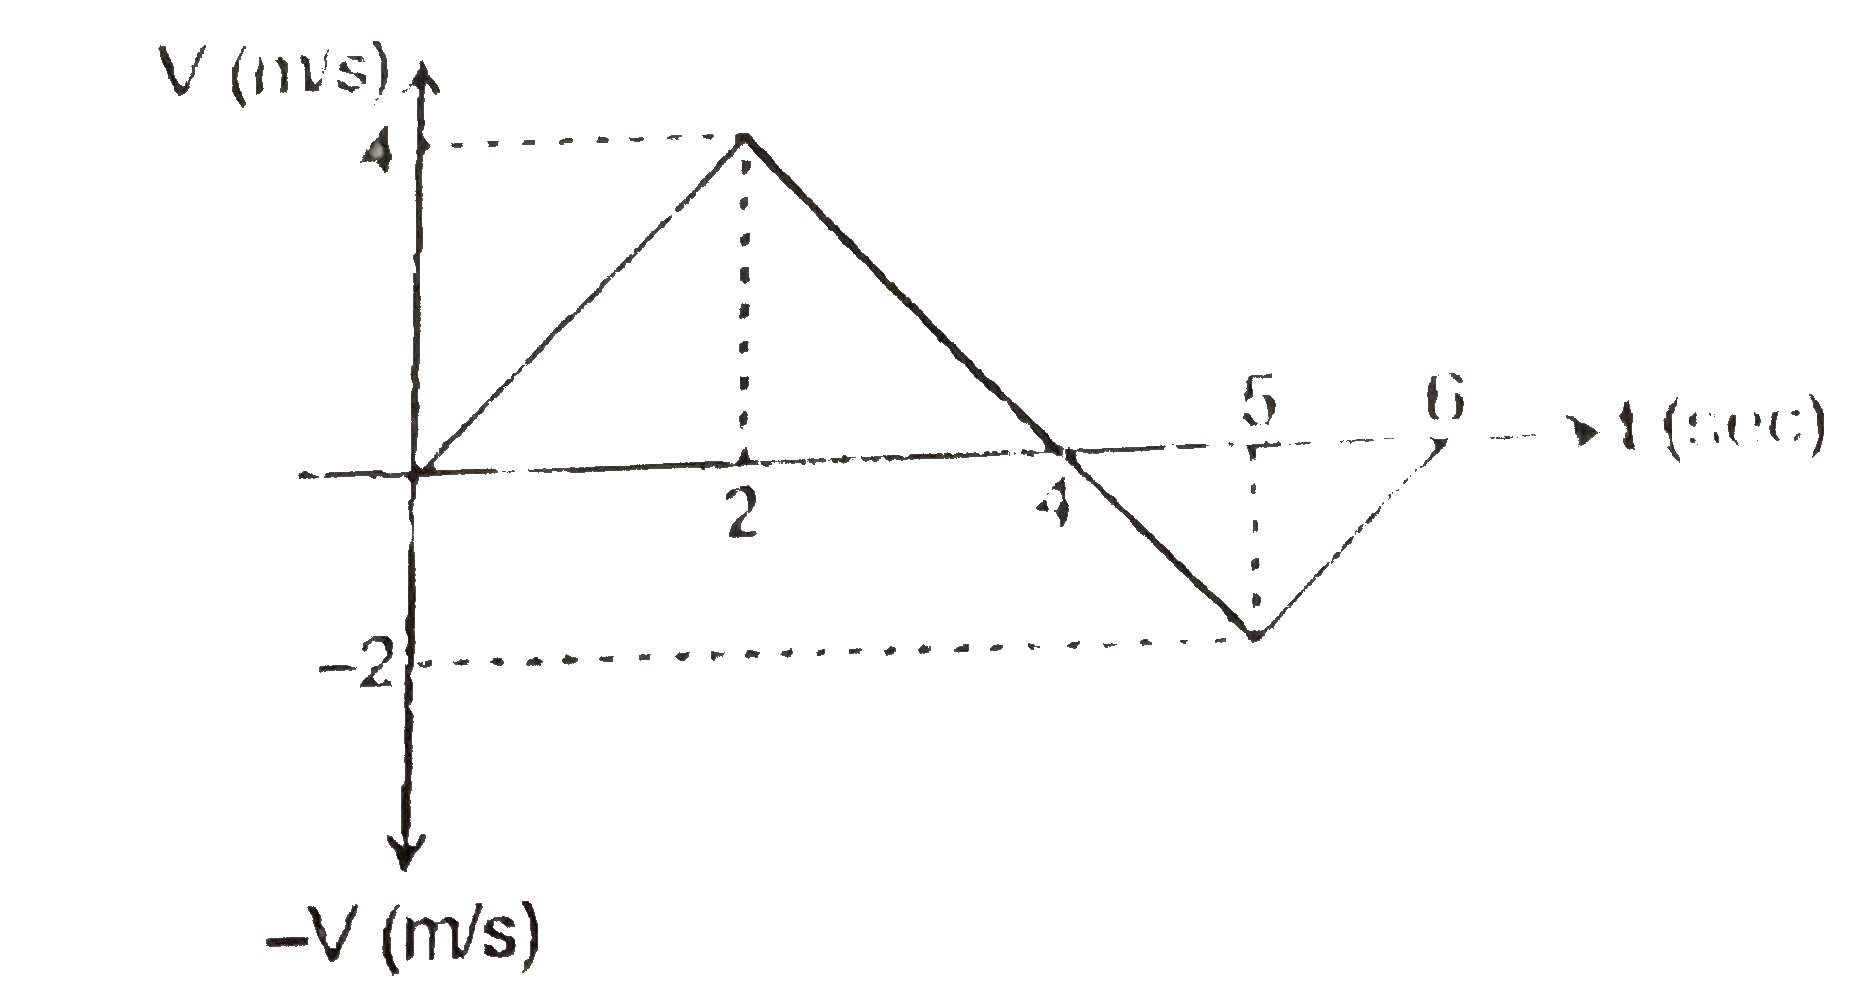
Average acceleration between (t = 0 sec) to (t = 6 sec)
View SolutionThe velocity-time graph is given below
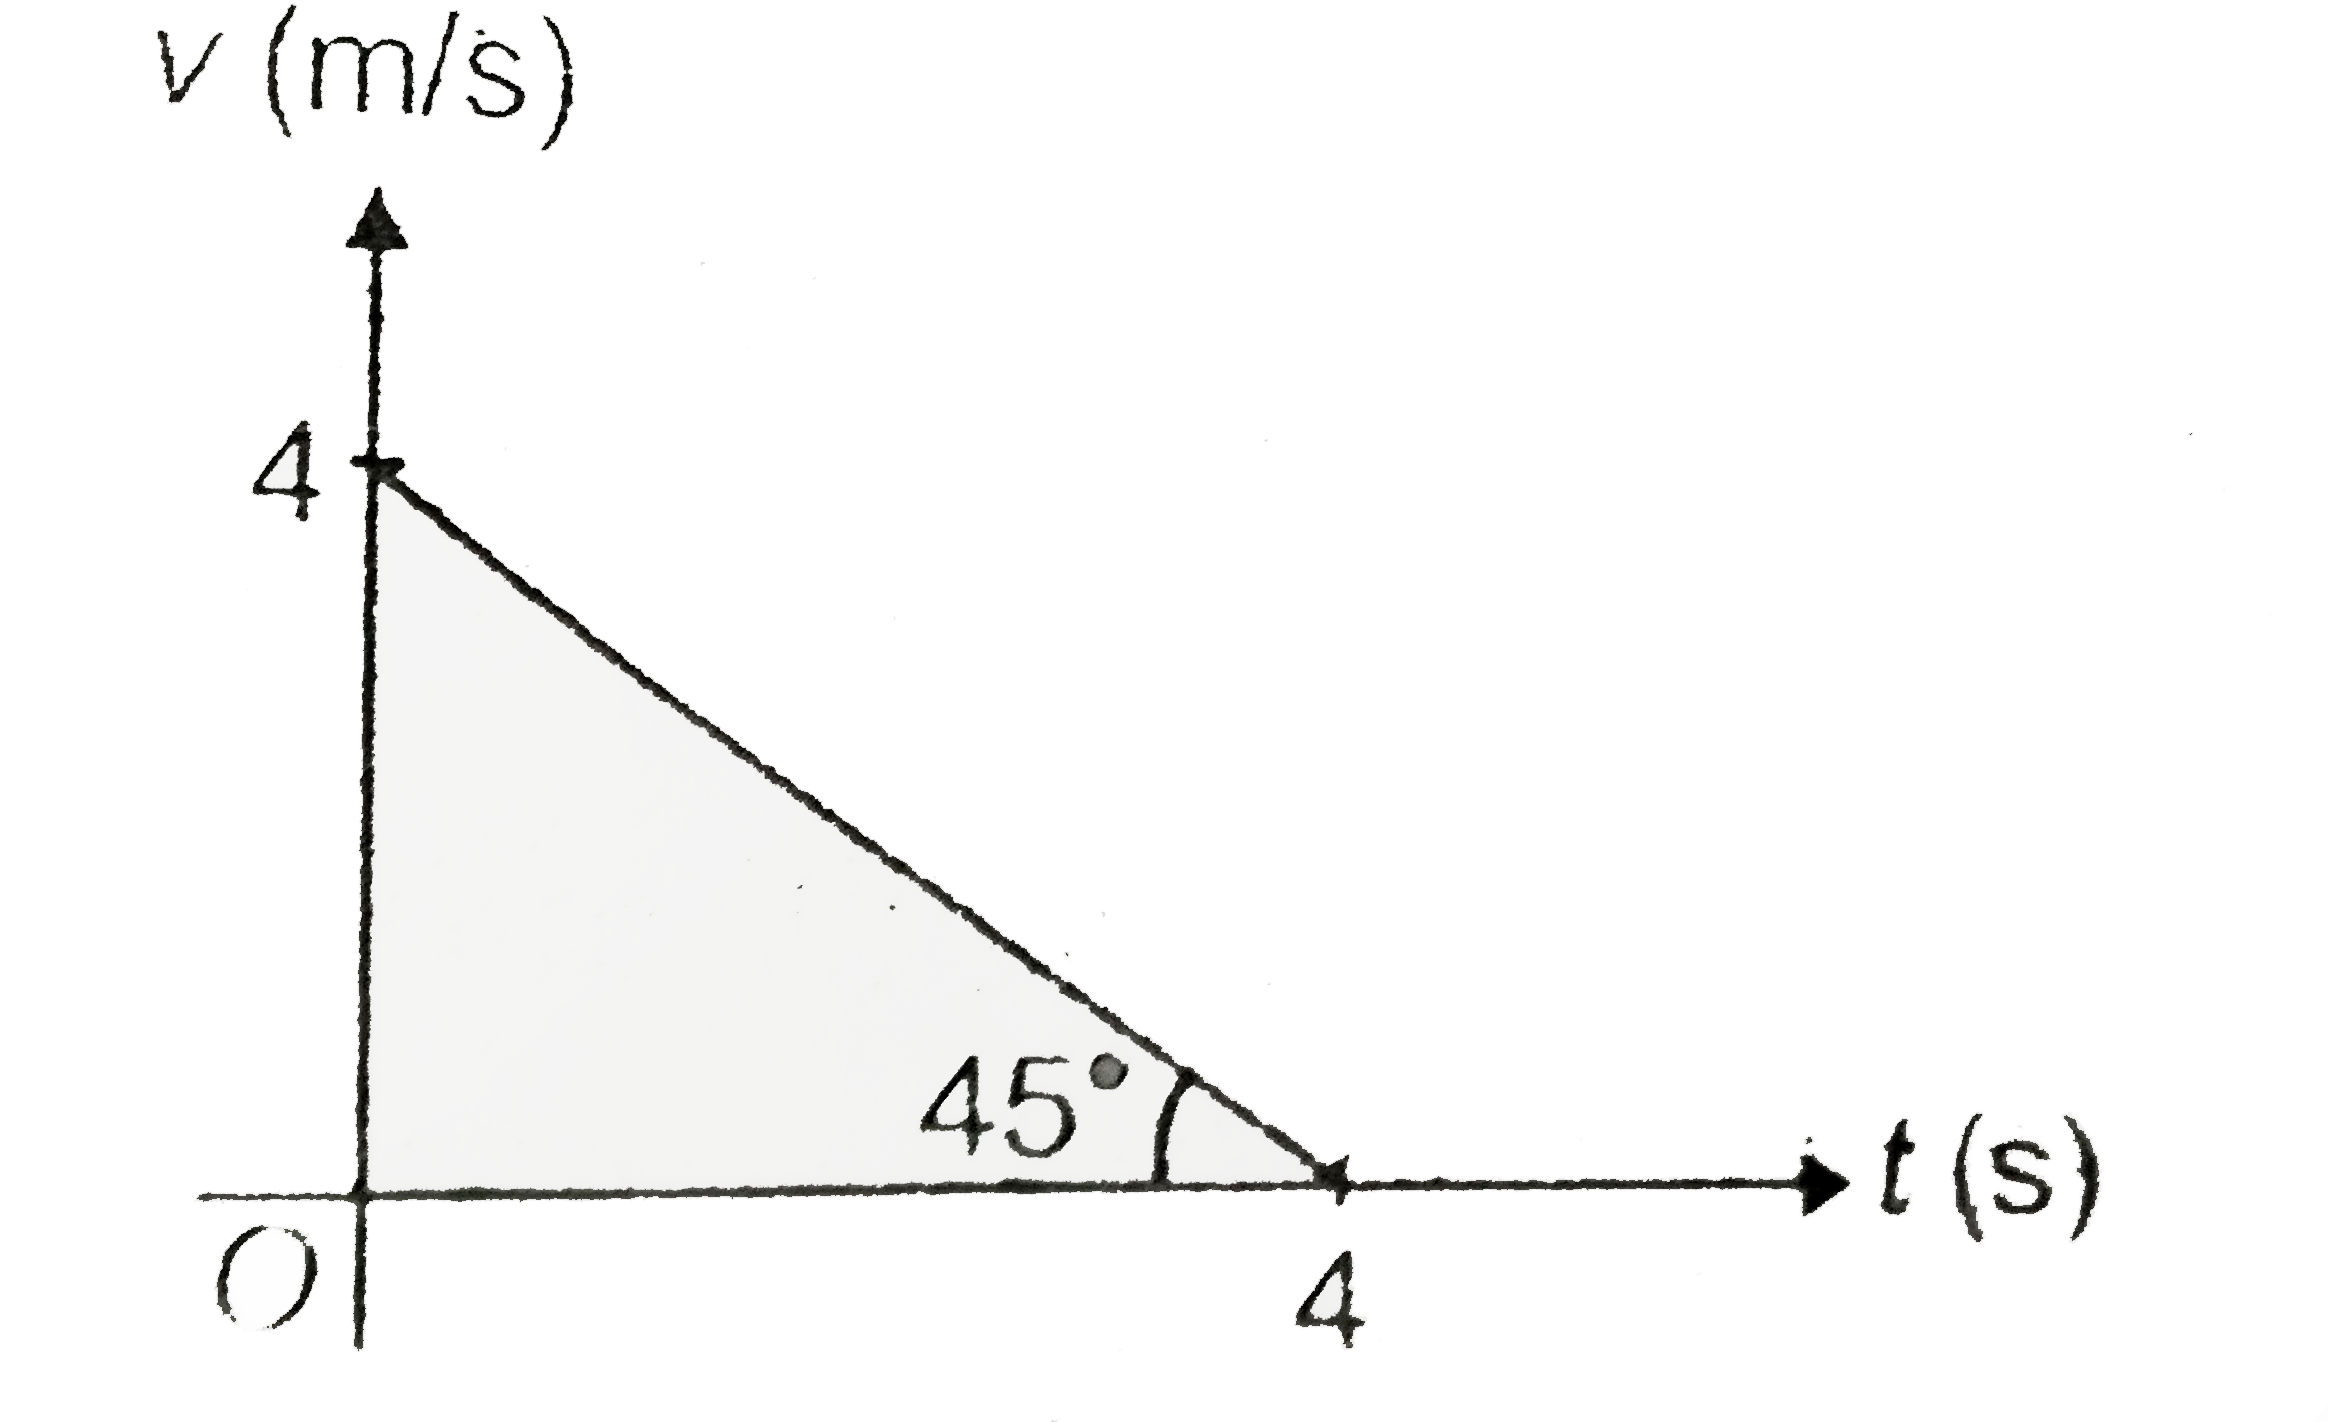
Draw the acceleration-time graph and position-time graph, given that at t = 0, particle is at origin.
View SolutionThe distance travelled by a pparticle in time 't' is given by S=(2.5m/s2)t2. Find the average speed of the particle during the time '0' to '5' sec.
View SolutionThe velocity time graph of a body moving in a straight line is shown. Find its (a) instantaneous velocity at t = 1.5 sec (b) average acceleration from t = 1.5 sec. to t = 2.5 sec (c) draw its acceleration time graph from t = 0 to t = 2.5 sec
View SolutionFind average speed in time interval t= 2 to t=10s
View SolutionIn the figure given below, the position–time graph of a particle of mass 0·1 kg is shown. The impulse at t=2sec is
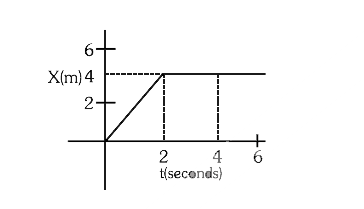
View SolutionPosition - time graph for a particle is shown in figure. Starting from t = 0, at what time t, the average velocity is zer?
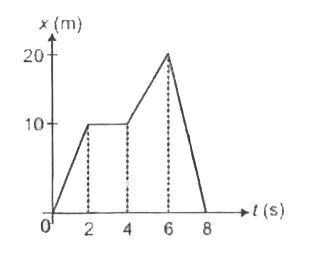
View SolutionThe position (x) - time (t) graph for a particle moving along a straight line is shown in figure. The average speed of particle in time interval t = 0 to t = 8 s is
View Solution
