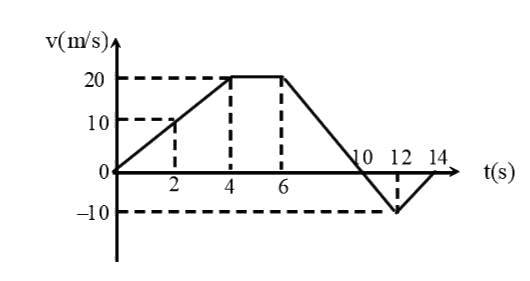
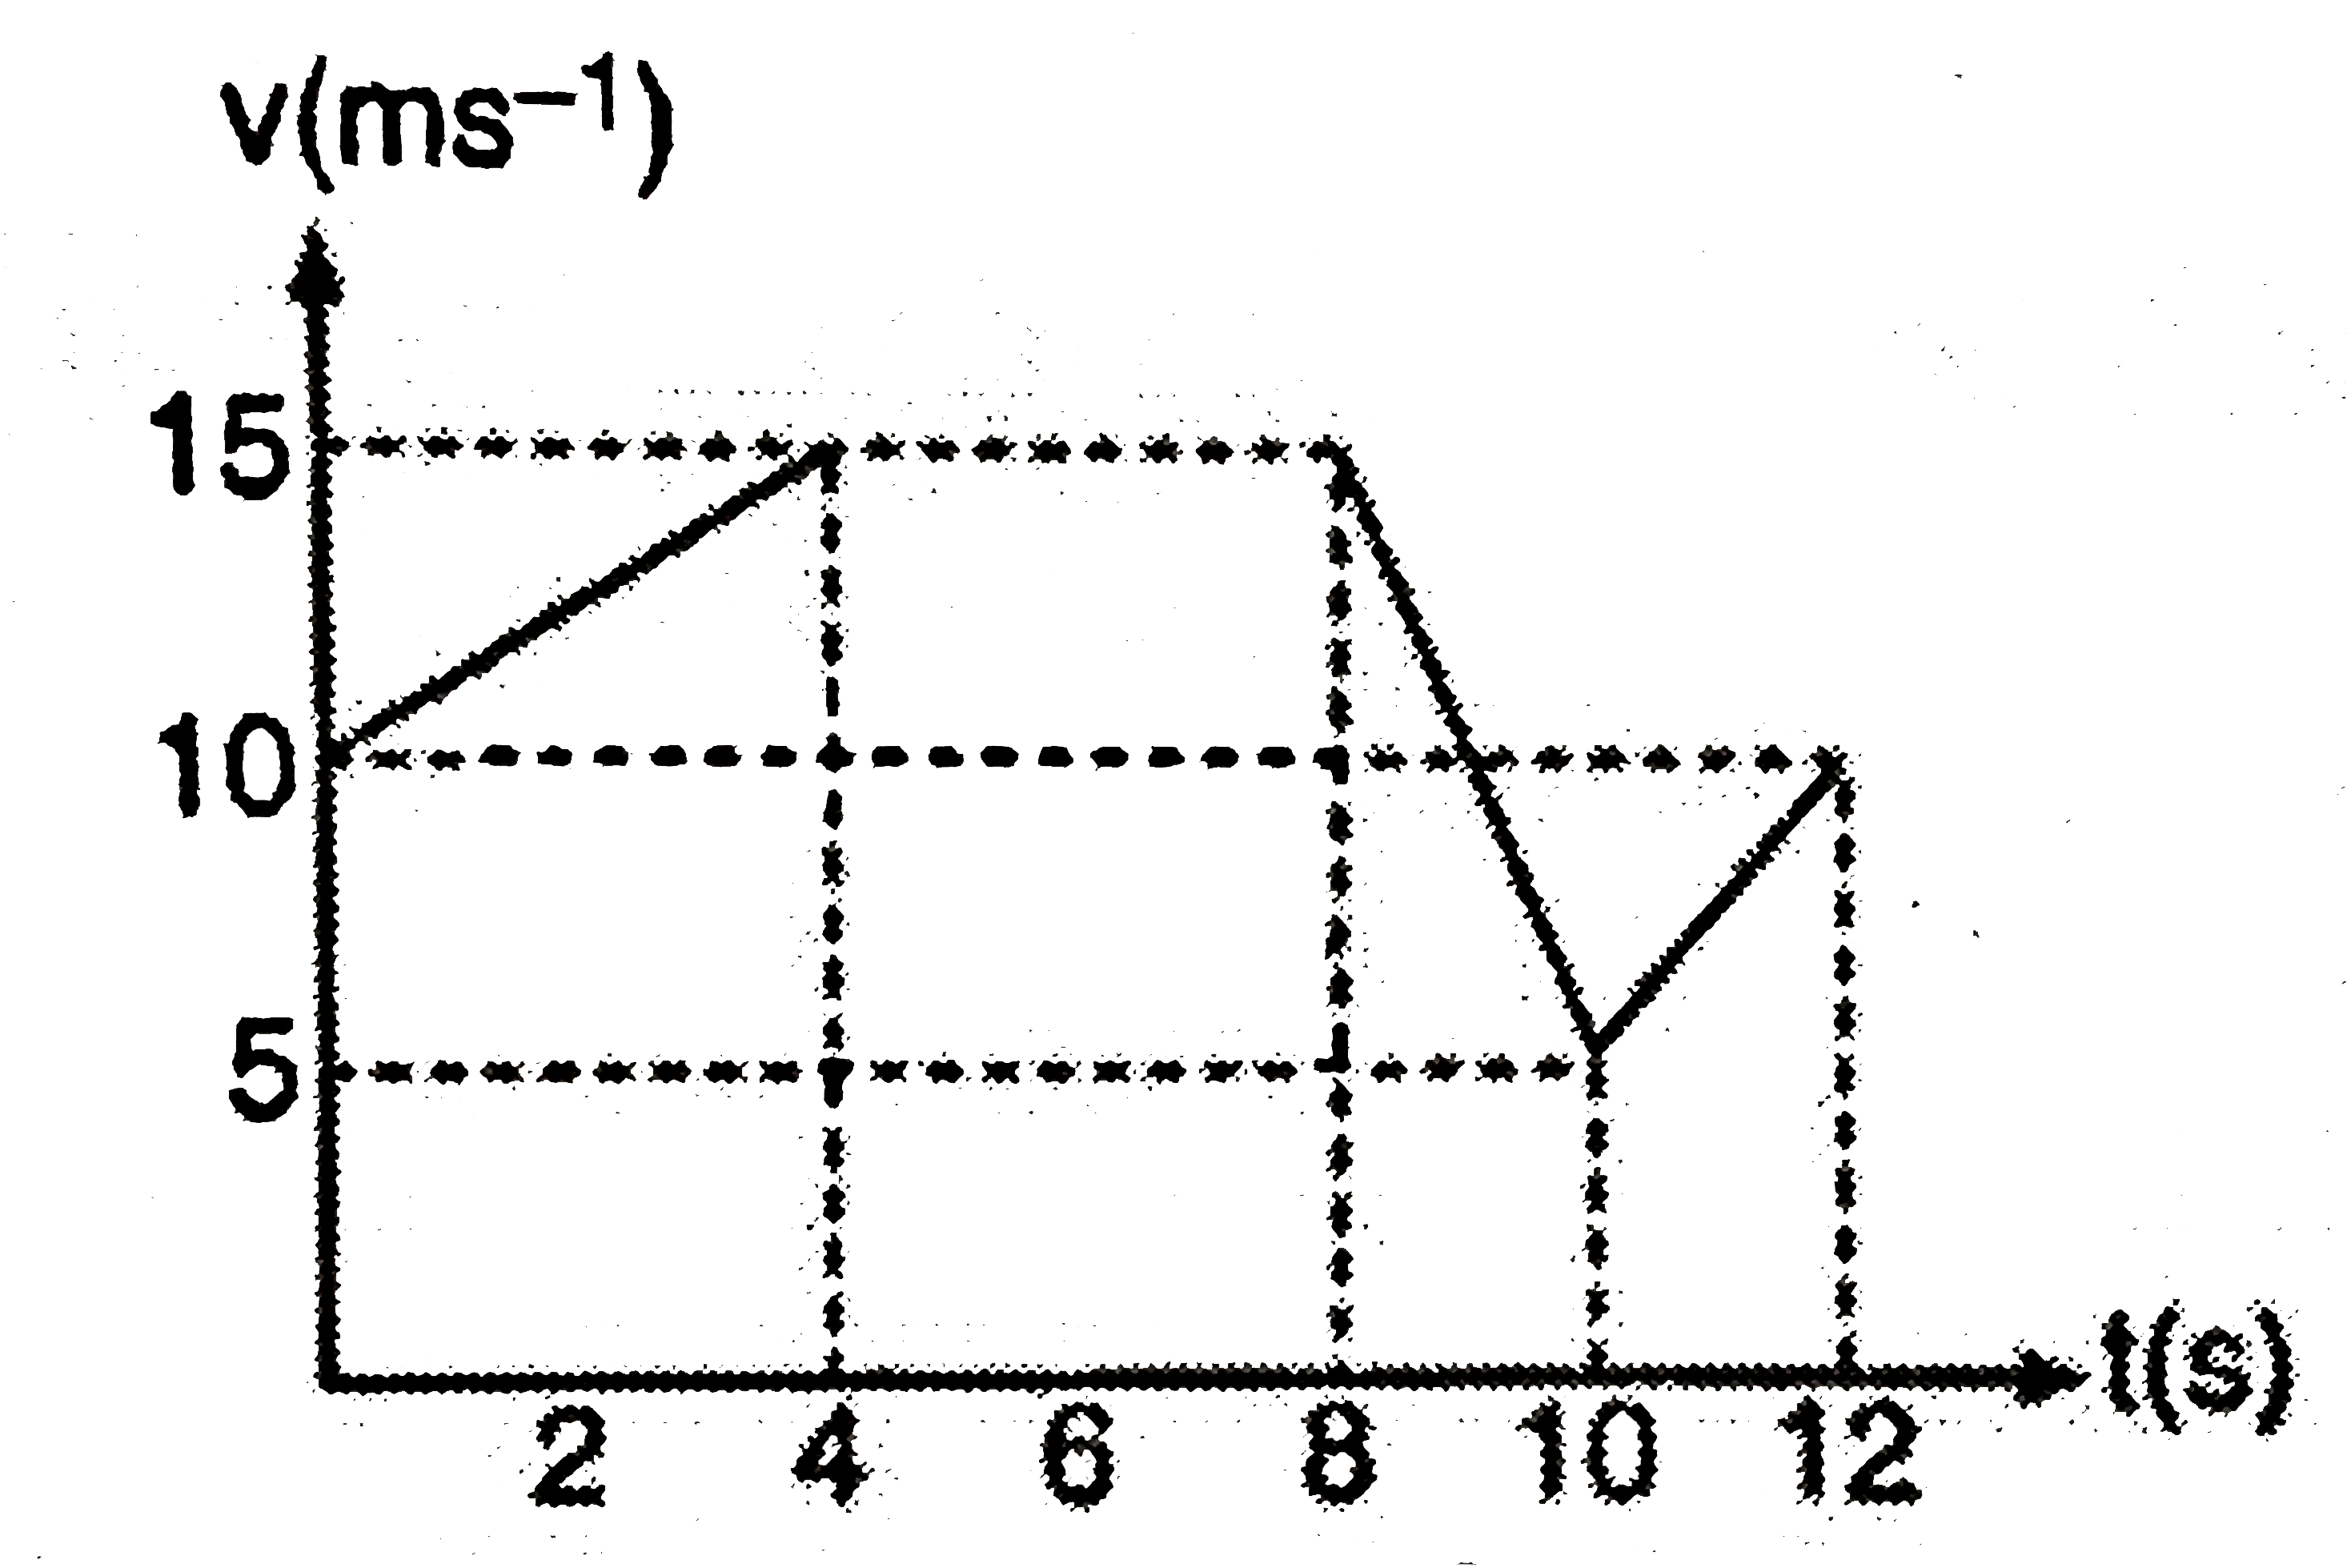
Velocity-time graph of a particle moving in a straight line is shown in figure. In the time interval from t=0 to t=14s, find
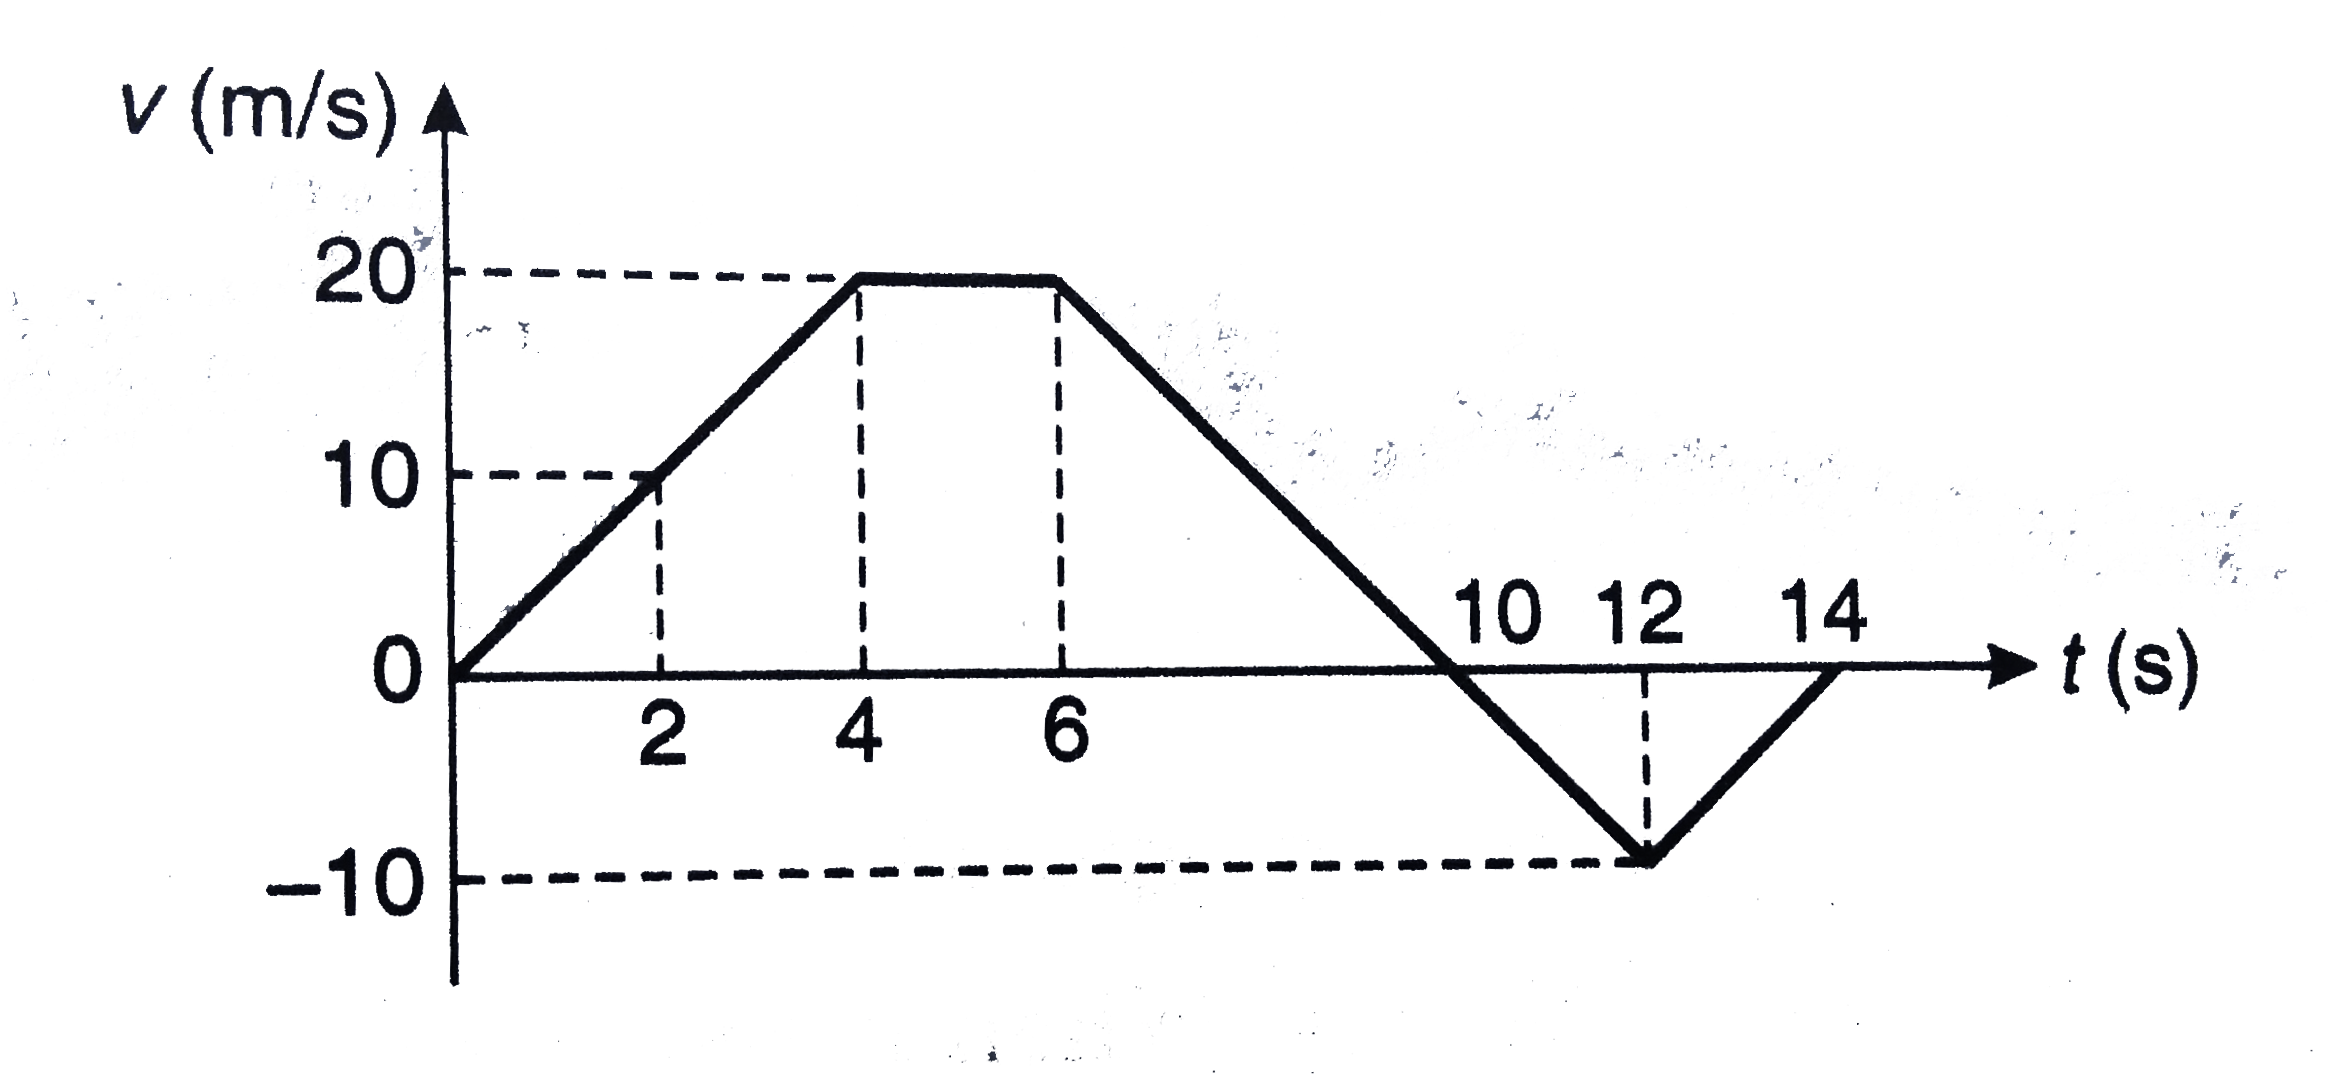
(a) average velocity and
(b) average speed of the particle.
The correct Answer is:A, B
Displacement s=net area of v-t graph
=40+40+40−20=100m
Distance d=|Total area|
=40+40+40+20=140m
(a) Average velocity=st=10014=507m/s
(b) Average speed=dt=14014=10m/s
Topper's Solved these Questions
- KINEMATICSBOOK - DC PANDEYCHAPTER - KINEMATICSEXERCISE - Subjective
51 Videos
- KINEMATICSBOOK - DC PANDEYCHAPTER - KINEMATICSEXERCISE - More Than One Correct
6 Videos
- KINEMATICSBOOK - DC PANDEYCHAPTER - KINEMATICSEXERCISE - Assertion And Reason
12 Videos
- GRAVITATIONBOOK - DC PANDEYCHAPTER - GRAVITATIONEXERCISE - (C) Chapter Exercises
45 Videos
- KINEMATICS 1BOOK - DC PANDEYCHAPTER - KINEMATICS 1EXERCISE - INTEGER_TYPE
15 Videos
Similar Questions
Knowledge Check
Velocity-time graph of a particle moving in a straight line is shown in figure. In the time interval from t = 0 to t = 14 s, find:
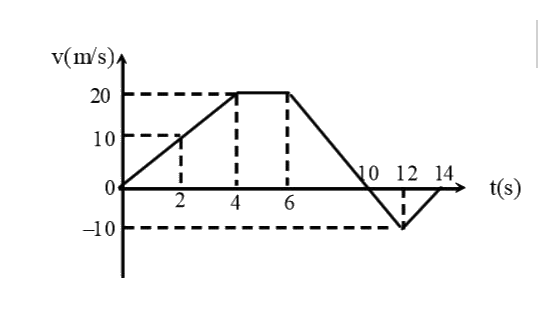
Q. average velocity andA(507)m/sB(257)m/sC(207)m/sD(157)m/sVelocity-time graph of a particle moving in a straight line is shown in figure. In the time interval from t = 0 to t = 14 s, find:
Q. average speed of the particleA20m/sB40m/sC10m/sD30m/sThe velocity-time plot for a particle moving on a straight line is shown in figure.
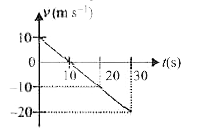 AThe particle has a constant acceleration.BThe particle has never tumed around.CThe particle has zero displacement.DThe average speed in the interval 0 to 10 s is the same as the average speed in the interval 10s to 20 s.
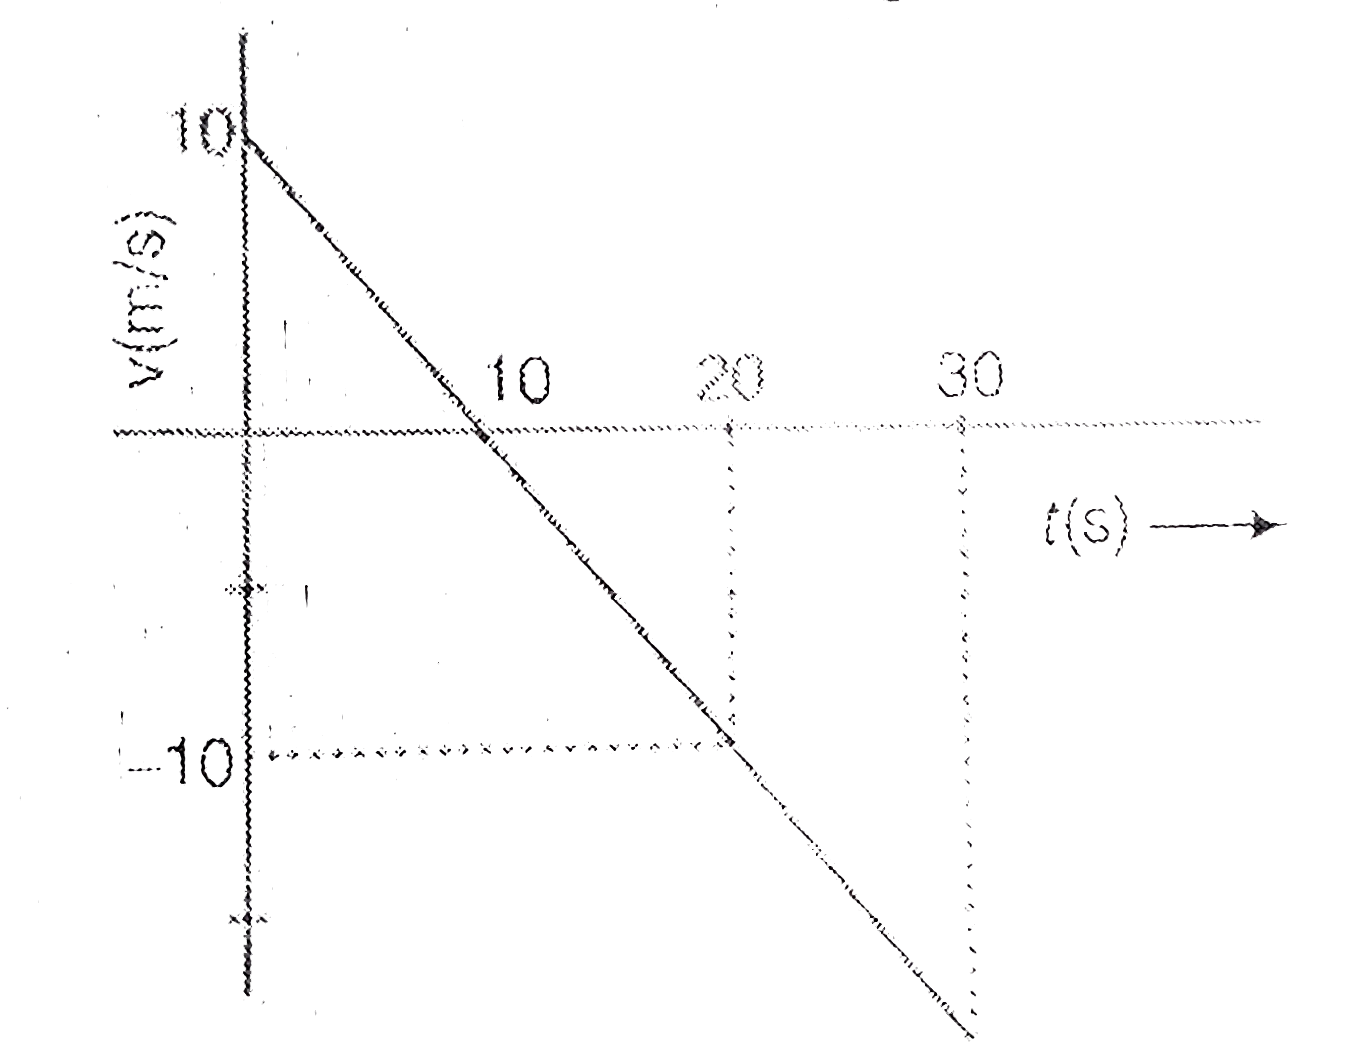
Velocity-time graph of a particle moving in a straight line is shown in figure. At time t=0,s=−10m. Plot corresponding a-t and s-t graphs.
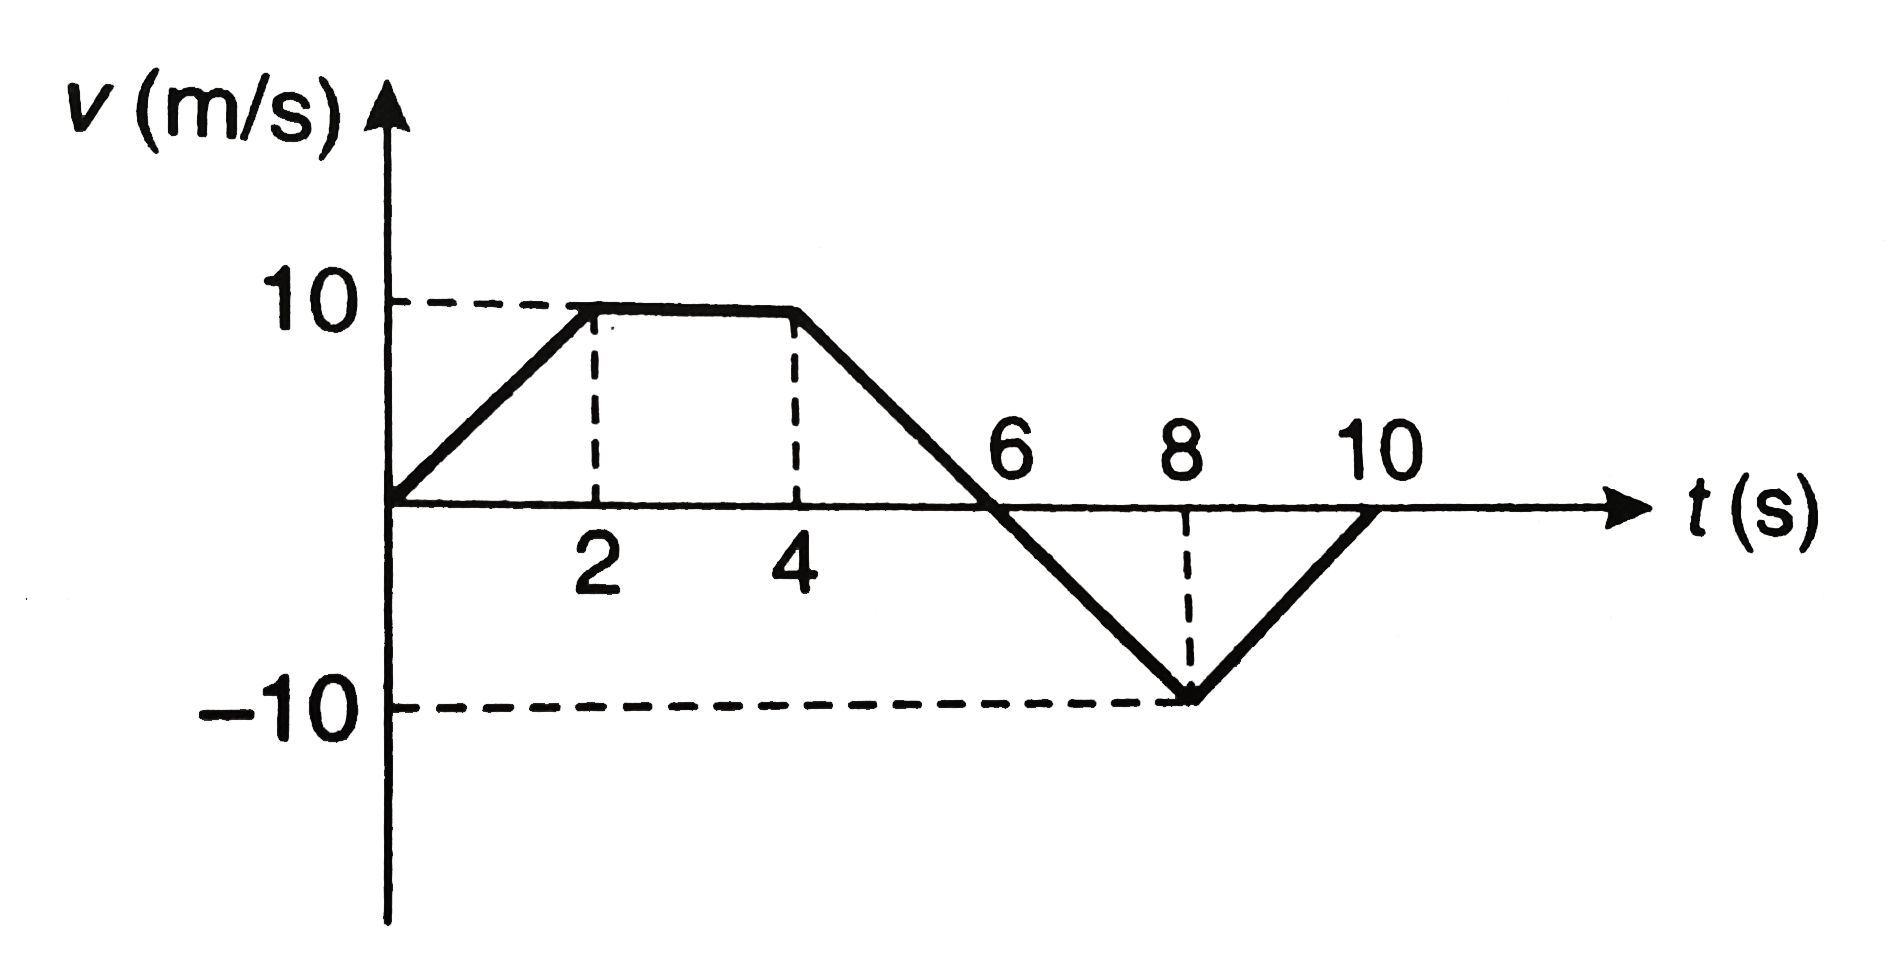
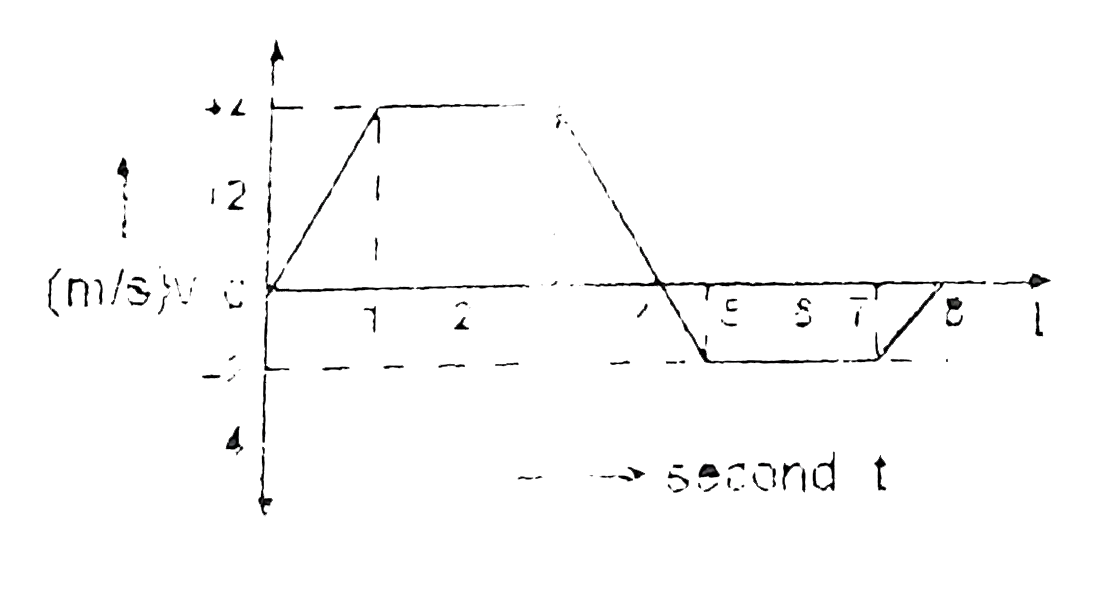
View SolutionThe velocity time graph of a particle moving along a straight line is shown in the figure. In the time interval from t=0 to t=8 second, answer the following three question.
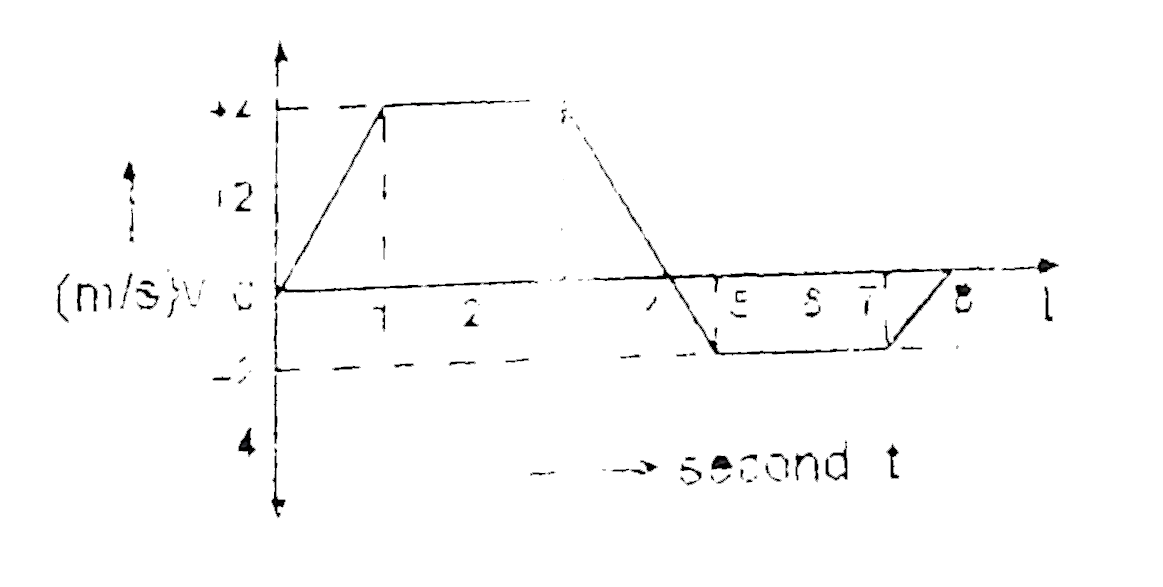
The distance travelled by the particle is :
View SolutionThe velocity -time (v−t) graph of a particle moving in a straight line is shown in figure. The acceleration of the particle at t=9 is:
View SolutionThe velocity time graph of a particle moving along a straight line is shown in the figure. In the time interval from t=0 to t=8 second, answer the following three question.
The value of magnitude of maximum velocitymagnitude of average velocity for the given time interval is :
View SolutionThe velocity time graph of a particle moving along a straight line is shown in the figure. In the time interval from t=0 to t=8 second, answer the following three question.
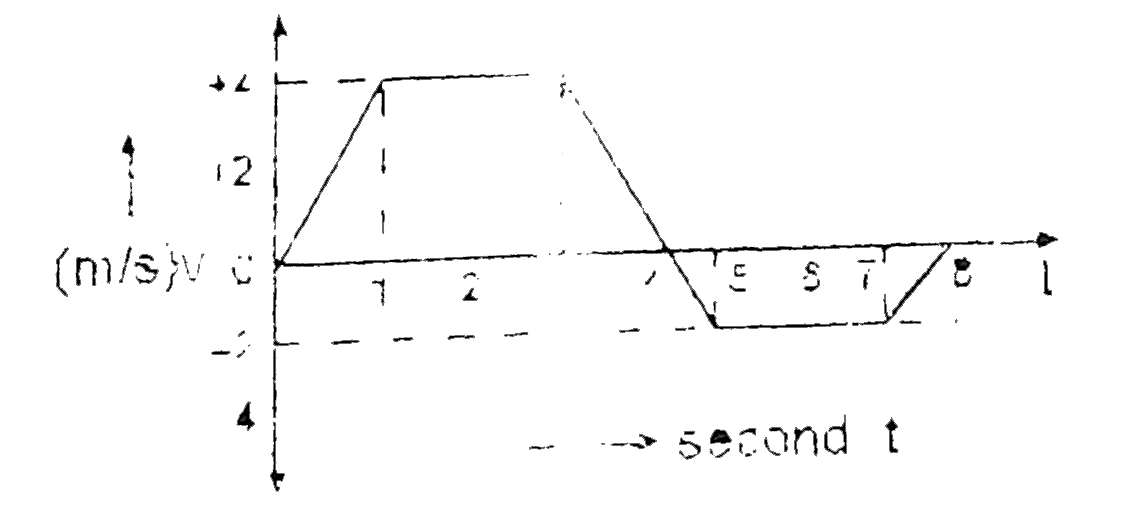
The value of maximum speedaverage speed for the given time interval is :
View Solution
