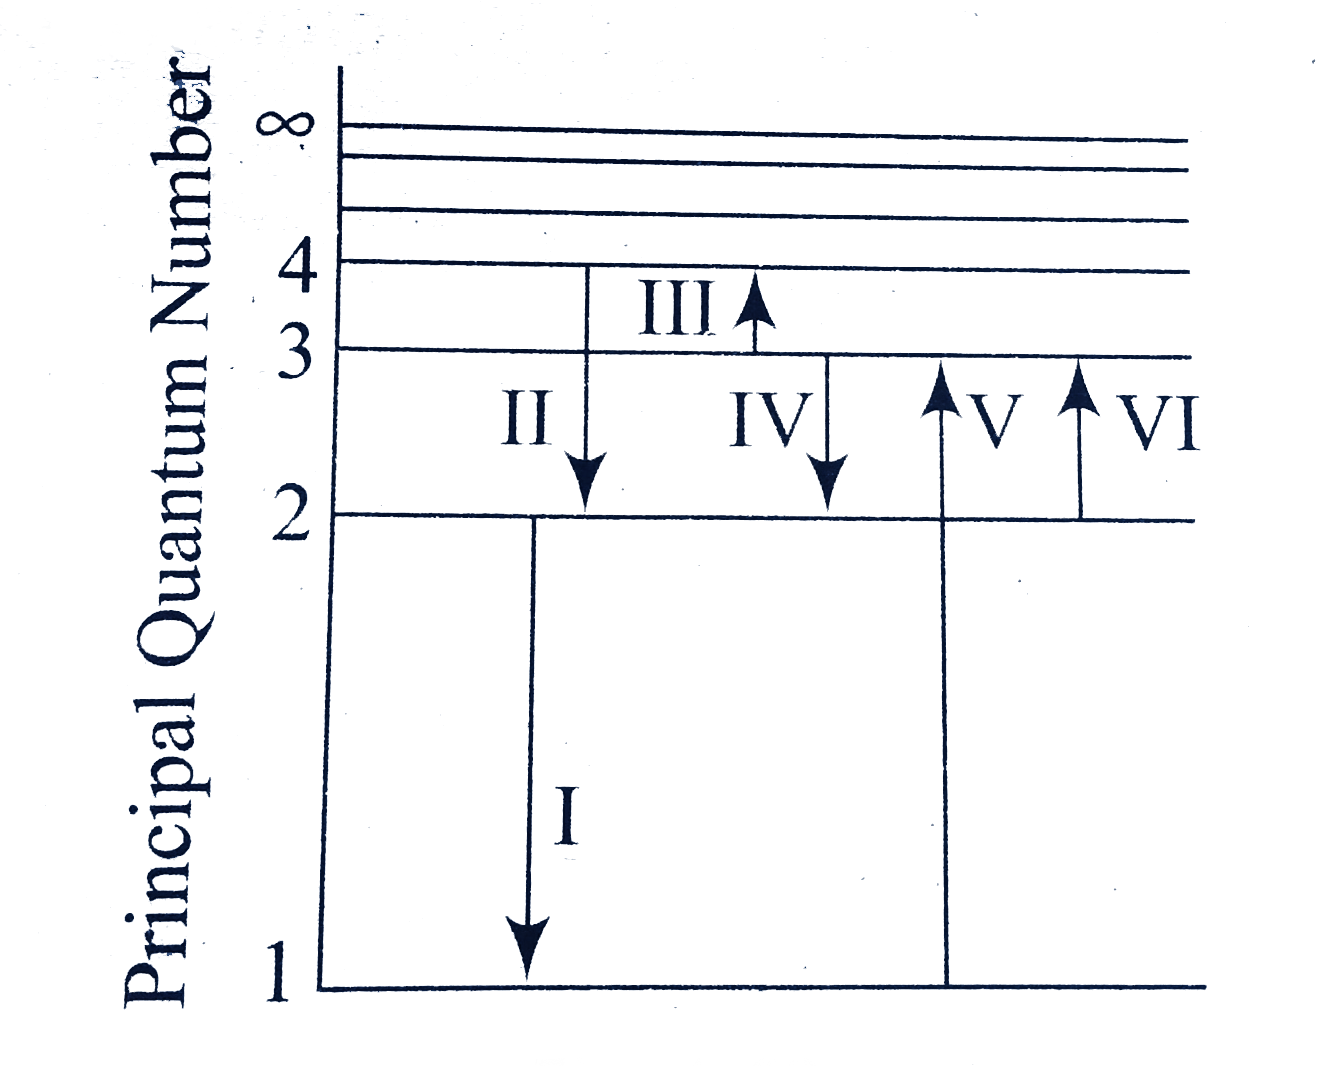
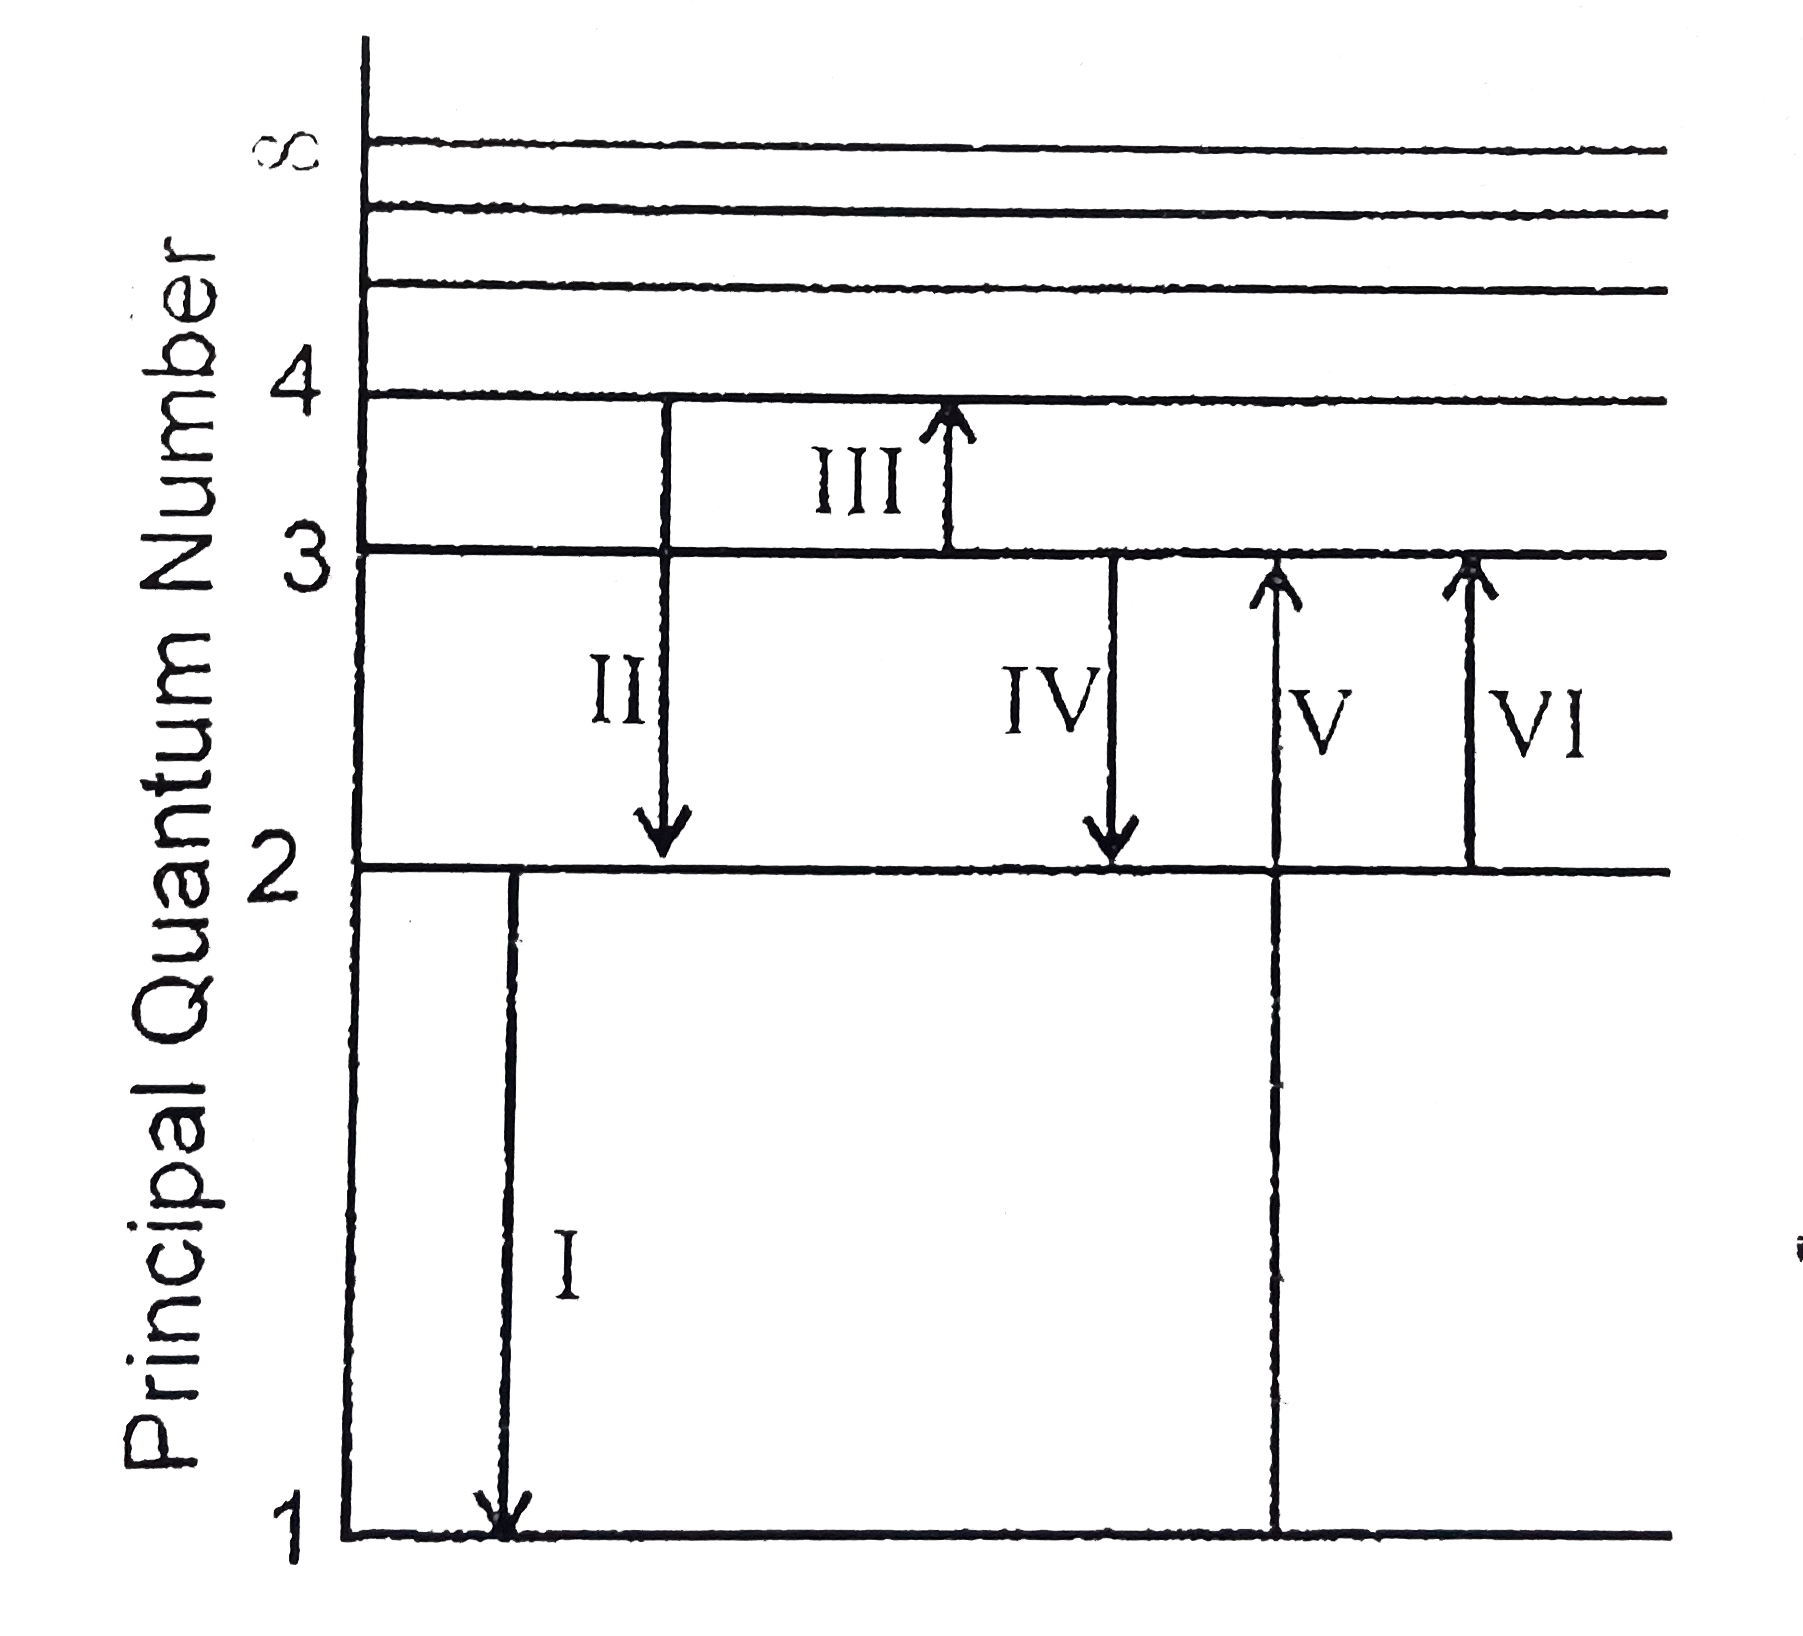
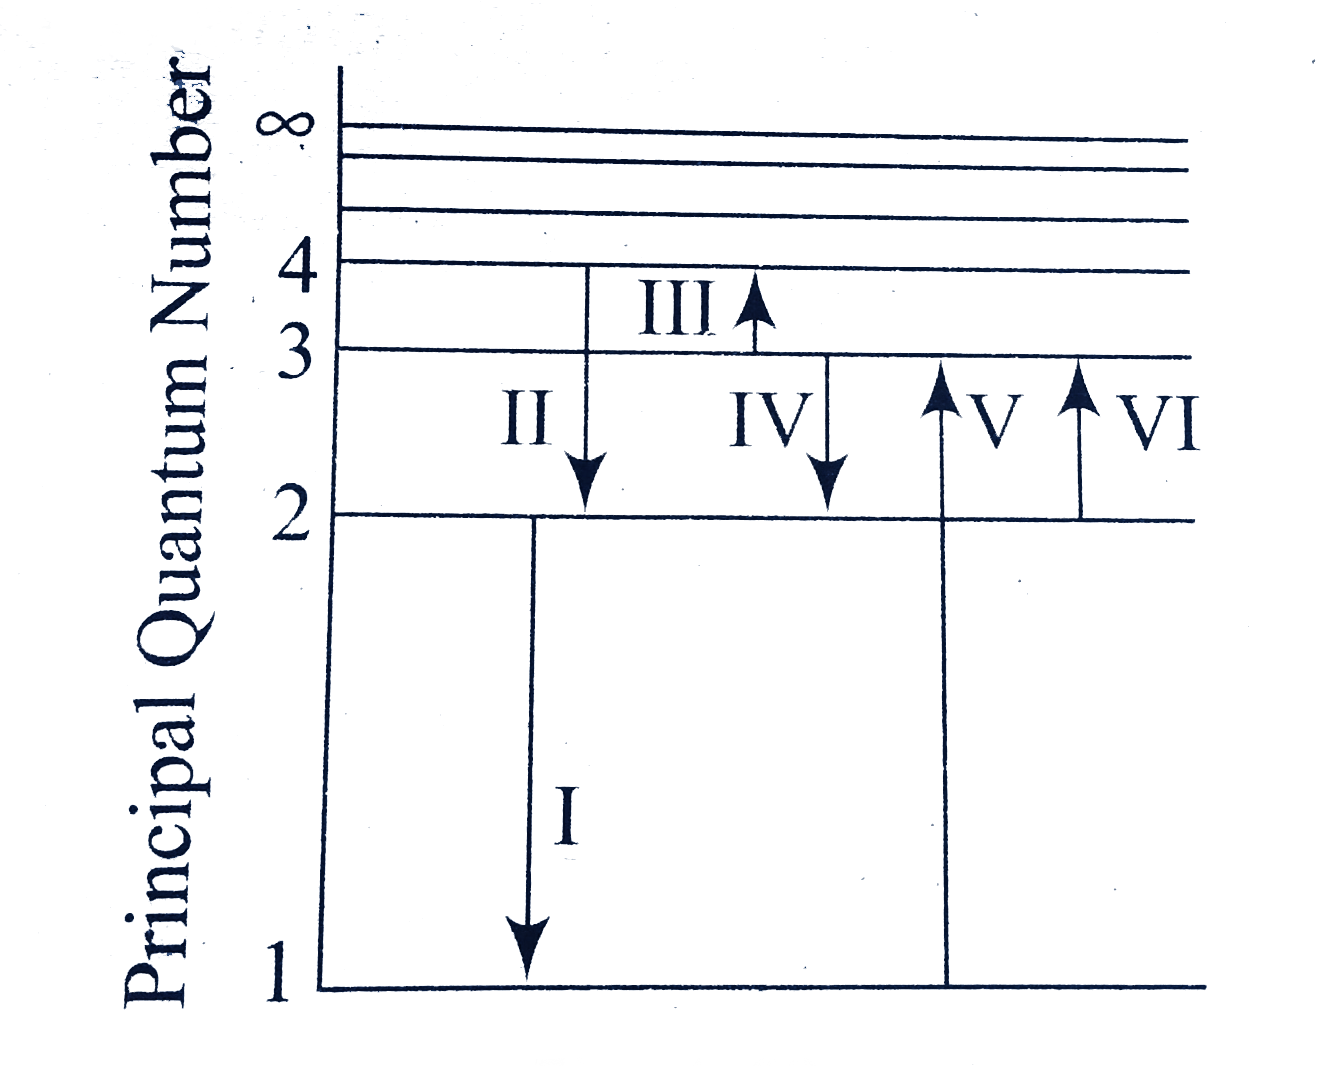
The figure shows an energy level diagram for the hydrogen atom. Several transitions are marked as I,II,III ,______, the diagram is only indicative and not to scale.
_E01_150_Q01.png) .
.
Which transition involves the longest wavelength line in the visible portion of the hydrogen spectrumSolution in Gujrati
II
III
VI
IV
The correct Answer is:D
For longest wavelength, energy difference should be minimum. So in visible portion of hydrogen atom, minimum energy is in transition VI & IV.
Topper's Solved these Questions
- SIMPLE HARMONIC MOTIONBOOK - ALLEN CHAPTER - SIMPLE HARMONIC MOTIONEXERCISE - Exercise - 28
2 Videos
- SIMPLE HARMONIC MOTIONBOOK - ALLEN CHAPTER - SIMPLE HARMONIC MOTIONEXERCISE - Exercise - 29
2 Videos
- SIMPLE HARMONIC MOTIONBOOK - ALLEN CHAPTER - SIMPLE HARMONIC MOTIONEXERCISE - Exercise - 26
2 Videos
- RACEBOOK - ALLEN CHAPTER - RACEEXERCISE - Basic Maths (Wave Motion & Dopplers Effect) (Stationary waves & doppler effect, beats)
25 Videos
- TEST PAPERBOOK - ALLEN CHAPTER - TEST PAPEREXERCISE - PHYSICS
4 Videos
Similar Questions
In a Coolidege tube experiment, the minimum wavelength of the continuouse X-ray spectrum is equal to 66.3 om . Then
View SolutionThe potential difference applied to an X-ray tube is increased. As a result, in the emitted radiation,
View SolutionA neutron collies head-on with a stationary hydrogen atom in ground state. Which of the following statements is/are correct ?
View SolutionThe frequency of a radar is 780 MHz. After getting reflected from an approaching aeroplane, the apparent frequency is more than the actual frequency by 2.6 kHz. The aeroplane has a speed of
View SolutionChoose the correct statement:
View SolutionPertain to the following statement and figure The figure above shown level diagram of the hydrogen atom. Serveral transition are market as I, II, III, … The diagram is only indicative and not to scale. In which transition ia a Balmer series photon absorbed?
View SolutionPertain to the following statement and figure

The figure above shown level diagram of the hydrogen atom. Serveral transition are market as I, II, III, … The diagram is only indicative and not to scale.
The wavelength of the radiation involved in transition II is:
View SolutionPertain to the following statement and figure The figure above shown level diagram of the hydrogen atom. Serveral transition are market as I, II, III, … The diagram is only indicative and not to scale. Which transition will occur when a hydrogen atom is irradiated with radiation of wavelength 103 nm ?
View SolutionThe figure shows an energy level diagram for the hydrogen atom. Several transitions are marked as I, II, III,_____. The diagram is only indicative and not be scale. In which transitions is a Balmer photn absorbed?
View SolutionThe figure shows an energy level diagram for the hydrogen atom. Several transitions are marked as I, II, III,_____. The diagram is only indicative and not be scale.

Which transition will occur when a hydrogen atom is irradiated with radiation of wavelength 103nm.
View SolutionThe figure shows an energy level diagram for the hydrogen atom. Several transition are marked as I, II, III, …………. The diagram is only indicative and not to scale.

View Solutionहाइड्रोजन परमाणु के लिये ऊर्जा-स्तर आरेख खींचिए। इसमें बामर श्रेणी की प्रथम रेखा के संक्रमण को दिखाइये तथा इसकी तरंगदैर्घ्य की गणना भी कीजिए। (i) इस रेखा को क्या कहते हैं? (ii) यह विधुतचुम्बकीय स्पेक्ट्रम के किस क्षेत्र में पायी जाती है?
View Solutionहाइड्रोजन परमाणु के लिए ऊर्जा-स्तर आरेख खींचिए। इसमें बॉमर श्रेणी की प्रथम रेखा के संक्रमण को दिखाइये तथा इसकी तरंगदैर्ध्य की गणना भी कीजिये। (i) इस रेखा को क्या कहते हैं? (ii) यह विद्युत चुम्बकीय स्पेक्ट्रम के किस क्षेत्र में पायी जाती है?
View SolutionDraw energy level diagram for hydrogen atom and show the various line spectra originating due to transition between energy levels.
View SolutionThe figure shows an energy level diagram for the hydrogen atom. Several trasitions are marked as I,II,III, …… The diagram is only indicative and not to scale. Then,
(##MTG_WB_JEE_CHE_MTP_01_E01_040_Q01.png" width="80%">
View SolutionPertain to the following statement and figure

The figure above shown level diagram of the hydrogen atom. Serveral transition are market as I, II, III, … The diagram is only indicative and not to scale.
In which transition ia a Balmer series photon absorbed?
View Solution
