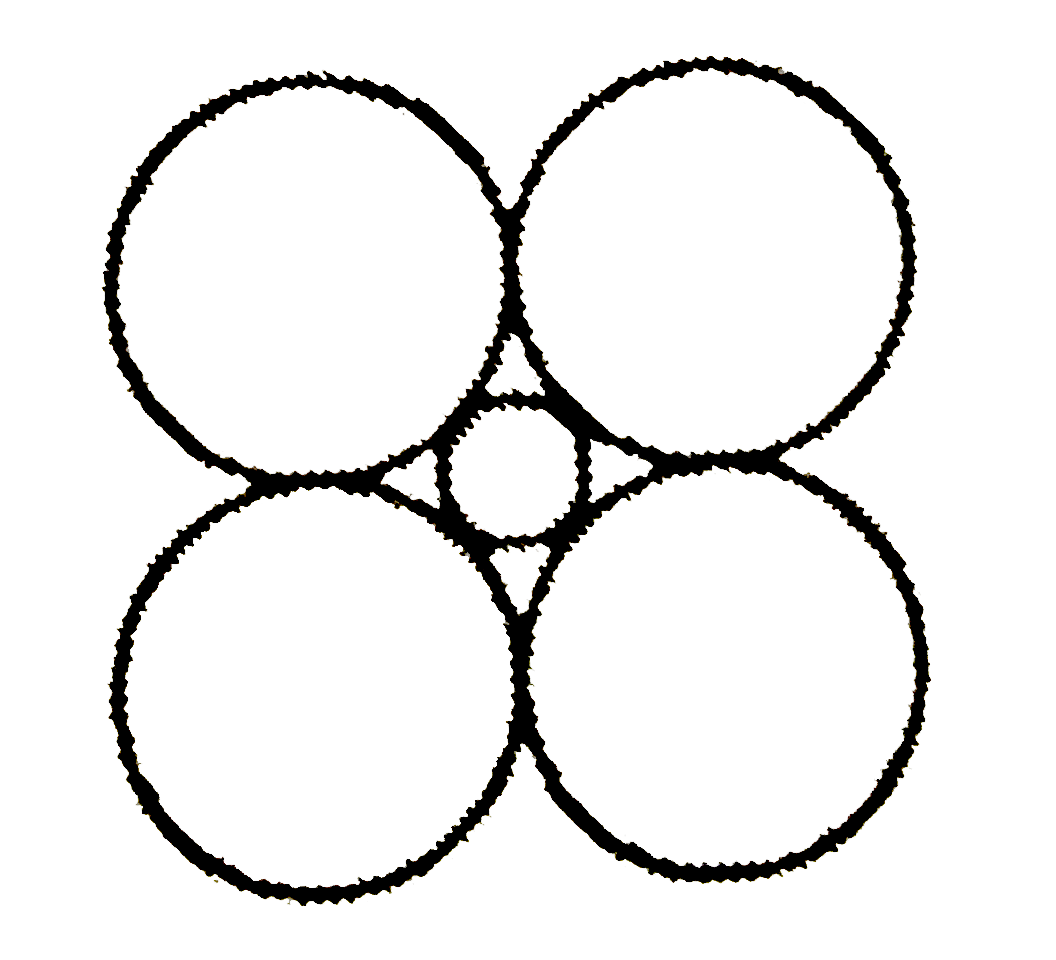
In the figure, when the outer circles all have radii 'r', then the radius of the inner circle will be
 Solution in Gujrati
√2r
(√2−1)r
1√2r
2(√2−1)r
The correct Answer is:B
Step by step video & image solution for In the figure, when the outer circles all have radii 'r', then the radius of the inner circle will be by Maths experts to help you in doubts & scoring excellent marks in Class 12 exams.
Updated on:21/07/2023Topper's Solved these Questions
- RACEBook:ALLEN Chapter:RACEExercise:RACE 5
Explore 10 Videos
- RACEBook:ALLEN Chapter:RACEExercise:RACE 6
Explore 7 Videos
- RACEBook:ALLEN Chapter:RACEExercise:RACE 3
Explore 10 Videos
- LOGARITHMSBook:ALLEN Chapter:LOGARITHMSExercise:All Questions
Explore 103 Videos
- SEQUENCE AND PROGRESSIONBook:ALLEN Chapter:SEQUENCE AND PROGRESSIONExercise:Exercise (JA)
Explore 10 Videos
Similar Questions
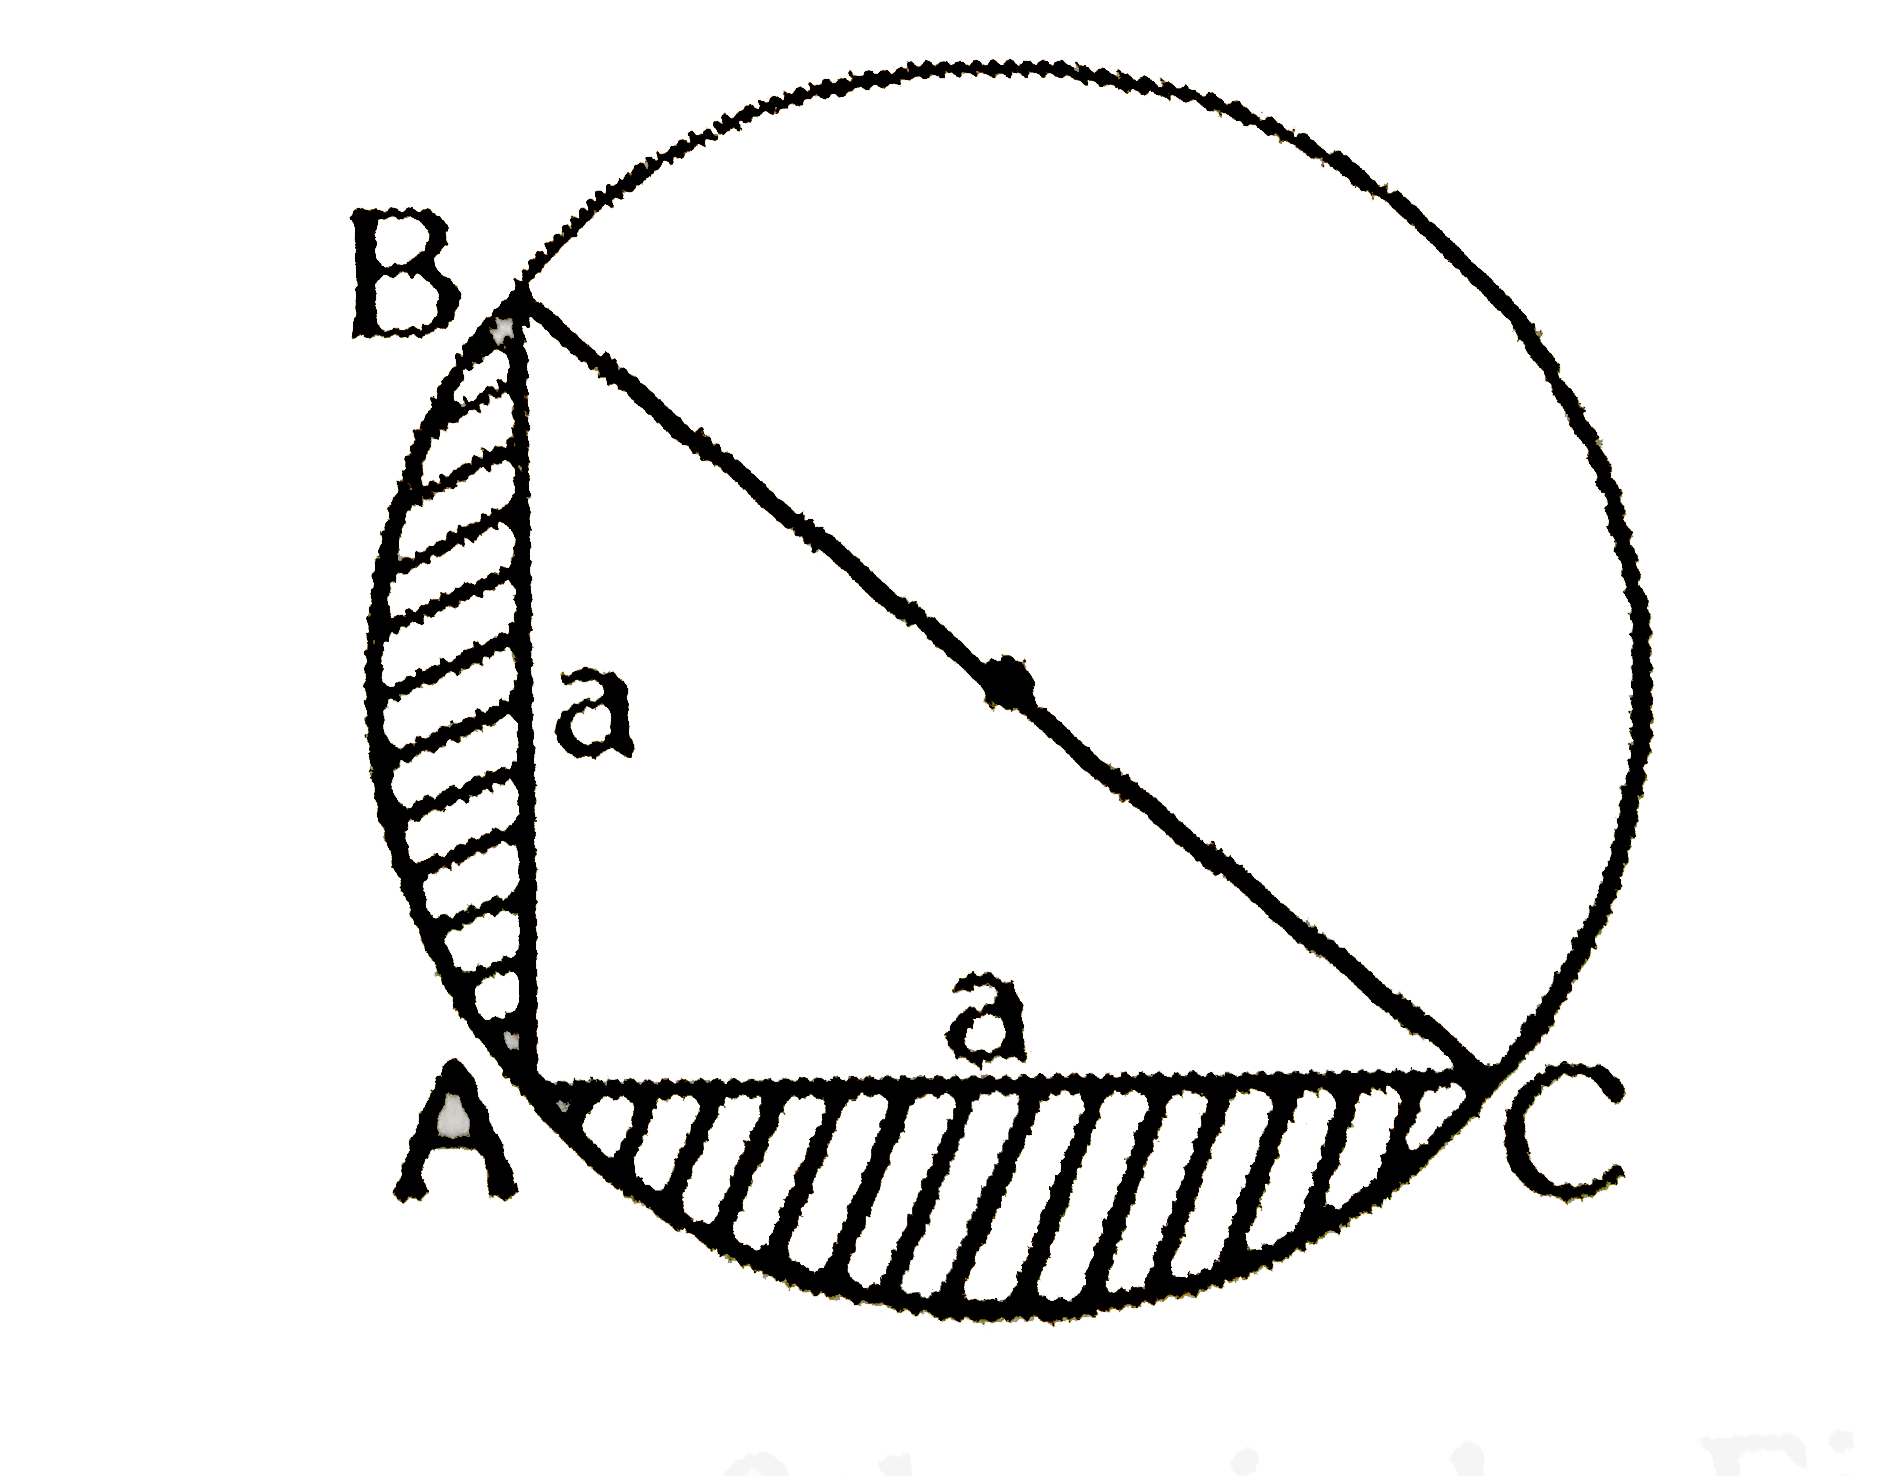
If BC passes through centre of the circle, then the area of the shaded region in the given figure is:

View SolutionIf M is even prime number,N is least prime number of two digits & P is greatest prime number of two digits, then P+NM is dividible by-
View SolutionValue of (x4+x2+1)(x2−x+1)−(x+1)2 is
View SolutionThe value of N satisfying (log)a[1+(log)b {1+(log)c(1+(log)pN)}]=0 is-
a.4 b. 3 c.2 d. 1
View SolutionThe minimum value of the sum of real numbers a−5,a−4,3a−3,1,a8 and a10 with a>0 is
View SolutionHow many lines of symmetry does the above figure have ?
View SolutionDetermine the point of symmetry of a regular hexagon.
View SolutionDtermine the images of the following figure about the given line :
View SolutionMatch the following Column A to Column B

View SolutionMatch the following Column A to Column B

View SolutionMatch the following Column A to Column B

View SolutionFind the area of the figure given below.

View SolutionThe area of the shaded part in the figure given below is ______.

View SolutionThe inequation represented by the graph given below is :
View SolutionThe inequation that best describes the graph given below is _________
View SolutionThe inequation that best describes the following graph is _________
View Solution