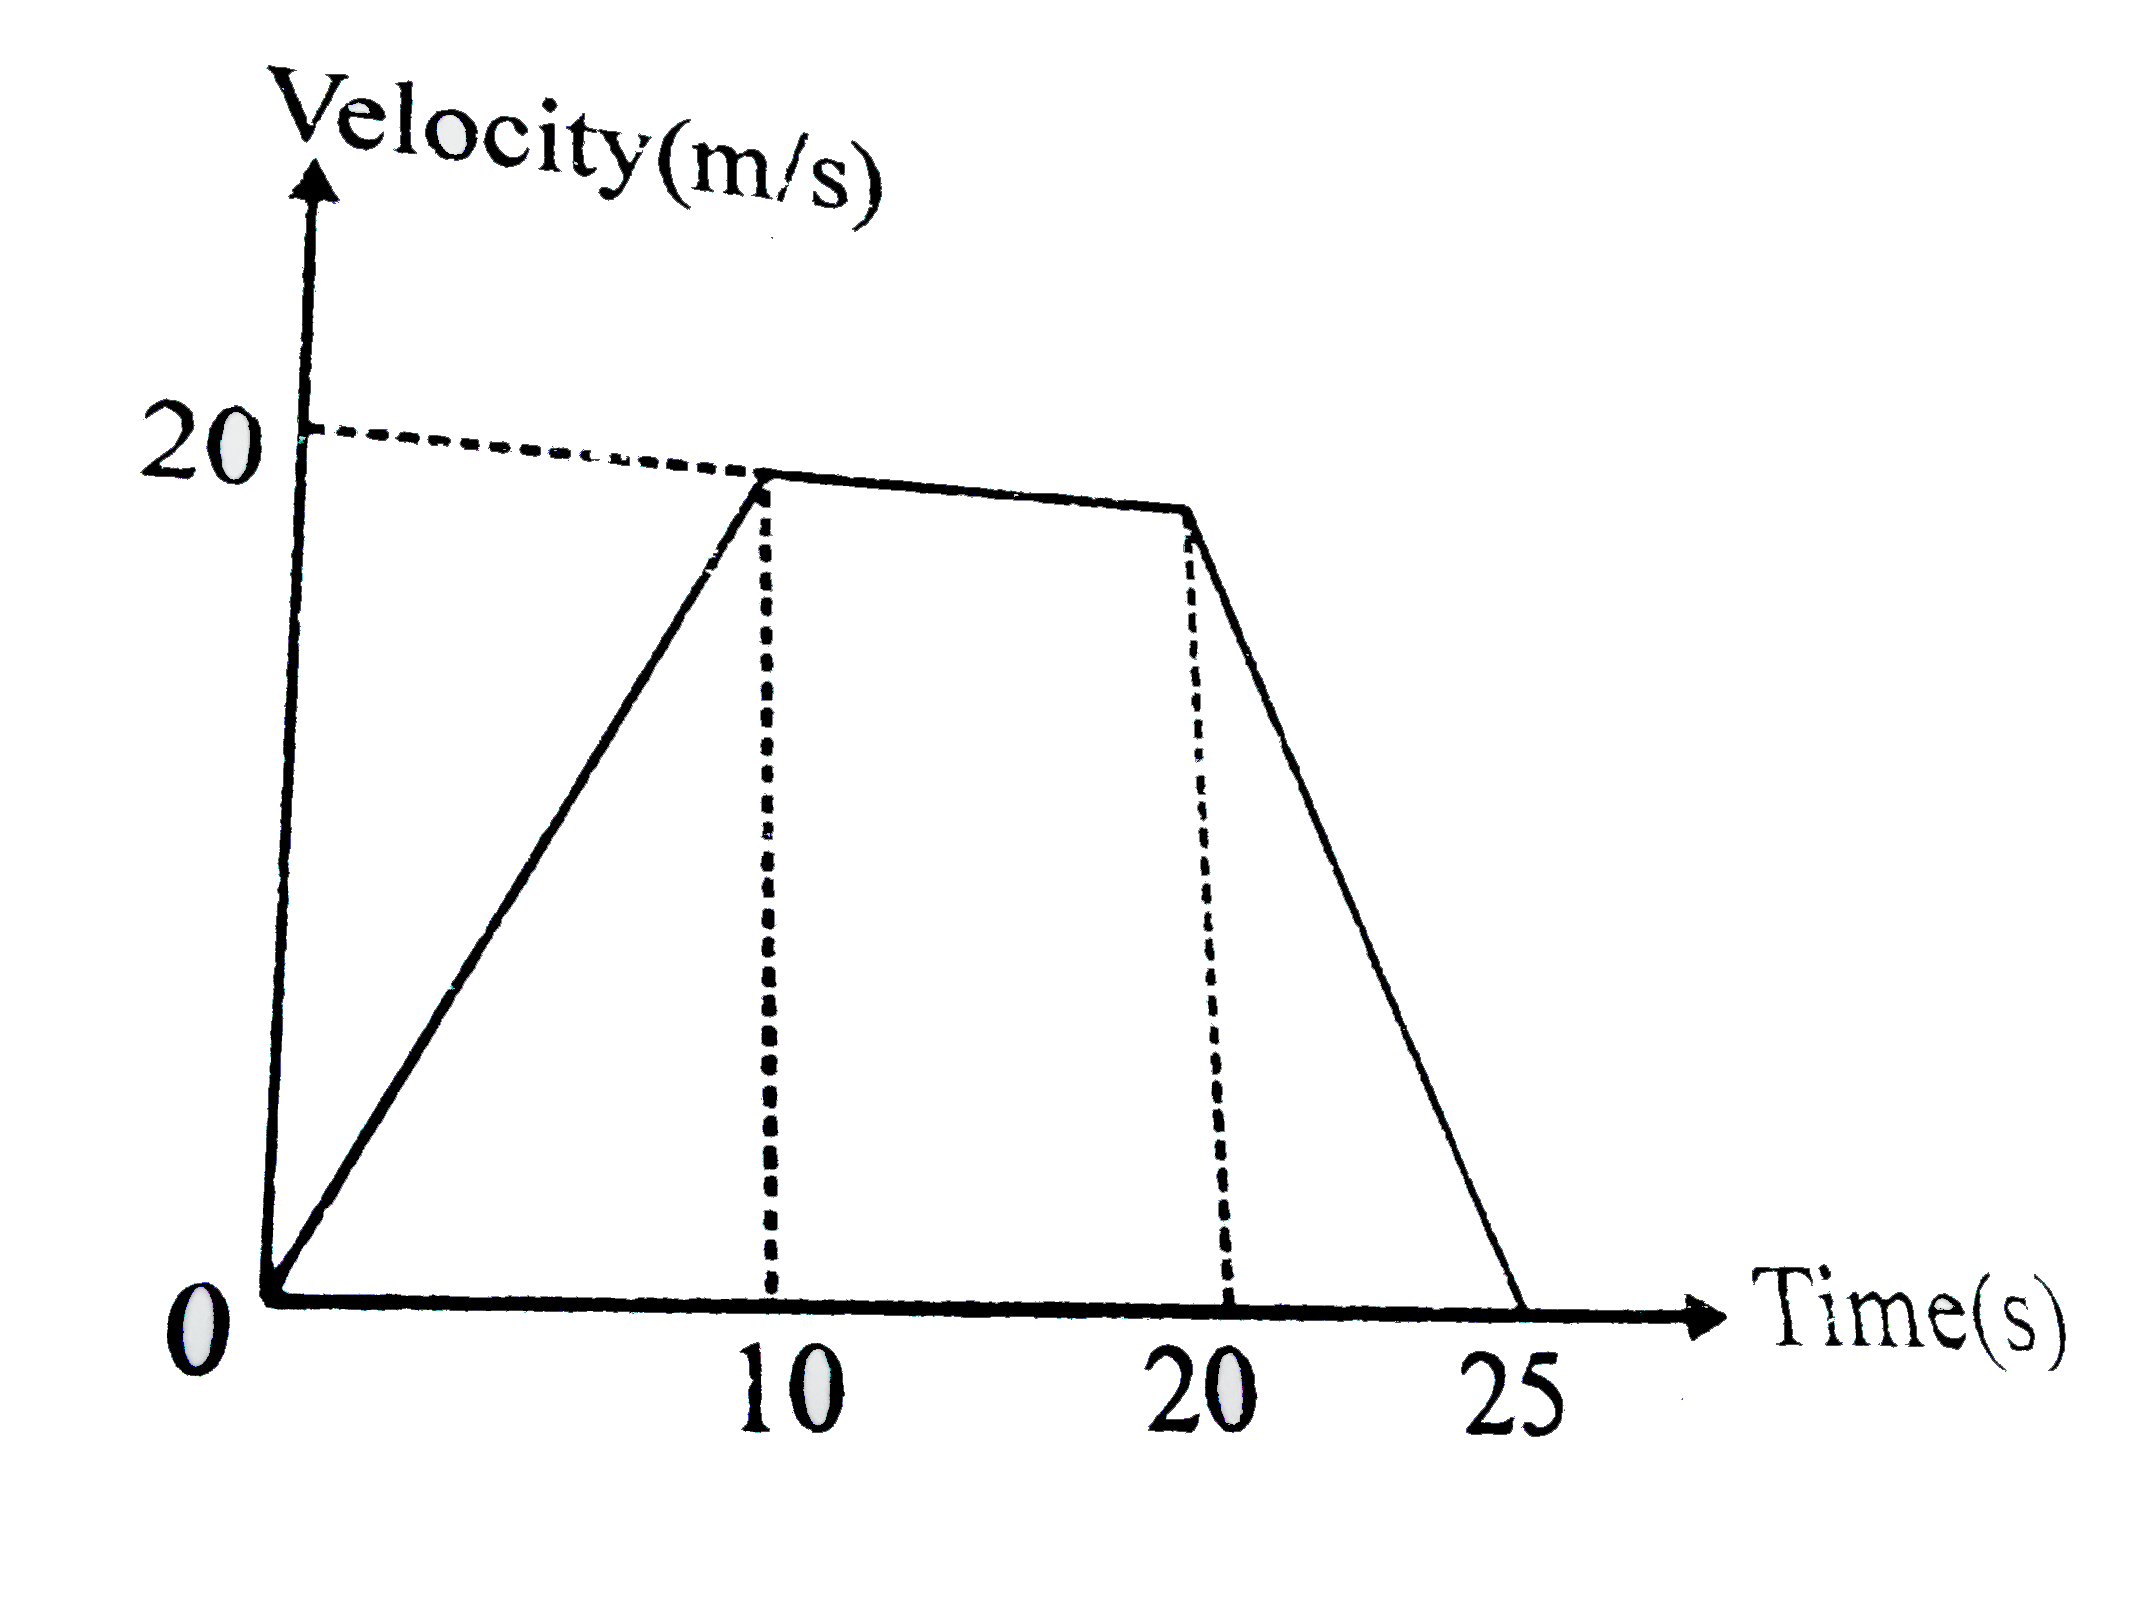
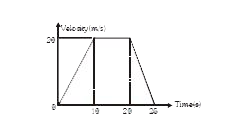
The velocity-time graph of a car moving along a straight road is shown in figure. The average velocity of the car in first 25 seconds is
 Solution in Gujrati
(i) dydx=2x2−1−6(1)=2x−6
(ii) dydx=5x5−1+2ex=5x4+2ex
(iii) dydx=4(1x)+(−sinx)=4x−sinx
Topper's Solved these Questions
- BASIC MATHSBOOK - ALLEN CHAPTER - BASIC MATHSEXERCISE - Exercise-02
53 Videos
- BASIC MATHSBOOK - ALLEN CHAPTER - BASIC MATHSEXERCISE - Exersice-03
7 Videos
- AIIMS 2019BOOK - ALLEN CHAPTER - AIIMS 2019EXERCISE - PHYSICS
39 Videos
- CIRCULAR MOTIONBOOK - ALLEN CHAPTER - CIRCULAR MOTIONEXERCISE - EXERCISE (J-A)
6 Videos
Similar Questions
Two vectors →A and →B are such that →A+→B=→A−→B. Then
View SolutionThe direction of the angular velocity vector is along
View SolutionA simple pendulum executing SHM in a straight line has zero velocity at 'A' and 'B' whose distances form 'O' in the same line OAB are 'a' and 'b'. If the velocity half wat between them is 'v' then its time period is
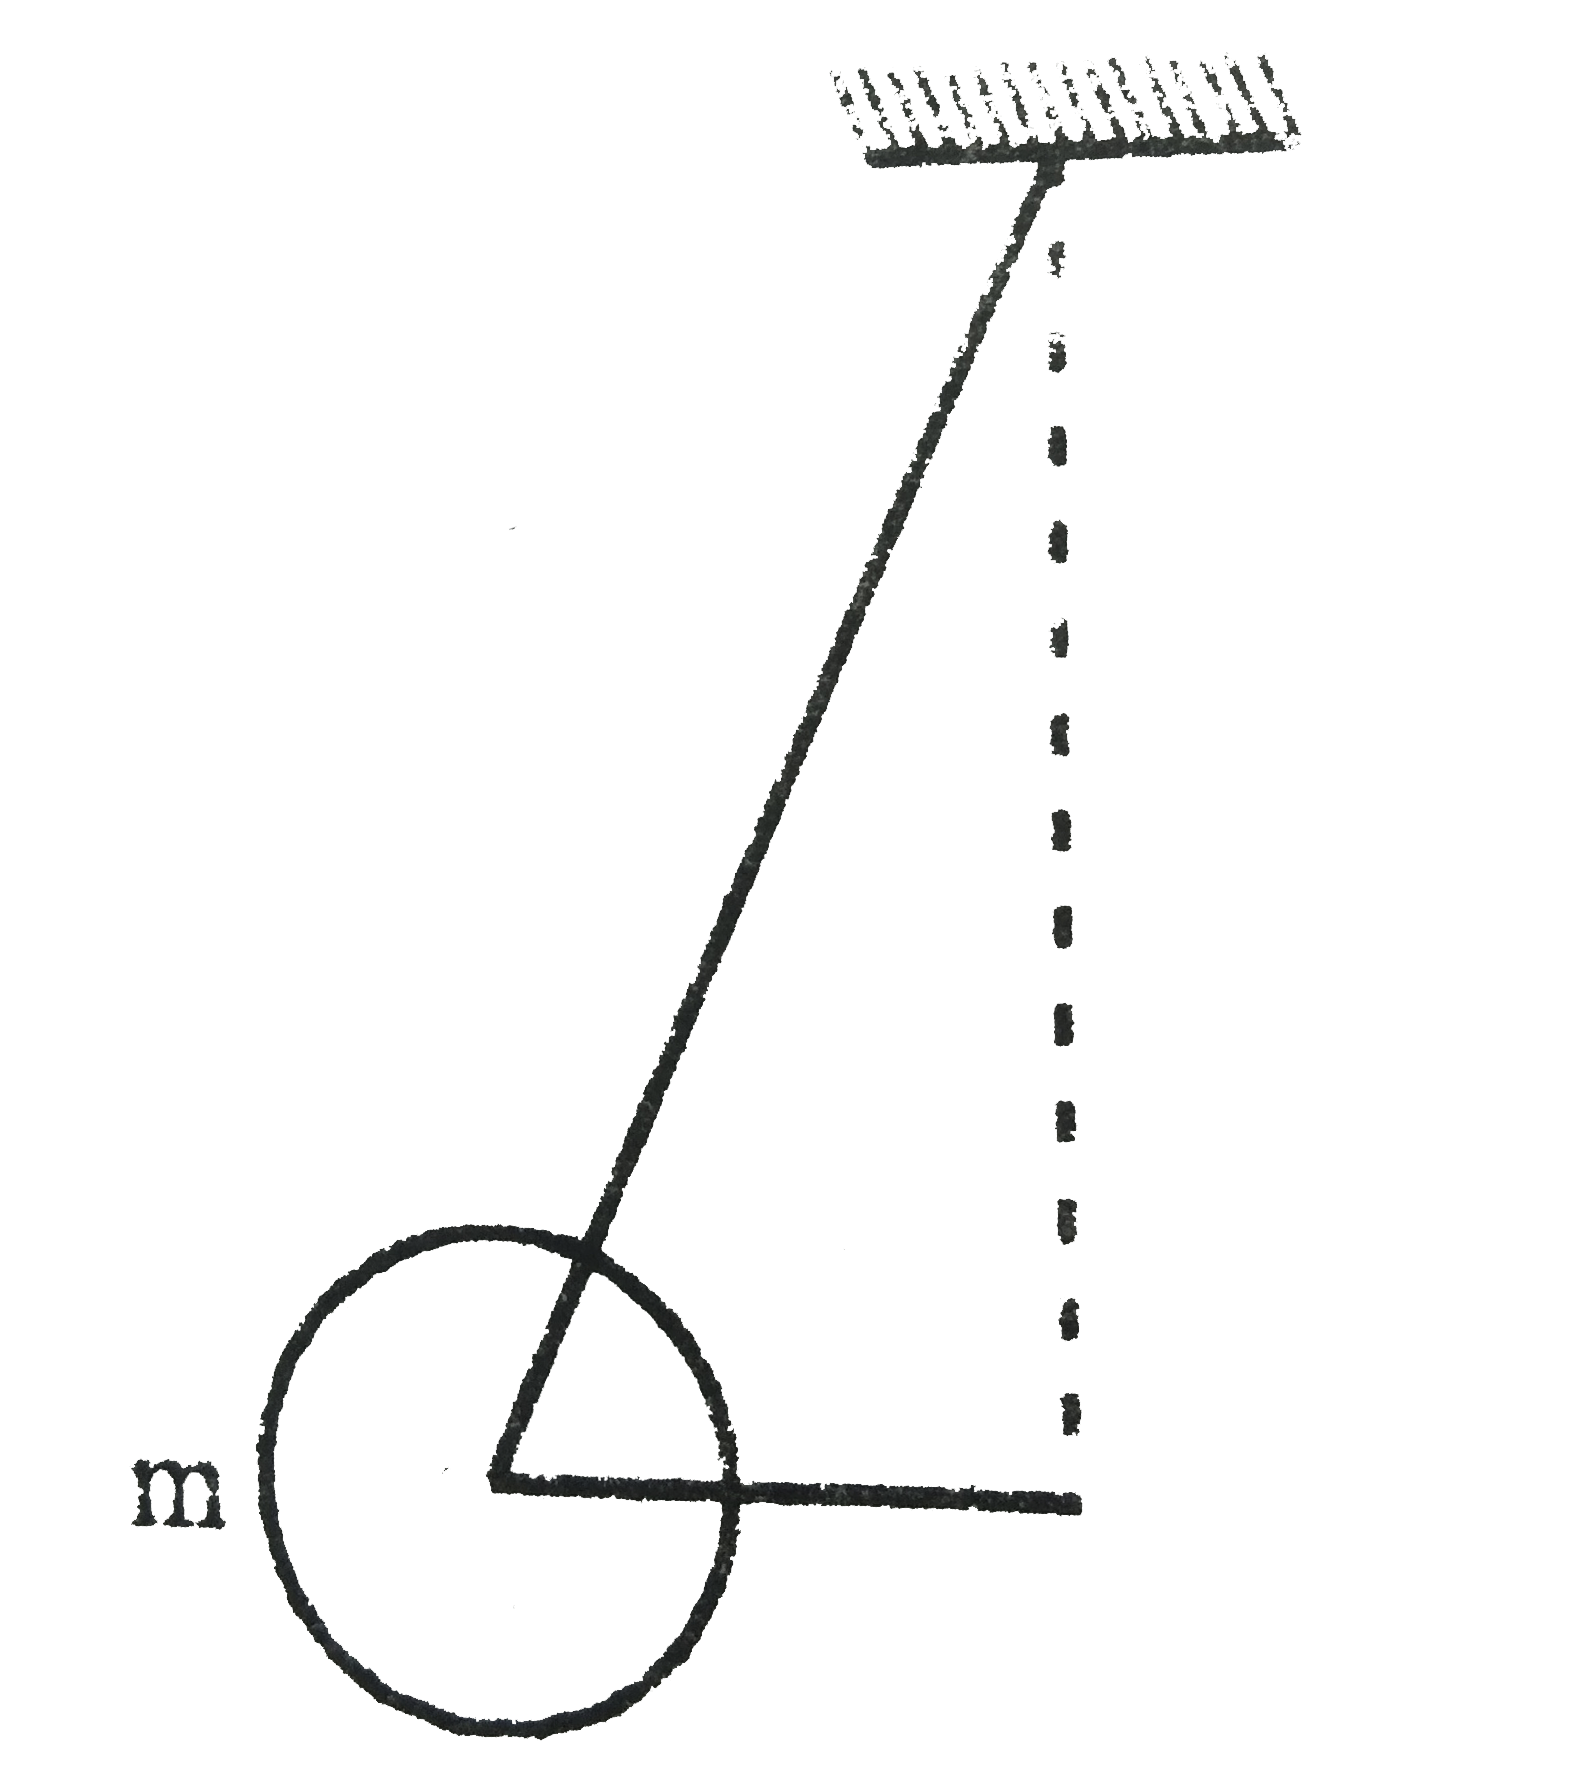
View SolutionA ball of mass (m)0.5kg is attached to the end of a string having length (L)0.5m. The ball is rotated on a horizontal circular path about vertical axis. The maximum tension that the string can bear is 324N. The maximum possible value of angular velocity of ball (radian/s) is -
 .
.
View SolutionFigure shows the velocity time graph of a particle moving along straight line (v is m/s and t is in second). It average velocity in 20 seconds will be: .
View SolutionA car is moving on a straight road. The velocity of the car varies with time as shown in the figure. Initially (at t=0), the car was at x=0 , where, x is the position of the car at any time 't'. The displacement time graph will be best represented by :-
View SolutionA car is moving on a straight road. The velocity of the car varies with time as shown in the figure. Initially (at t=0), the car was at x=0, where, x is the position of the car at any time 't'.
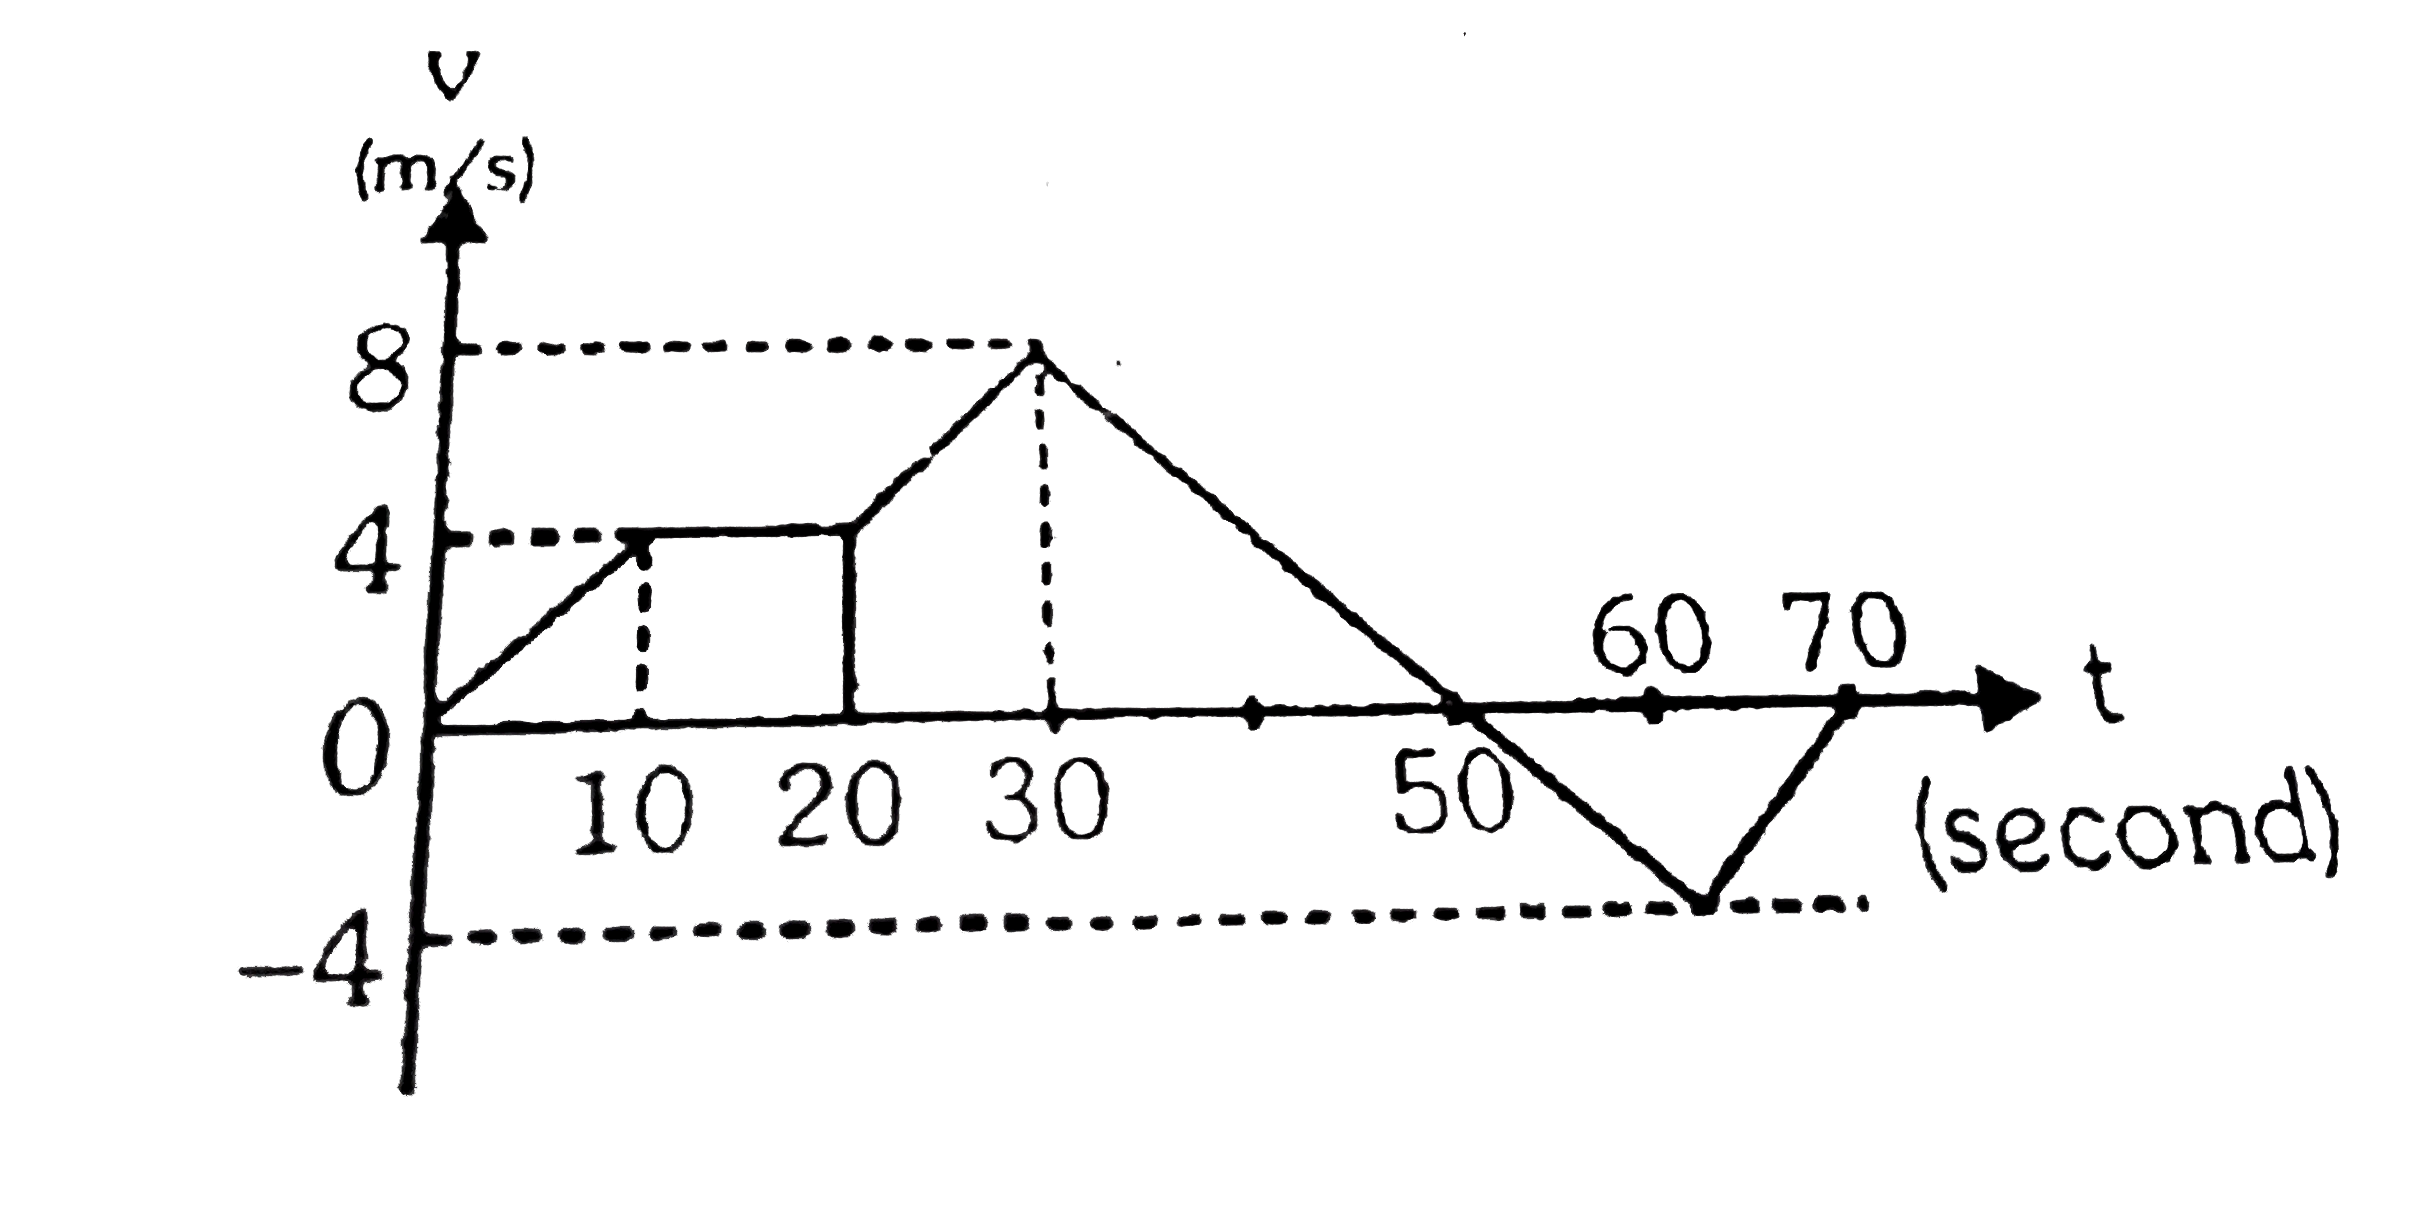
The maximum displacement from the starting position will be :-
View SolutionA car moves along a straight path with variable velocity as shown in the figure. When the car is at possiting A, its velocity is 10 m s^(-1) and when it is at position B, its velocity is 20 m s^(-1) . If the car takes 5 seconds of time to move from A to B, find the acceleration of the car.
View SolutionThe following figure represents the velocity-time graph of a moving car on a road:
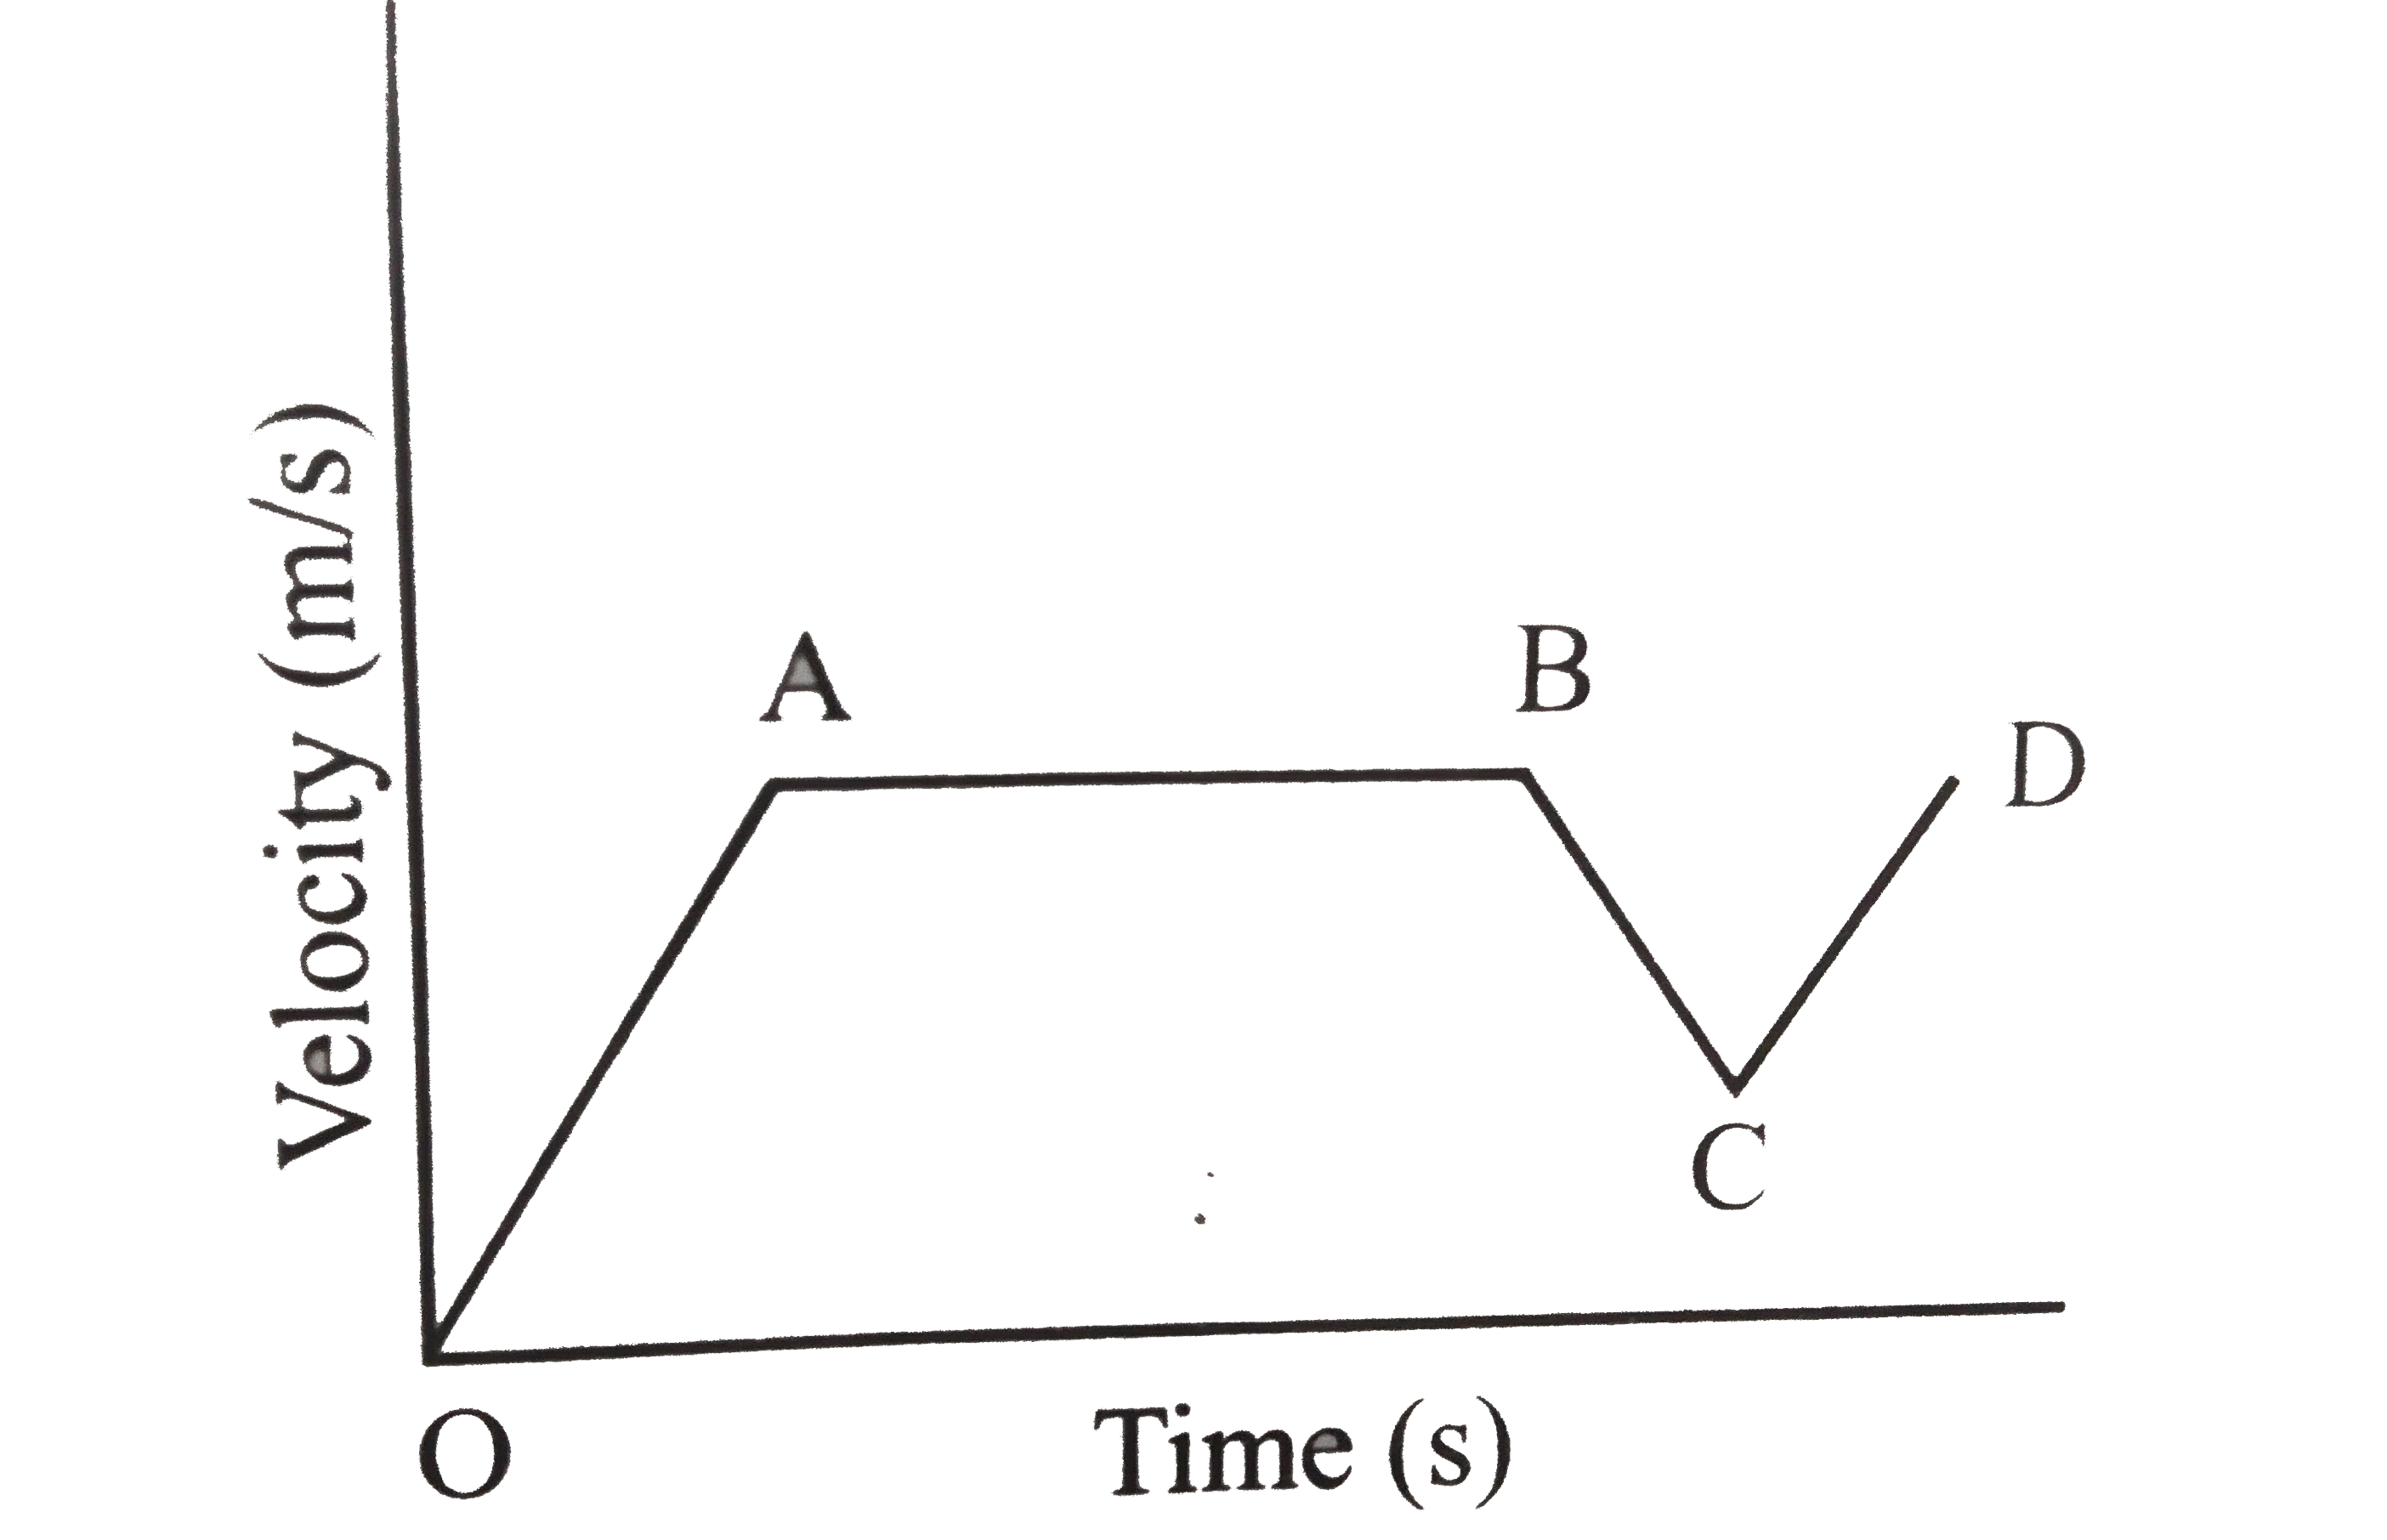
Which segment of the graph represents the retardation?
View SolutionA car completes the first half of its journey with a velocity υ1 and the rest half with a velocity υ2. Then the average velocity of the car for the whole journey is :
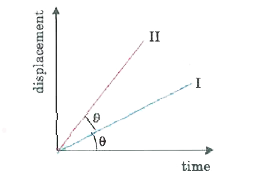
View SolutionFrom the given displacement - time graph of two cars moving on a straight road , which of the following is moving with greater velocity ?
View SolutionA car travels from rest with a constant acceleration 'a' for 't' seconds. What is the average speed of the car for its journey if the car moves along a straight road?
View SolutionA car travels from rest with a constant acceleration 'a' for 't' seconds. What is the average speed of the car for its journey if the car moves along a straight road?
View Solutionसीधी सड़क के अनुदिश एक कार का वेग समय आरेख चित्रानुसार है प्रथम 25 s में कार का औसत वेग होगा:
View SolutionA car is moving along a straight road with uniform velocity which is the correct representation
View SolutionA car moves with constant velocity along a straight level and frictionless road .draw the velocity-time graph.
View Solution