The following figure represents the velocity-time graph of a moving car on a road:
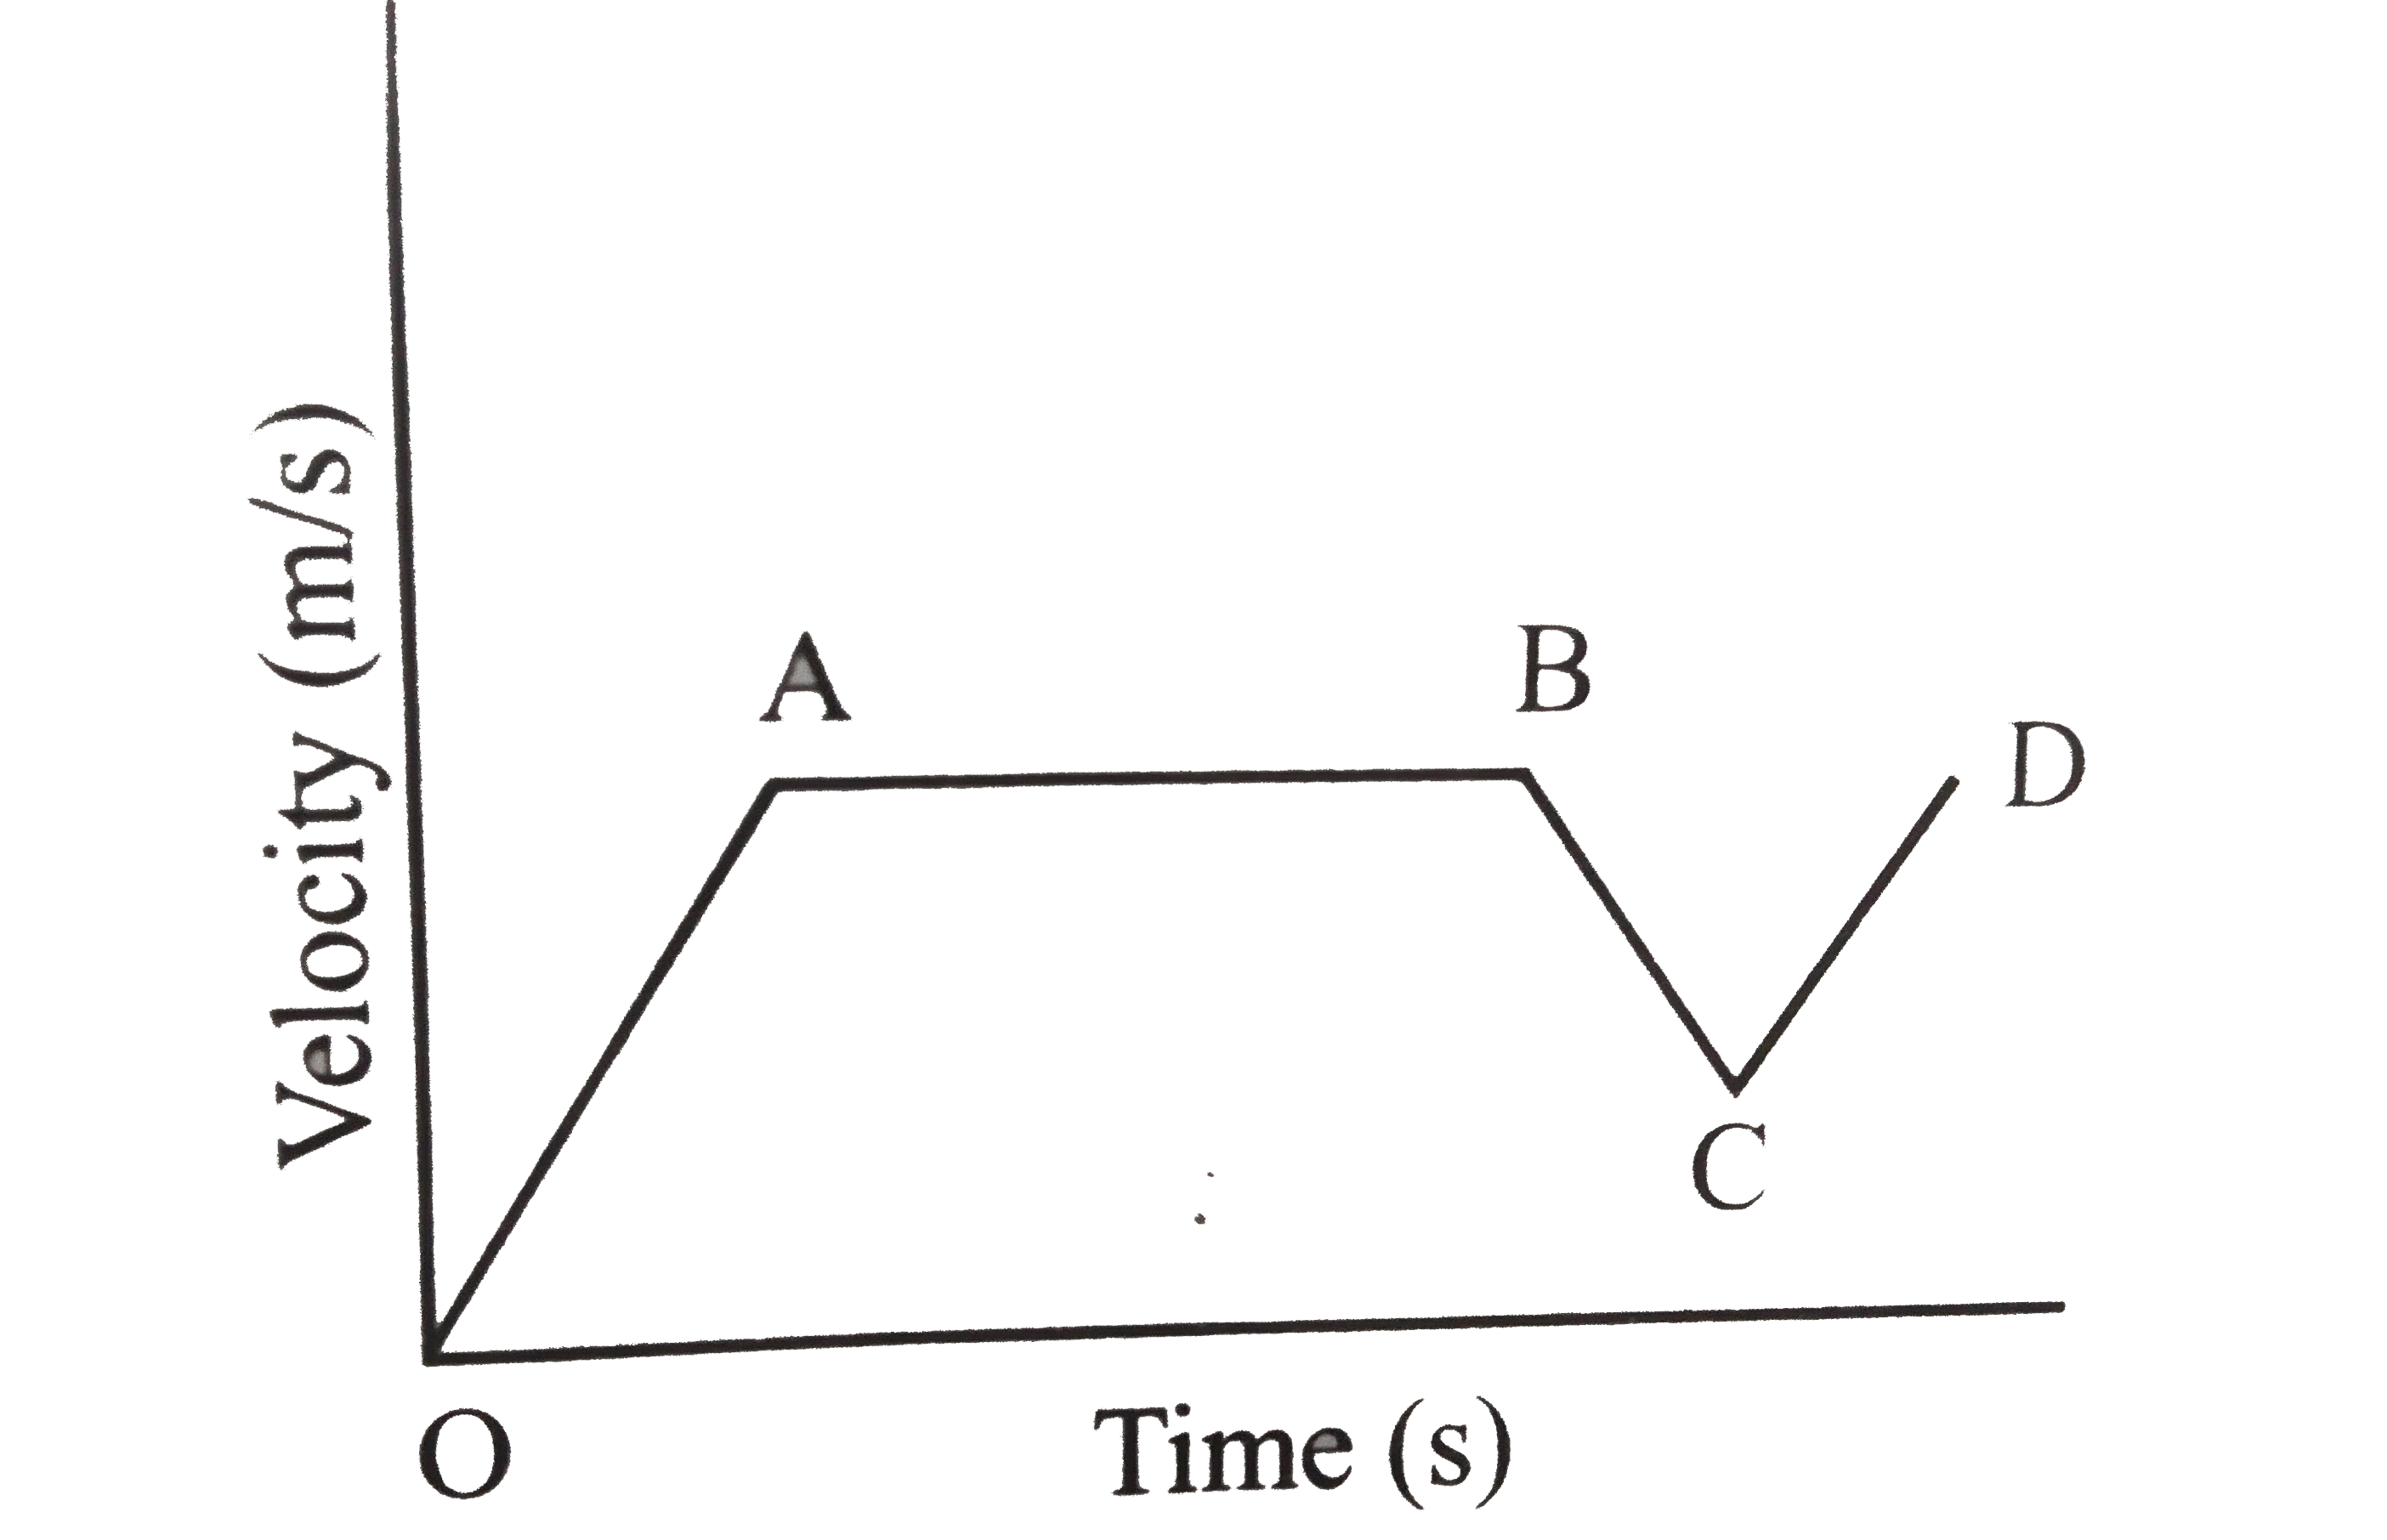
Which segment of the graph represents the retardation?
A
AB
B
BC
C
CD
D
none
Video Solution
Text Solution
The correct Answer is:B
BC
|
Topper's Solved these Questions
Similar Questions
Knowledge Check
Which of the following graphs represents the velocity-time relationship for a falling apple?
A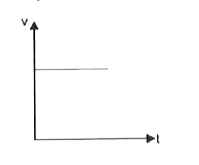 B
B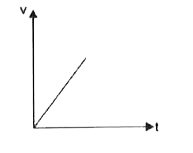 C
C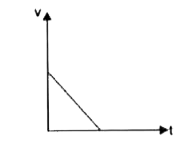 D
D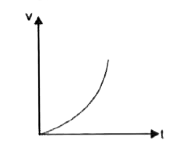
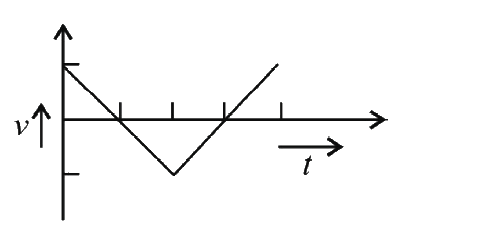
The graph below shws the velocity versus time graph for a body
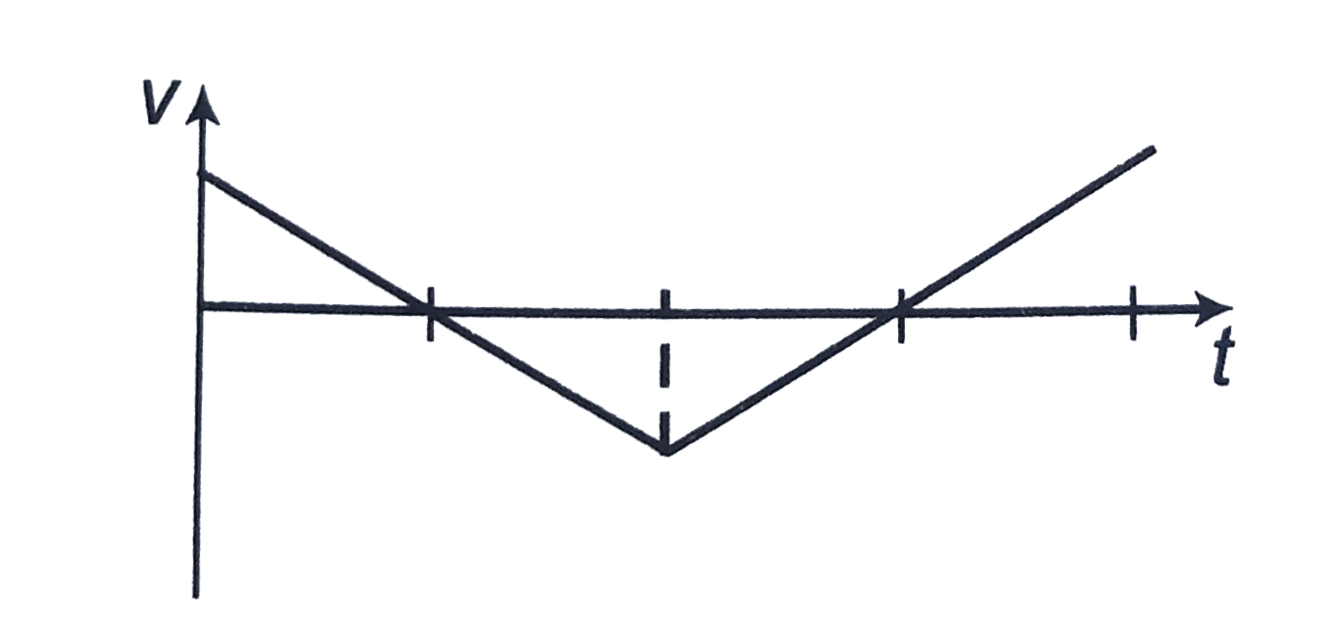
Which of the following graph represents the corresponding acceleration v//s time graph?A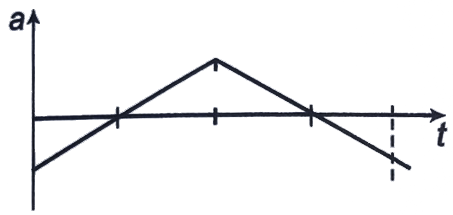 B
B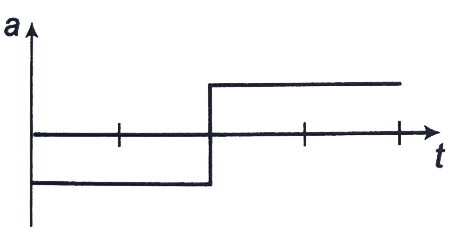 C
C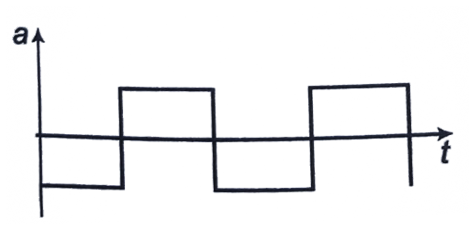 D
D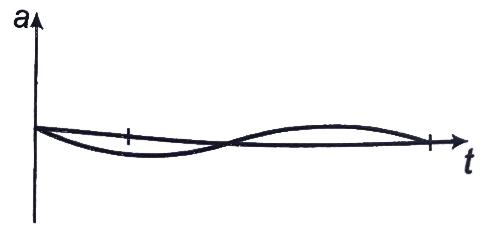
The diagram shows the velocity-time graph for a particle moving in a straight line. The sum of the two shaded areas represents :
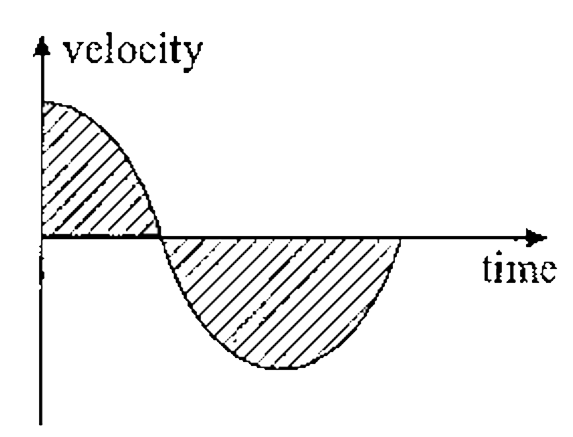 AThe increase in displacement of the particleBThe average velocity of the particleCThe average acceleration ofthe particleDThe distance moved by the particle
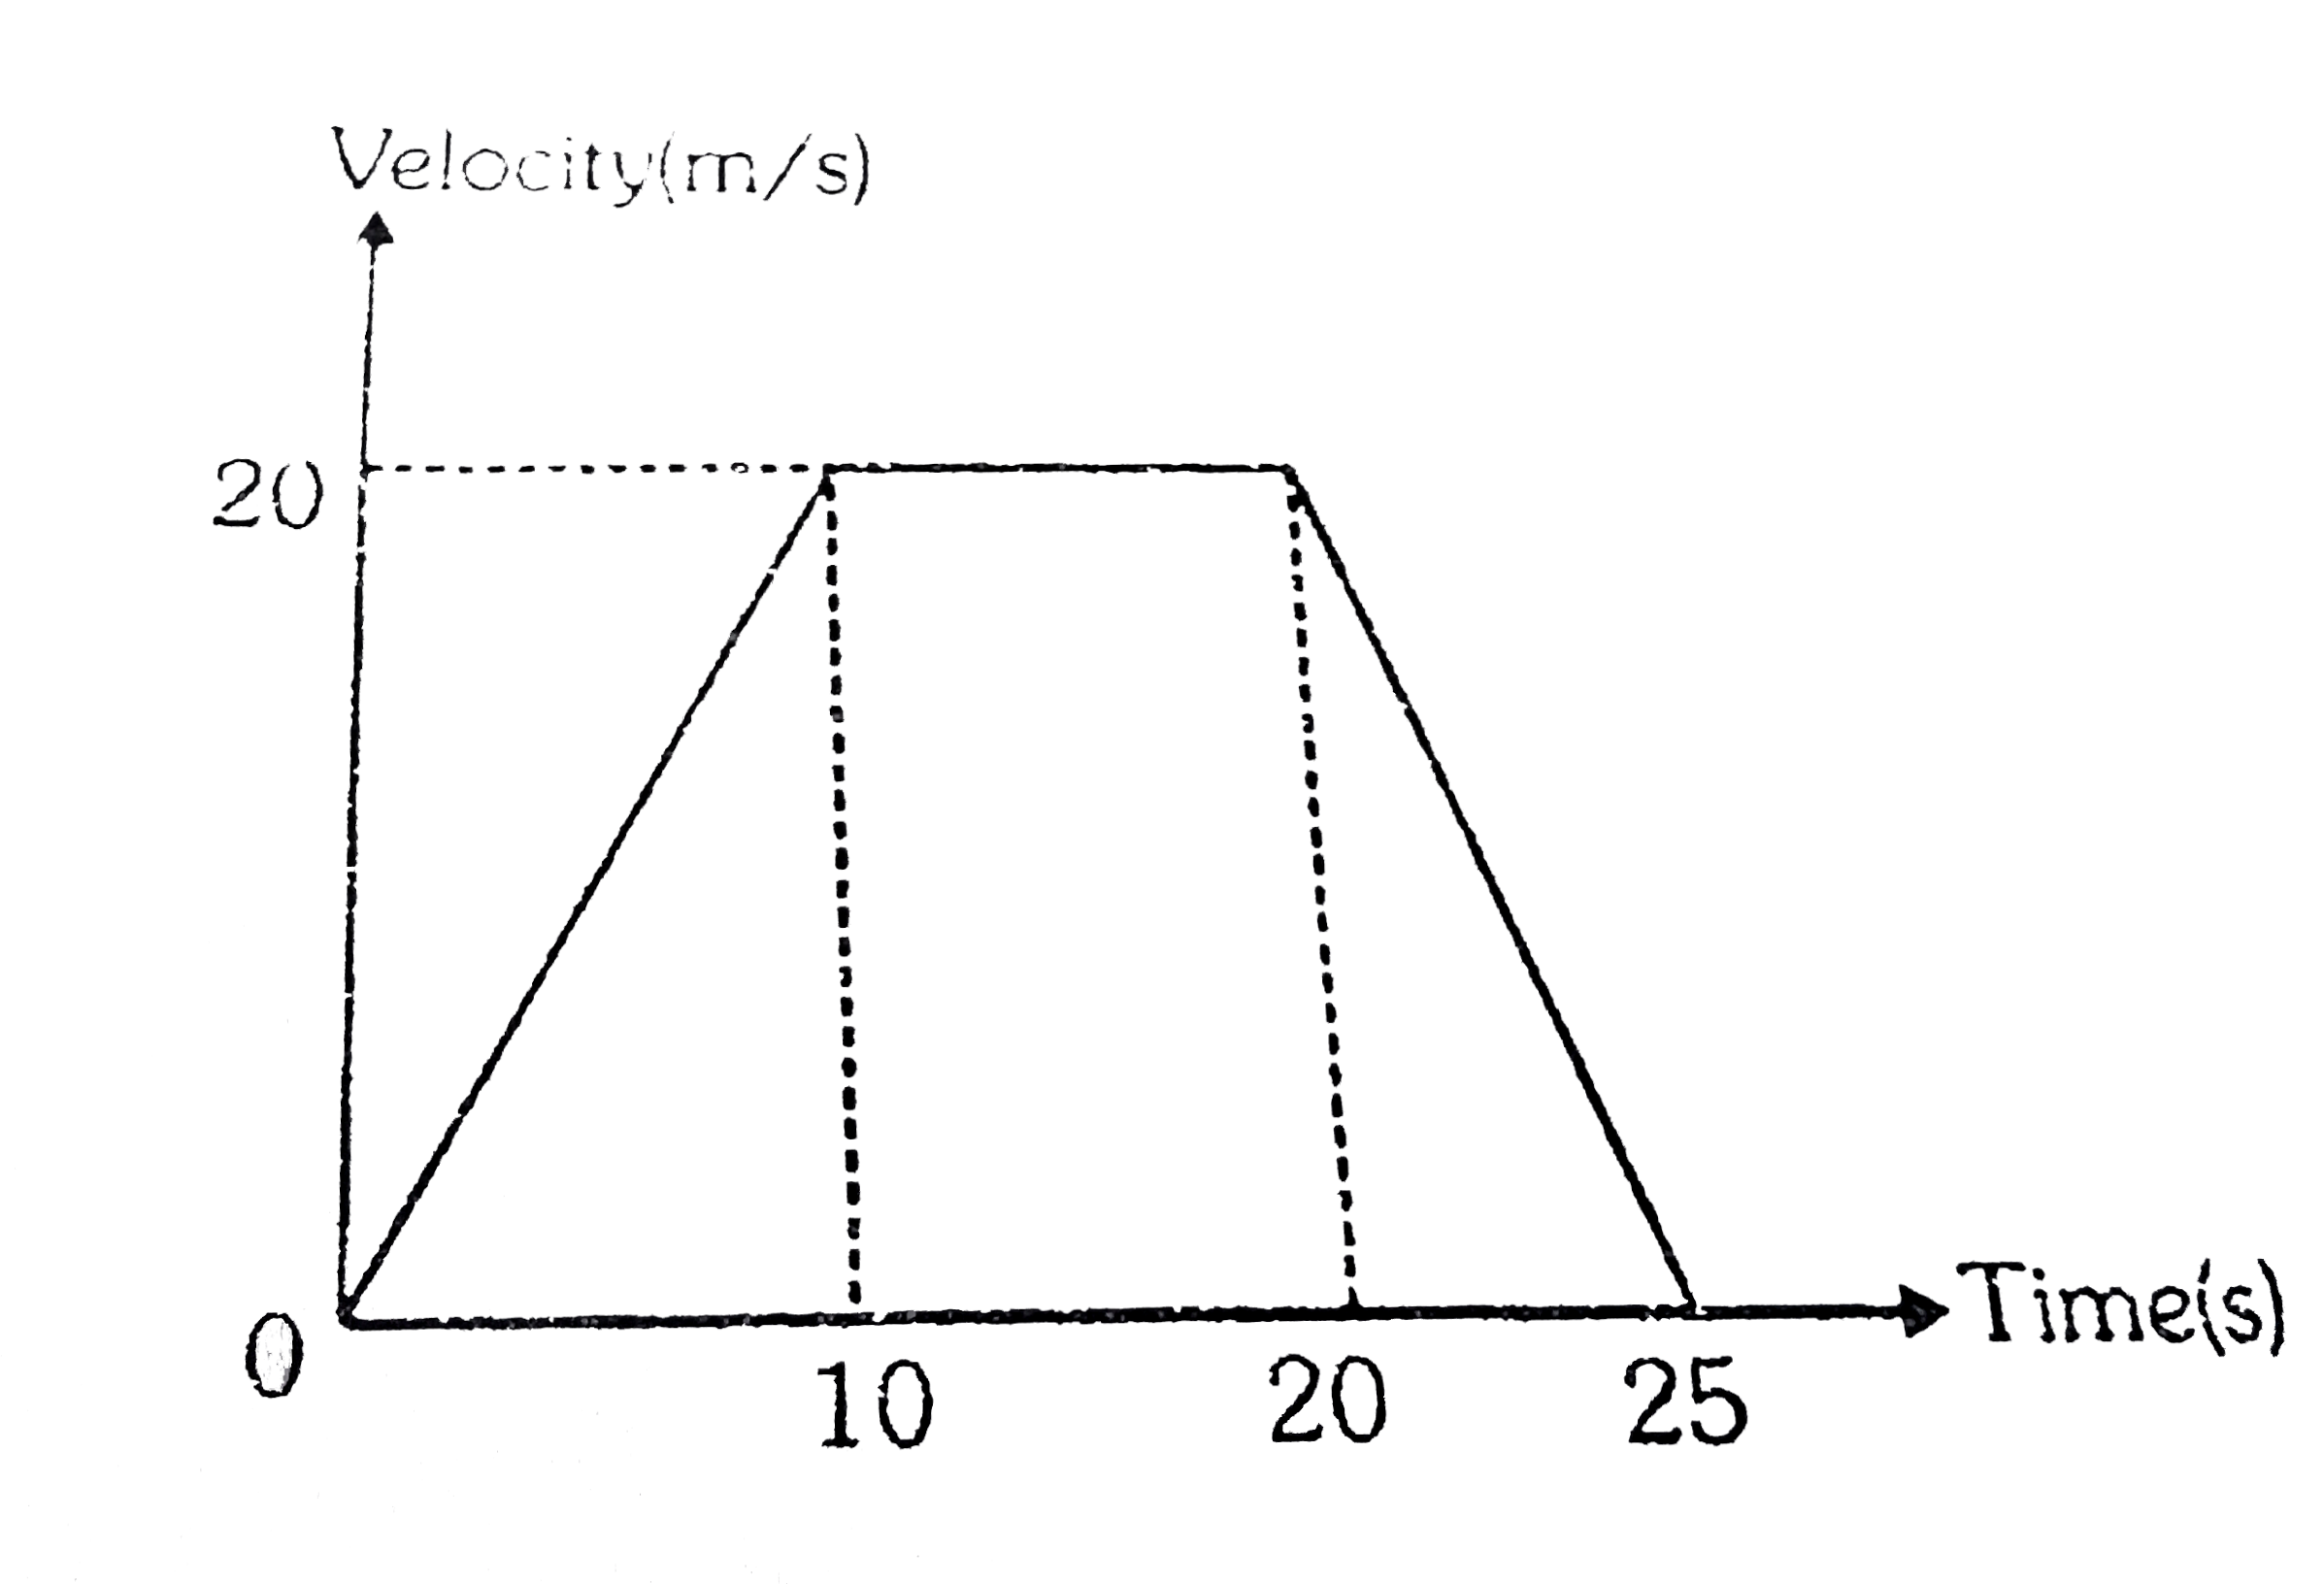
The velocity-time graph of a car moving along a straight road is shown in figure. The average velocity of the car in first 25 seconds is
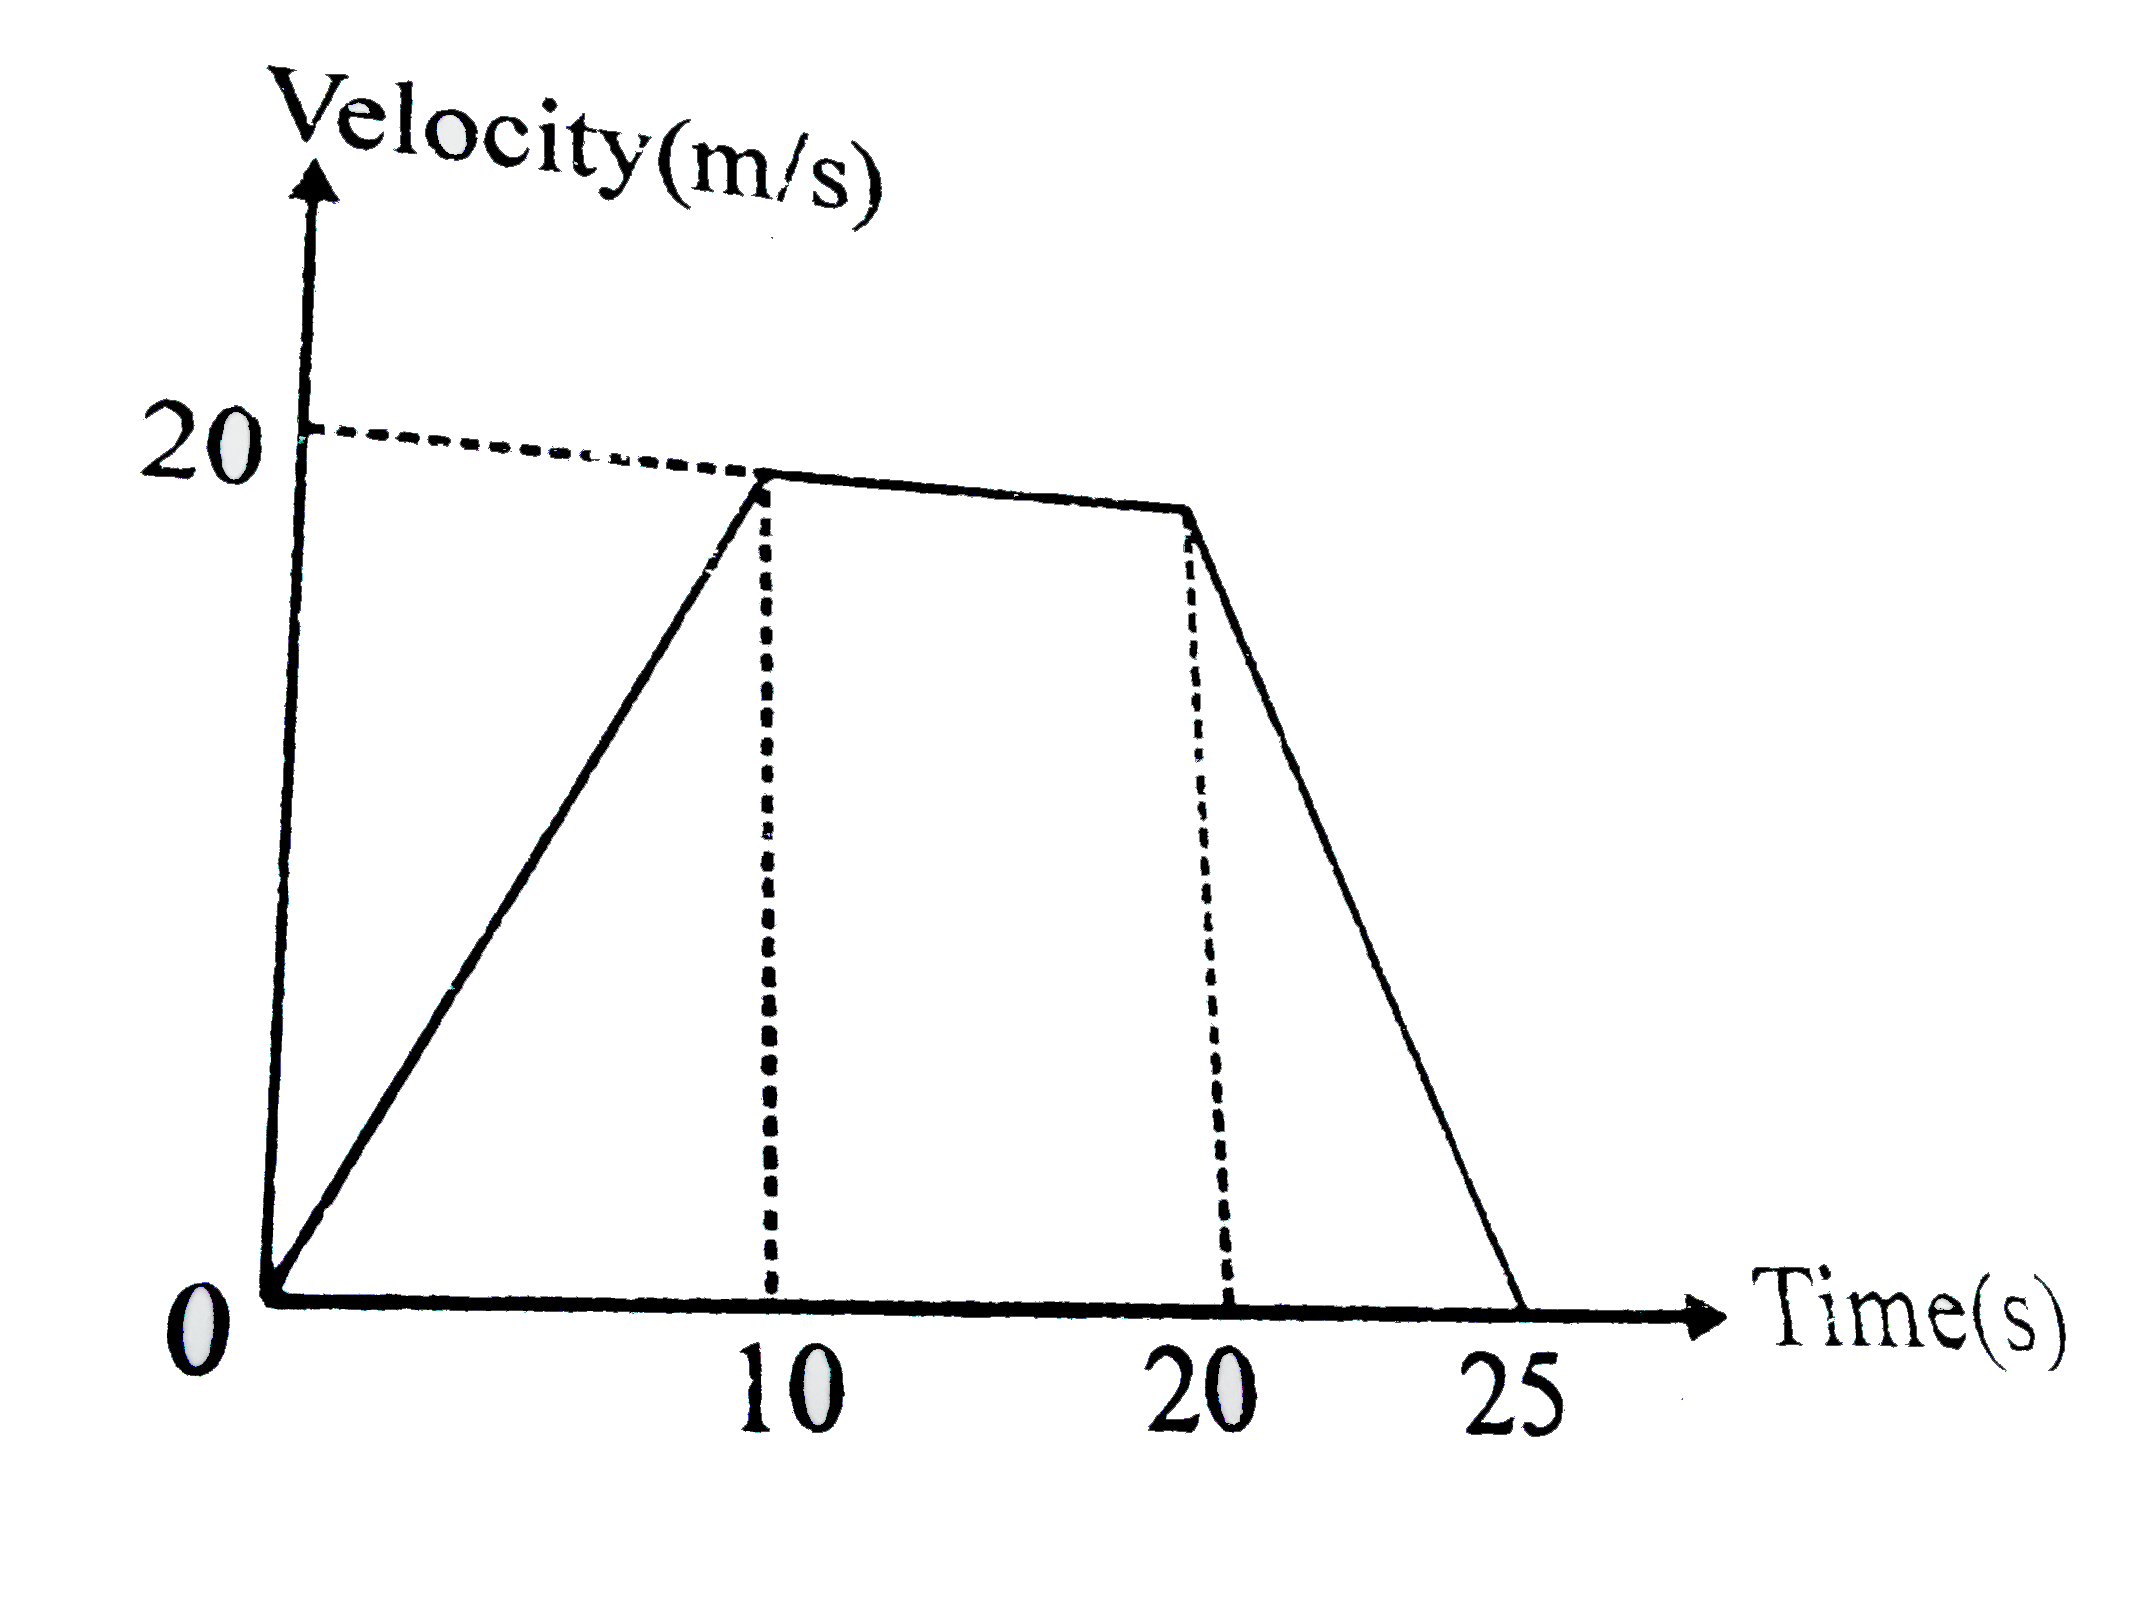
View SolutionThe velocity-time graph of a car moving along a straight road is shown in figure. The average velocity of the car is first 25 seconds is
View SolutionThe graph in figure shows the velocity v versus time t for a body. Which of the graphs shown in figure represents the corresponding acceleration versus time graphs ?
View SolutionWhich of the following graphs represents the position time-graph of a particle moving with negative velocity?
View SolutionThe velocity-time graph of a body moving in a straight line is shown below:

Which one of the following represents its acceleration time graph?
View Solution

