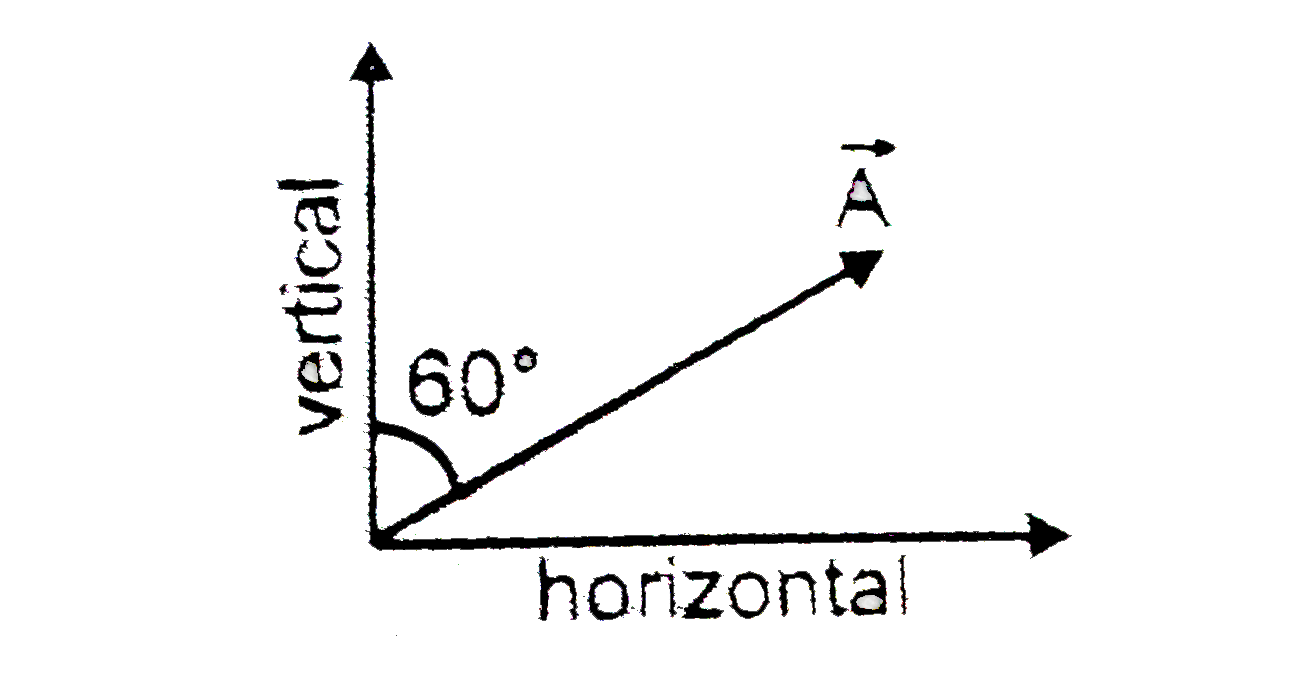
The graph shows a linear relation between variable y and x. Consider two quantities p and q defined by the equations.
p=yx
q=y−bx

As x changes from zero to a, which of the following statements are correct according to the graph?Solution in Gujrati
The correct Answer is:[M−1L−3T3A2]
Electrical conductivity
σ=JE⇒[σ]=[I/AF/q]=[I/AF/it]=[I2tFA]
=[A2T(MLT−2)(L2)]=[M−1L−3T3A2]
Topper's Solved these Questions
- BASIC MATHSBOOK - ALLEN CHAPTER - BASIC MATHSEXERCISE - Exercise-01
24 Videos
- BASIC MATHSBOOK - ALLEN CHAPTER - BASIC MATHSEXERCISE - Exercise-03
1 Videos
- BASIC MATHSBOOK - ALLEN CHAPTER - BASIC MATHSEXERCISE - EXERCISE-5(A)
15 Videos
- AIIMS 2019BOOK - ALLEN CHAPTER - AIIMS 2019EXERCISE - PHYSICS
39 Videos
- CIRCULAR MOTIONBOOK - ALLEN CHAPTER - CIRCULAR MOTIONEXERCISE - EXERCISE (J-A)
6 Videos
Similar Questions
If the force is given by F=at+bt2 with t is time. The dimensions of a and b are
View SolutionAssertion : Light year and year, both measure time.
Reason : Because light year is the time light takes to reach the earth from the sun.
View SolutionThe forces, which meet at one point but their line of action do not lie in one plane,are called
View SolutionA simple pendulum executing SHM in a straight line has zero velocity at 'A' and 'B' whose distances form 'O' in the same line OAB are 'a' and 'b'. If the velocity half wat between them is 'v' then its time period is
View SolutionA ball of mass (m)0.5kg is attached to the end of a string having length (L)0.5m. The ball is rotated on a horizontal circular path about vertical axis. The maximum tension that the string can bear is 324N. The maximum possible value of angular velocity of ball (radian/s) is -
 .
.
View SolutionSolve the following pair of linear equations:
(i) px+qy=pq; qxpy=p+q
(ii) ax+by=c; bx+ay=1+c
(iii) xa−yb=0; ax+by=a2+b2
(iv) (a−b)x+(a+b)y=a2−2ab−b2;(a+b)(x+y)=a2+b2
(v) 152x − 378y = − 74; 76x − 189y = − 37
View Solution2.The pair x=p and y=q of the linear equations in two variables x and y graphically represents two lines which are
View SolutionThe graph shows a linear relation between variable y and x. Consider two quantities p and q defined by the equations.
p=yx
q=y−bx

As x changes from zero to a, which of the following statements are correct according to the graph?
View SolutionThe following figure shows the graph of y= p(x) , where p(x) is a polynomial in variable x . The number of zeroes of the polynomial p(x) is
View Solutionp(x+y)+q(x−y)=p2−pq+q2 और p(x+y)−q(x−y)=p2+pq+q2 जहां p ,q शून्य से भिन्न अचर है
View SolutionSolve the following simultaneous linear equations in two variables by the method of subsititution :
p(x+y)=q(x−y)=2pq (p,q≠0)
View SolutionDraw the graph of following linear equation in two variables x+y=4
View Solutionदो चरों वाले निम्नलिखित रैखिक समीकरण में x+y=4 का आलेख खींचिए -
View SolutionIf xpyq=(x+y)p+q, show that dydx=yx.
View SolutionThe graph of y=p(x), where p(x) is a polynomial in variable x, is as follows:

The number of zeroes of p(x) is _______________
View Solution
