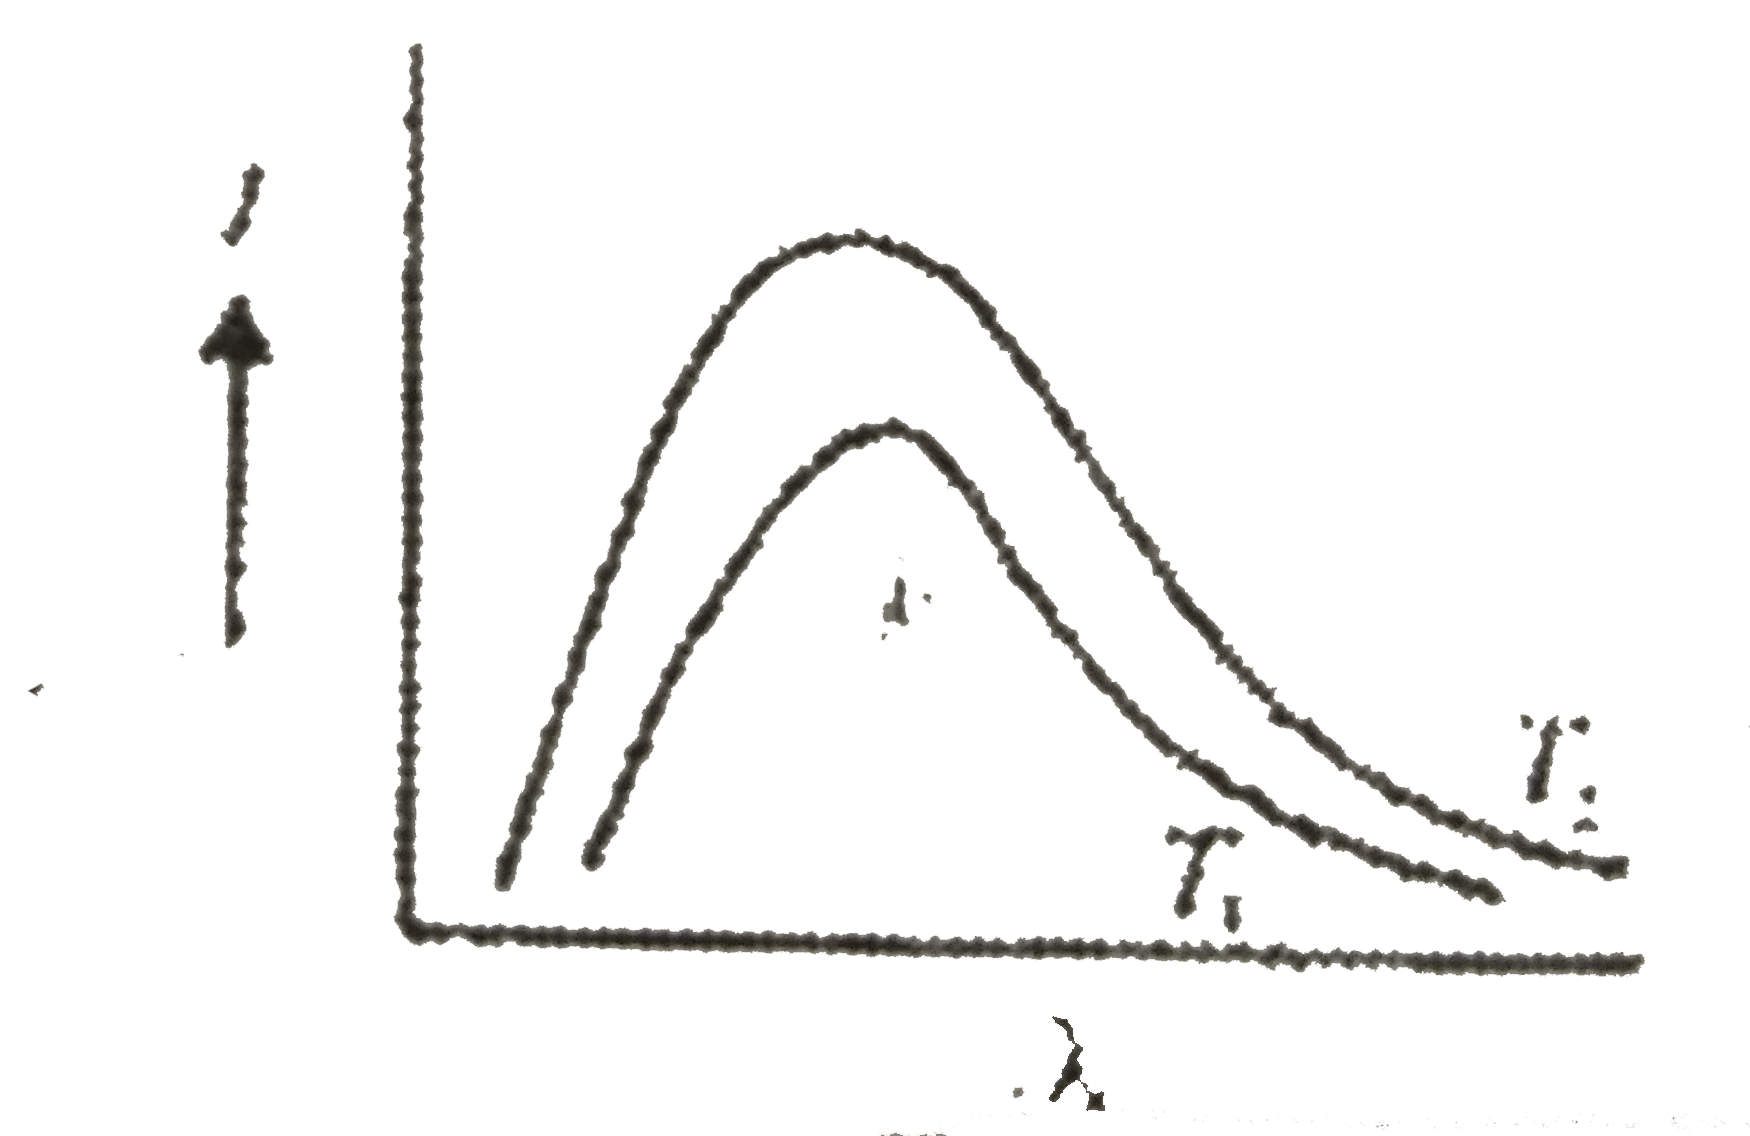
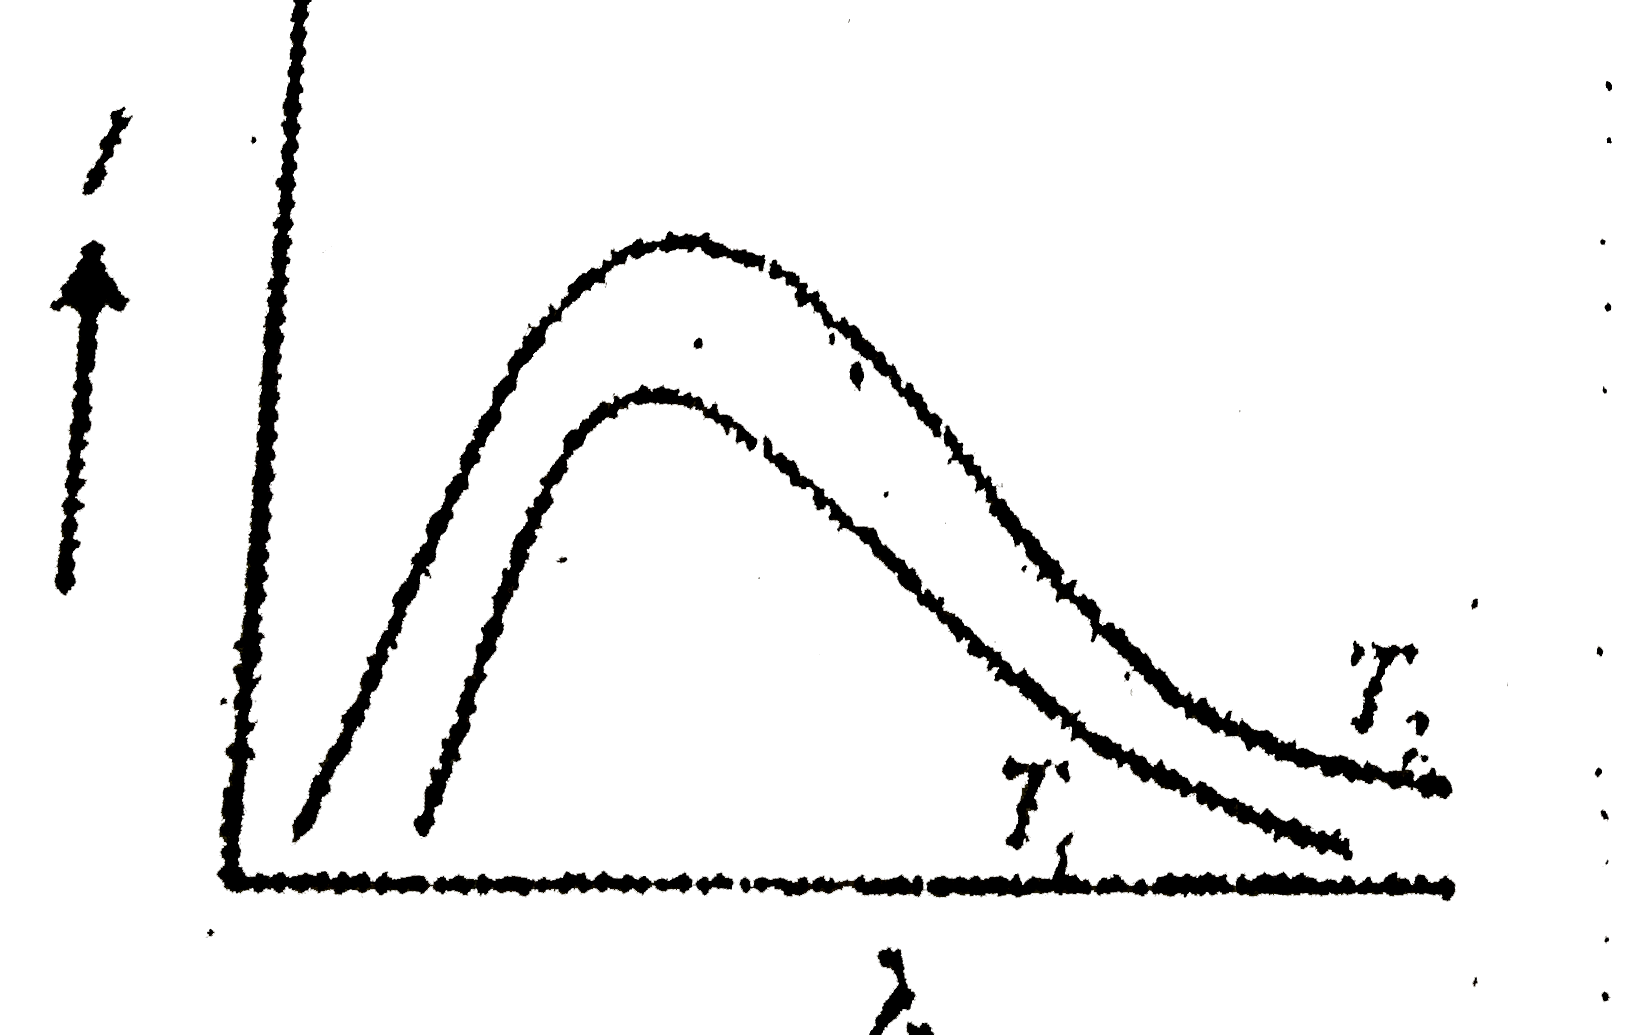
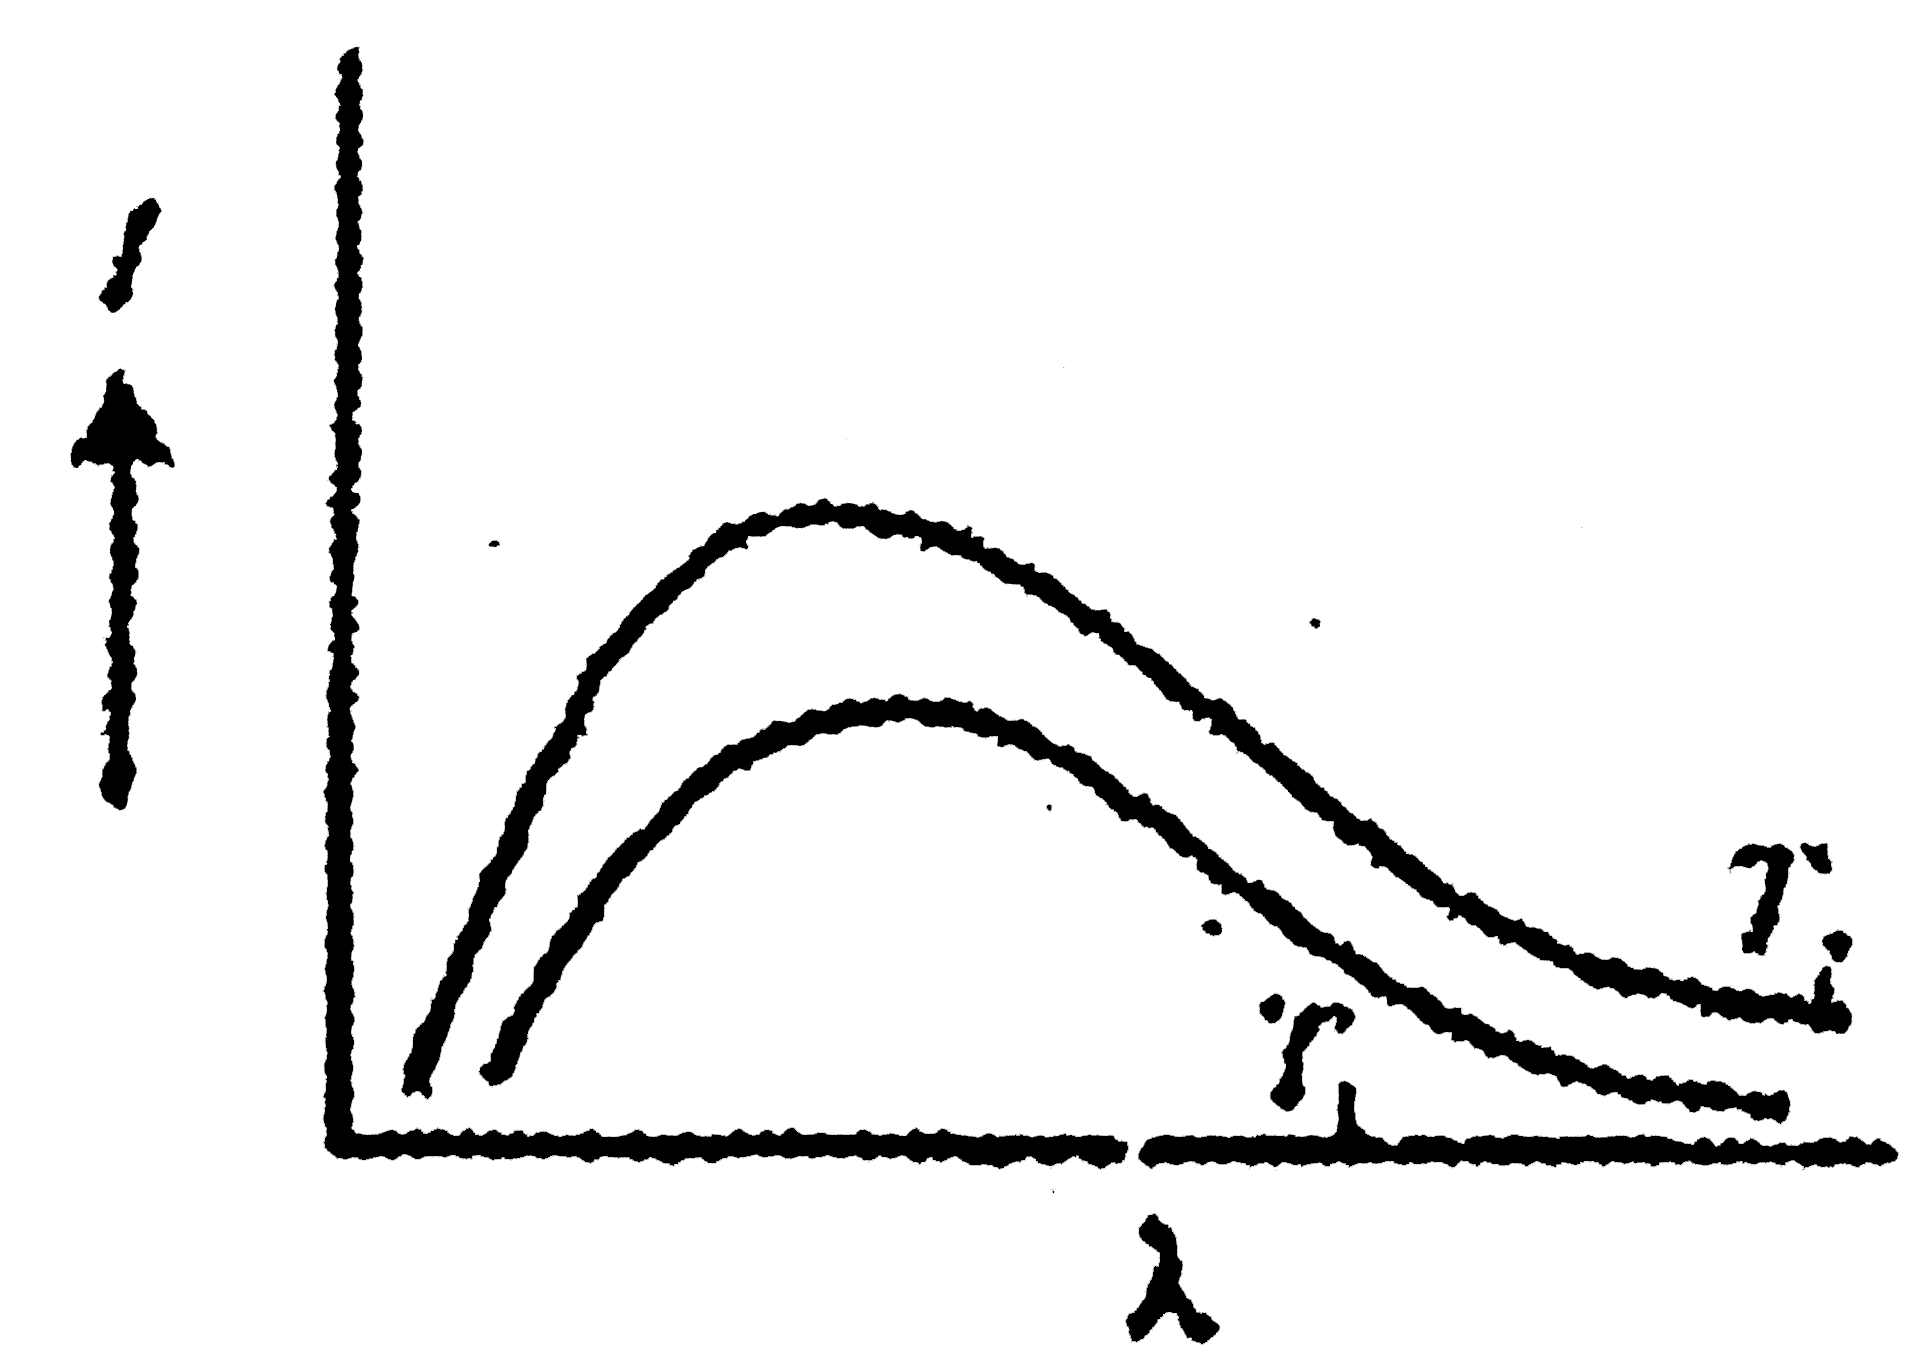
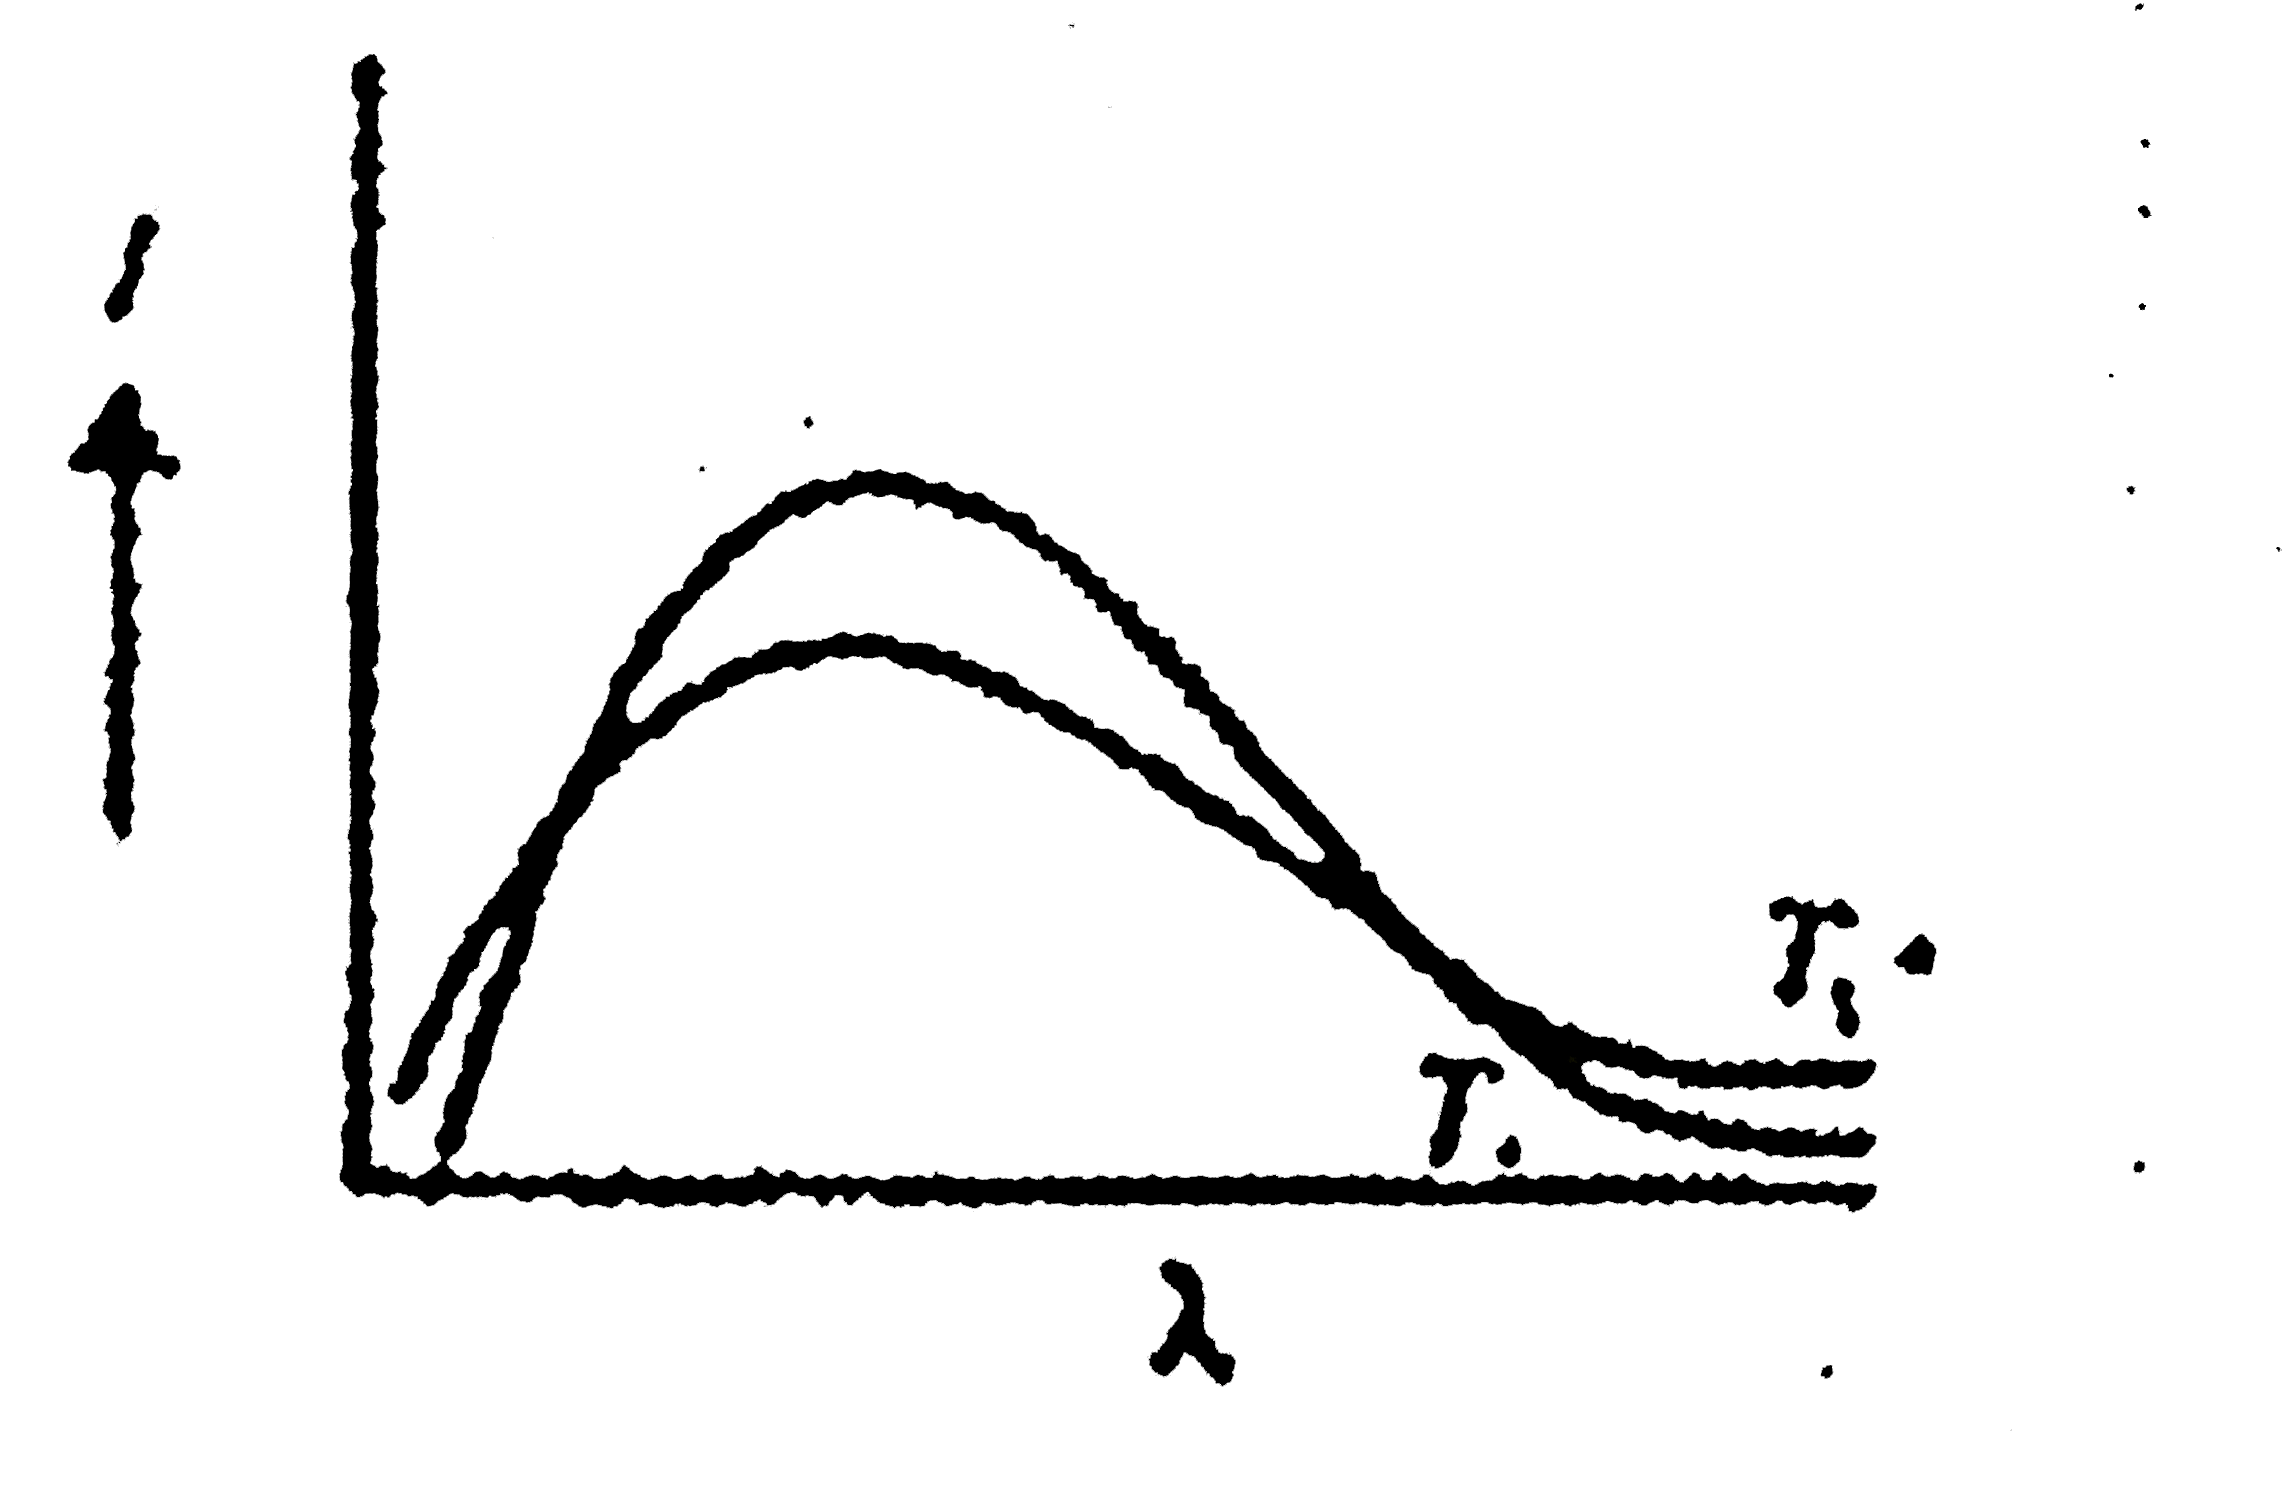
Shown below are the black body radiation curves at temperature T1 and T2(T2>T1). Which of the following plots is correct?
The correct Answer is:C
To solve the problem regarding the black body radiation curves at temperatures T1 and T2 (where T2>T1), we will use Wien's Displacement Law and the characteristics of black body radiation.
1. Understand Black Body Radiation: Black body radiation refers to the electromagnetic radiation emitted by a perfect black body in thermal equilibrium. The intensity of radiation emitted varies with wavelength and temperature.
2. Apply Wien's Displacement Law: According to Wien's Displacement Law, the wavelength λm at which the intensity of radiation is maximum for a black body is inversely proportional to the temperature T:
λmT=b
where b is a constant (Wien's displacement constant).
3. Analyze the Given Temperatures: Since T2>T1, it follows from Wien's Law that:
λm2T2=λm1T1
This implies that λm2<λm1 because T2>T1. Therefore, the peak wavelength for the higher temperature T2 will be shorter than that for the lower temperature T1.
4. Interpret the Curves: In the black body radiation curves:
- The curve for T1 will peak at a longer wavelength (larger λm1).
- The curve for T2 will peak at a shorter wavelength (smaller λm2).
5. Identify the Correct Plot: Among the given options, the correct plot will show:
- The curve corresponding to T2 shifted to the left (indicating a shorter peak wavelength) compared to the curve for T1.
6. Conclusion: Based on the analysis, the correct plot that represents the black body radiation curves at temperatures T1 and T2 (with T2>T1) is the one where the curve for T2 is to the left of the curve for T1.
λmT=b
where b is a constant (Wien's displacement constant).
λm2T2=λm1T1
This implies that λm2<λm1 because T2>T1. Therefore, the peak wavelength for the higher temperature T2 will be shorter than that for the lower temperature T1.
- The curve for T1 will peak at a longer wavelength (larger λm1).
- The curve for T2 will peak at a shorter wavelength (smaller λm2).
- The curve corresponding to T2 shifted to the left (indicating a shorter peak wavelength) compared to the curve for T1.
Similar Questions
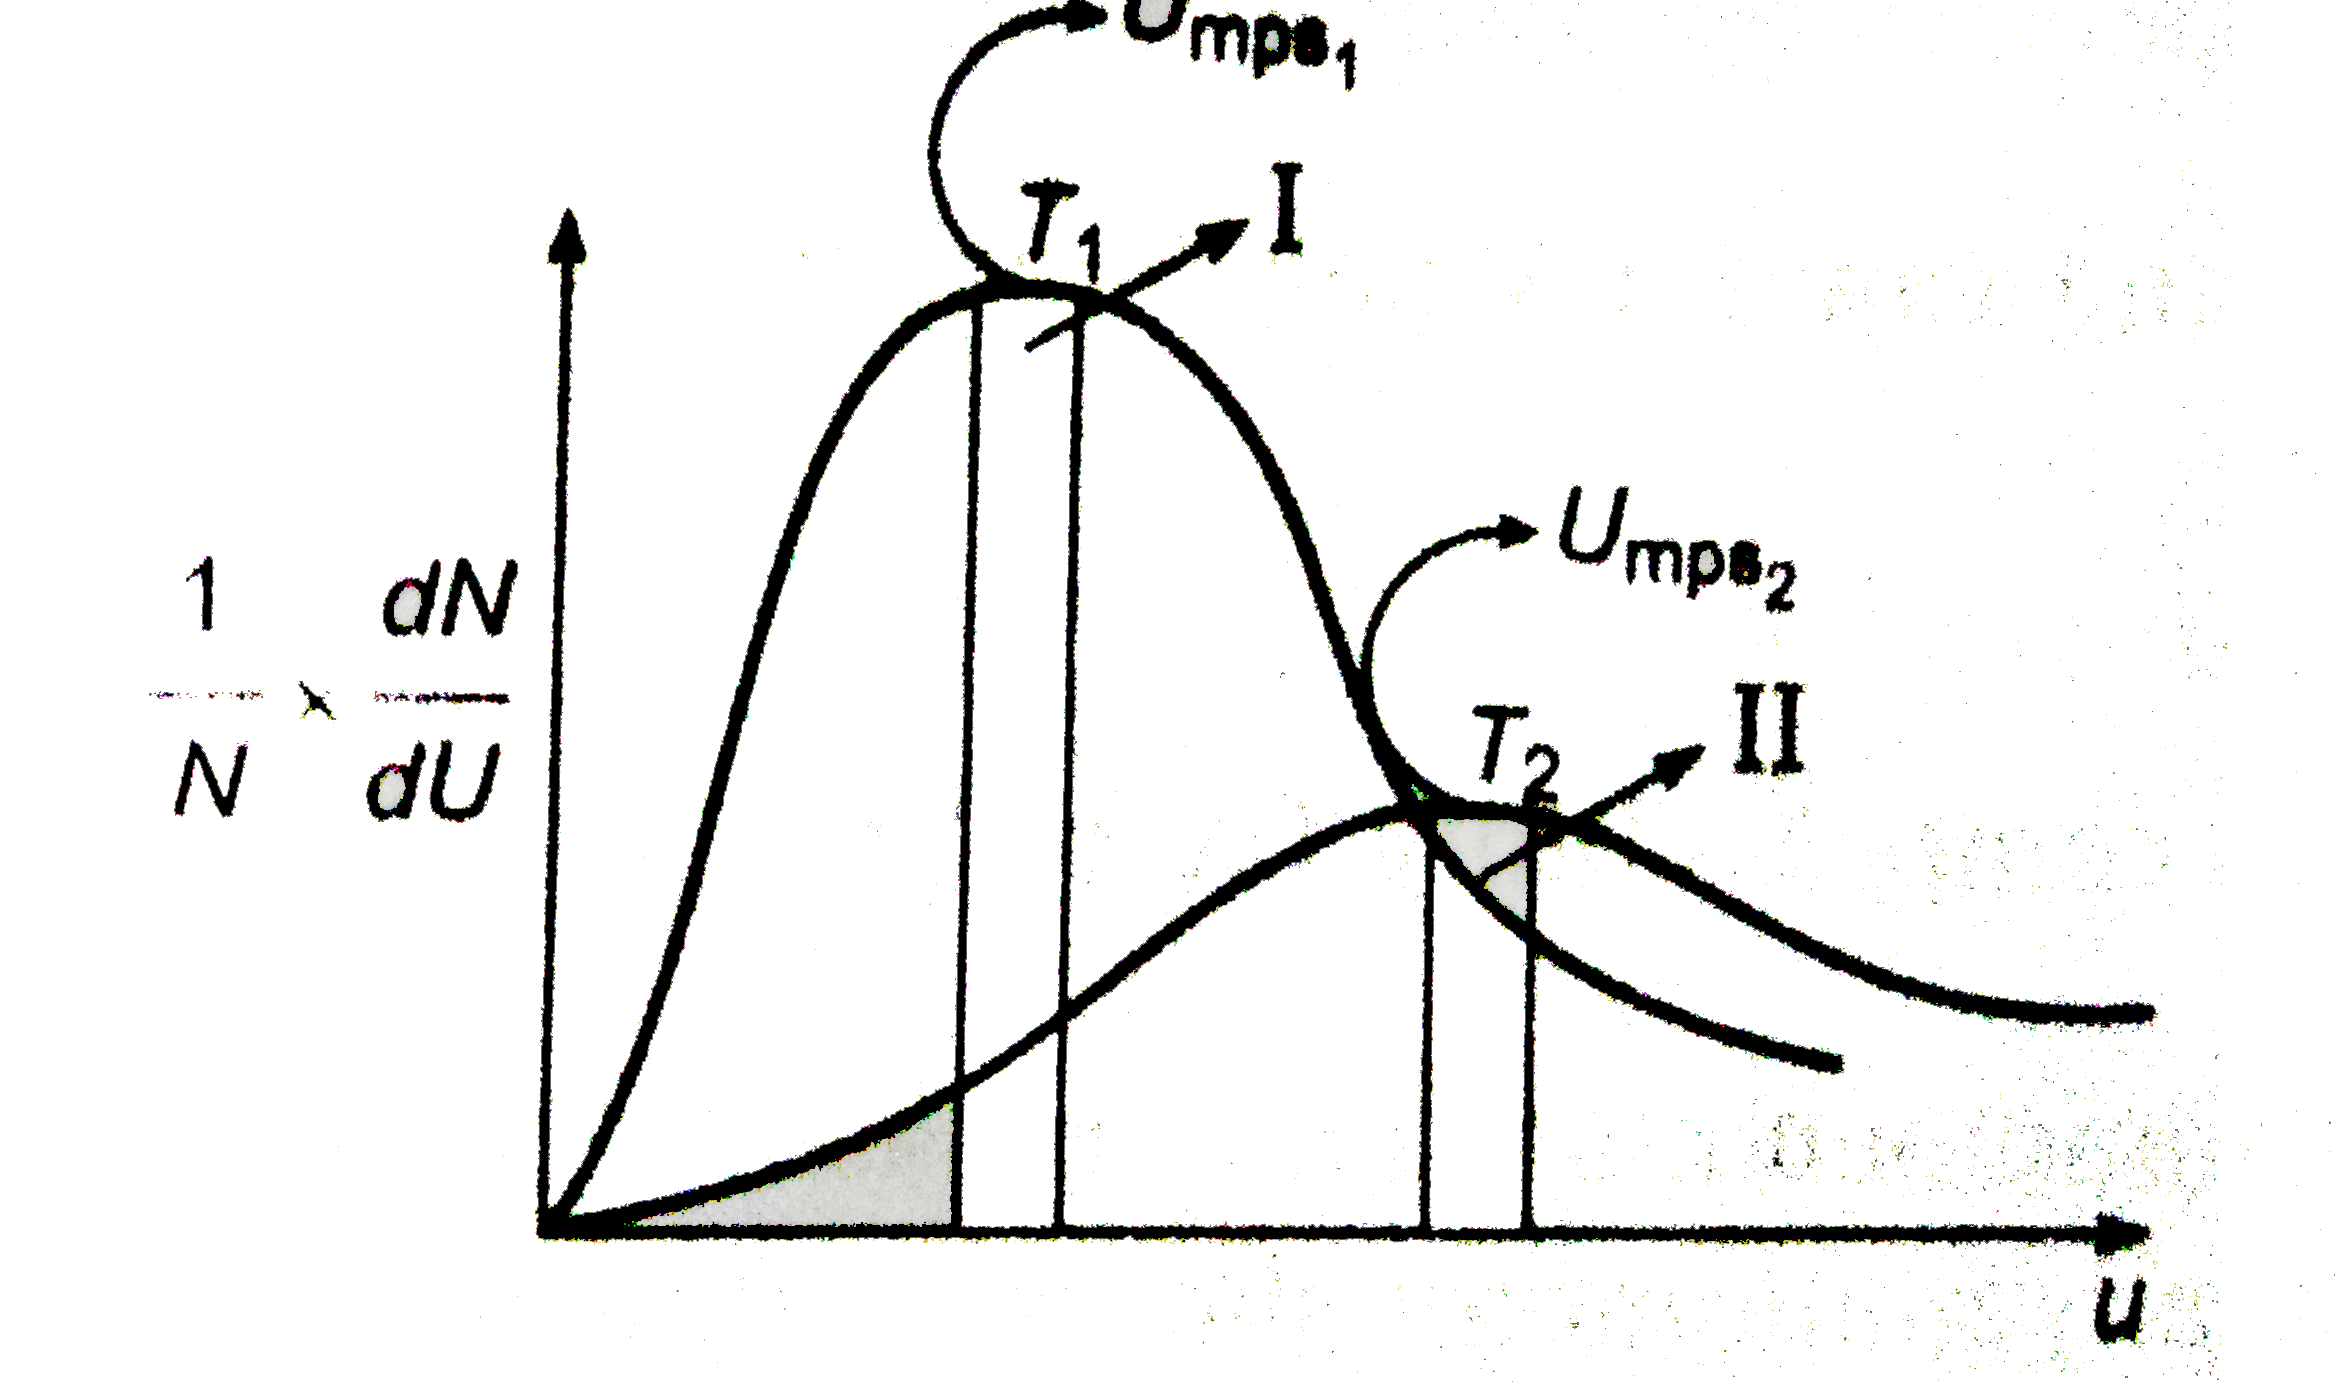
Following represents the Maxwell distribution curve for an ideal gas at two temperature T1 and T2 . Which of the following option(s) is/are true?
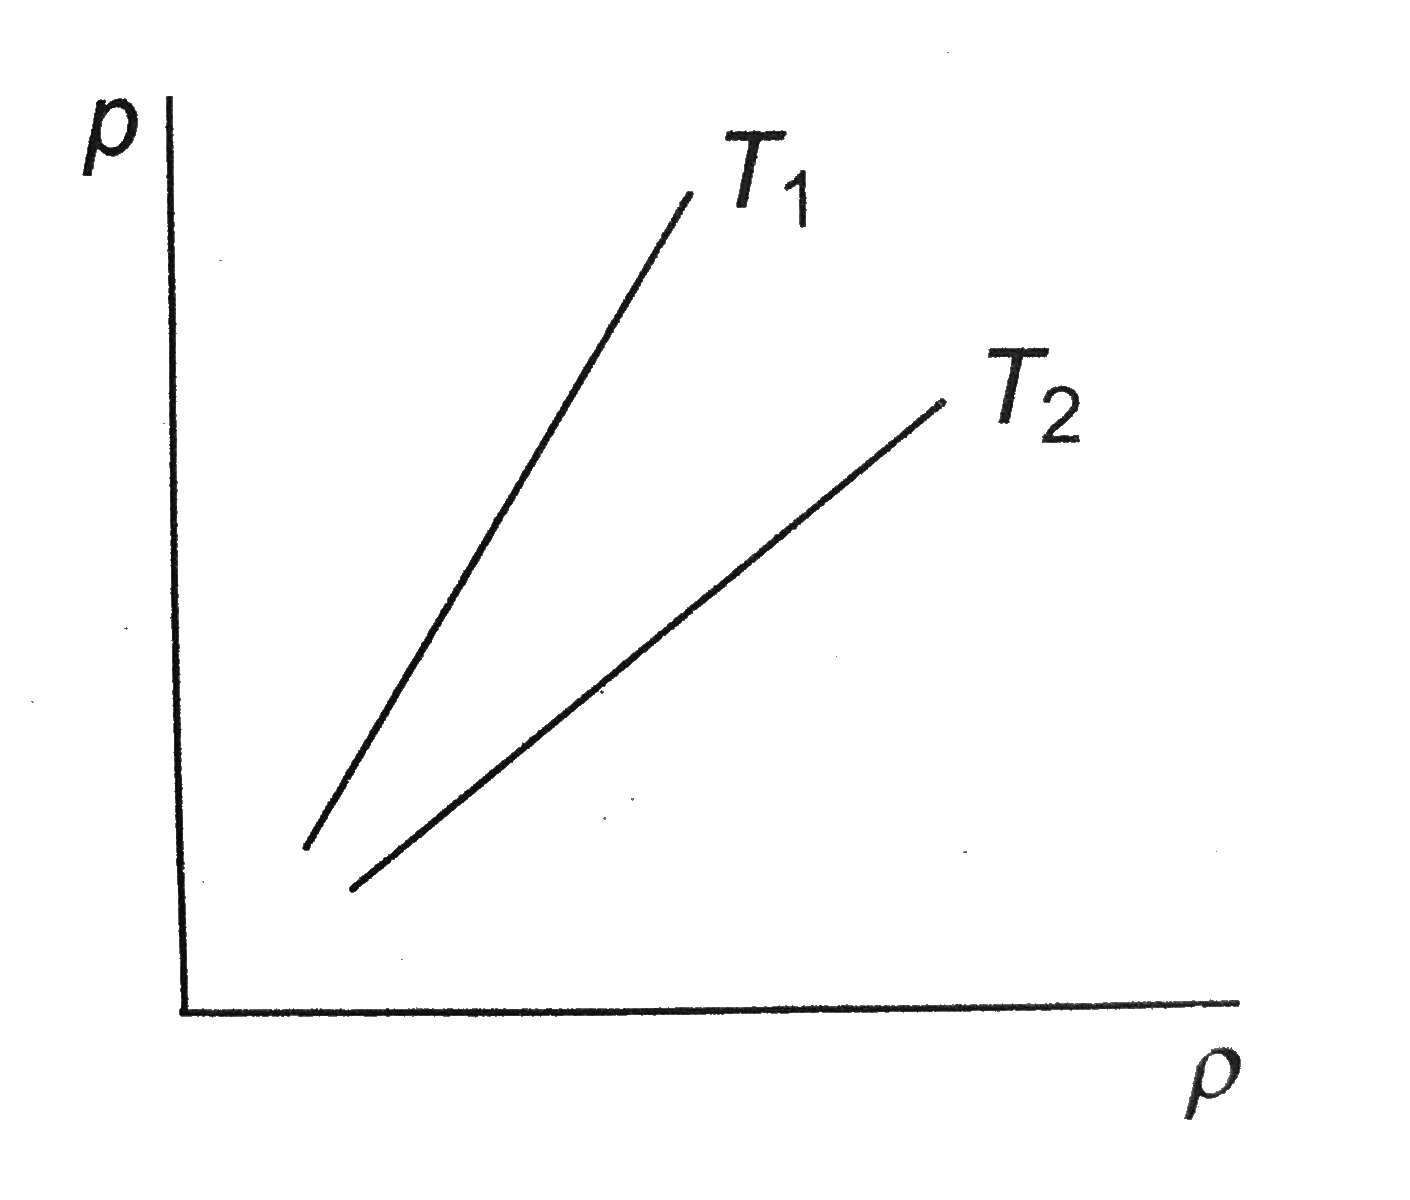
View SolutionFigure shows graphs of pressure vs density for an ideal gas at two temperature T1andT2. Which of the following is correct?
View SolutionIf k1 rate constant at temperature T1andk2 = rate constant at temperature T2 for a first order reaction, then which of the following relations is correct? (Ea : activation energy)
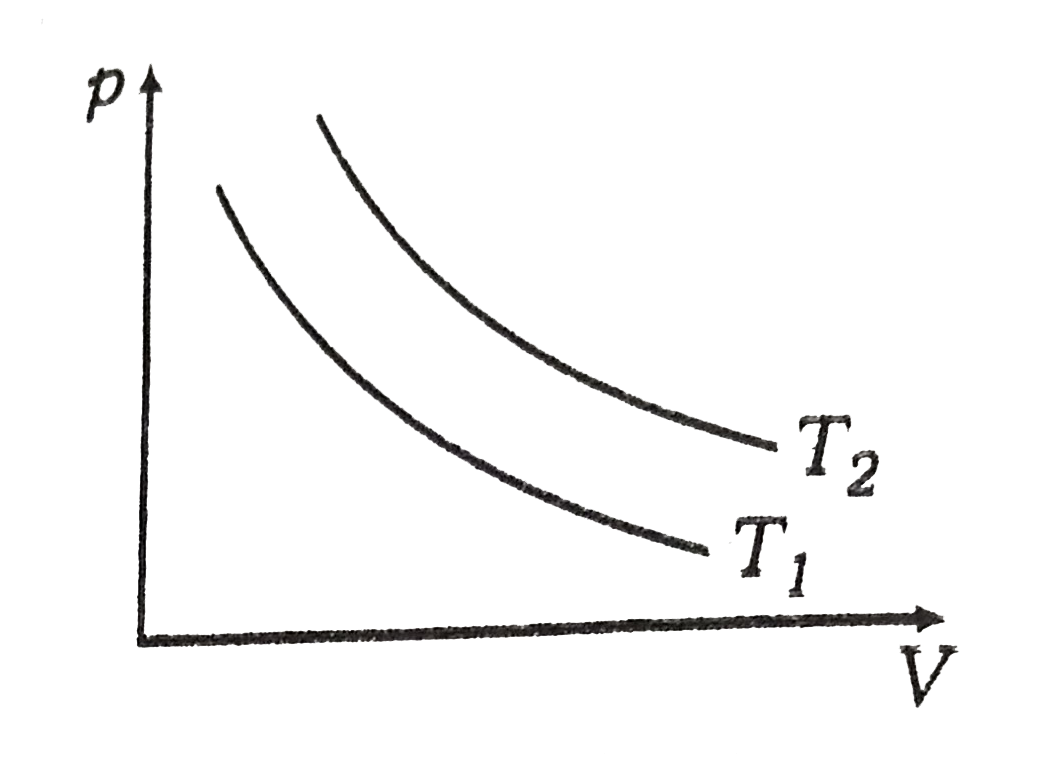
View SolutionThe adjoining fgure shows graph of pressure and volume of a gas at two temperatures T1 and T2 Which one the following is correct
View Solution
Calculate a, T1,T2,T1'&T2'.
View SolutionRadius of a conductor increases uniformly from left end to right end as shown in fig.

Material of the conductor is isotropic and its curved surface is thermally isolated from surrounding. Its ends are maintained at temperatures T1 and T2(T1>T2): If, in steady state, heat flow rate is equal to H , then which of the following graphs is correct
View SolutionRadius of a conductor increases uniformly from left end to right end as shown in fig.

Material of the conductor is isotropic and its curved surface is thermally isolated from surrounding. Its ends are maintained at temperatures T1 and T2(T1>T2): If, in steady state, heat flow rate is equal to H , then which of the following graphs is correct
View SolutionV vs T curves at different pressures P1 and P2 for an ideal gas are shown below:

Which one of the following is correct?
View SolutionIf K1= Rate constant at temperature T1 and k2 rate constant at temperature T2 for a first order reaction, then which of the following relation is correct ?
View SolutionA particle moving with uniform acceleration has average velocities ν1,ν2 and ν3 over the successive intervals of time t1,t2 and t3 respectively. The value of ν1−ν2ν2−ν3 will be
View Solution
