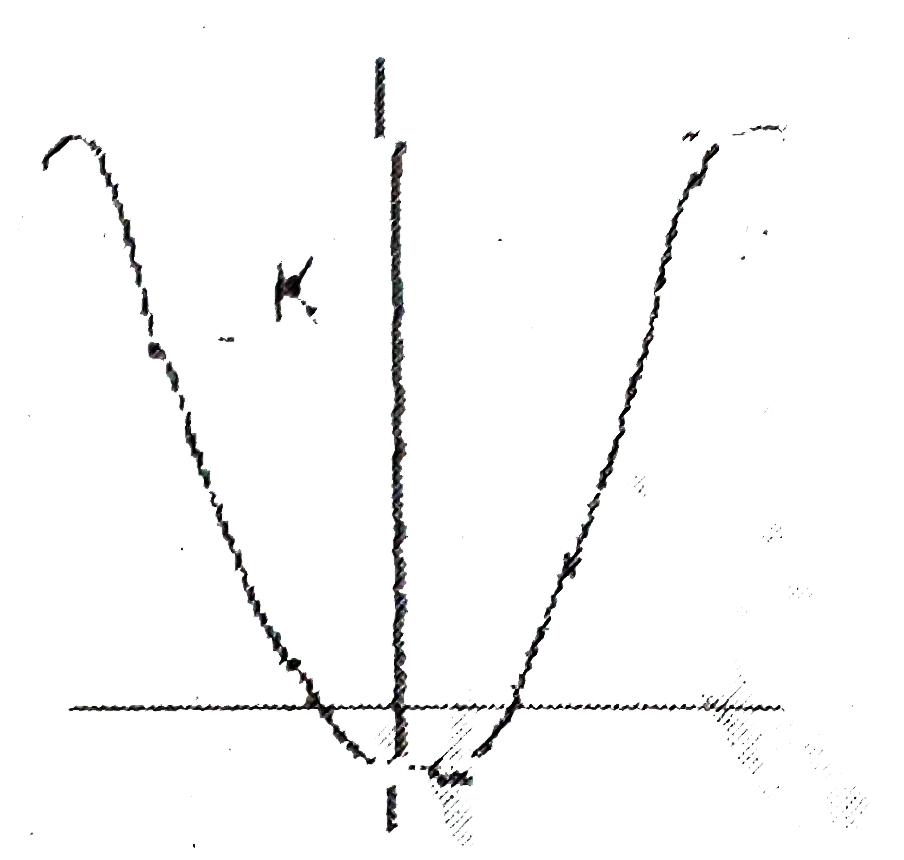
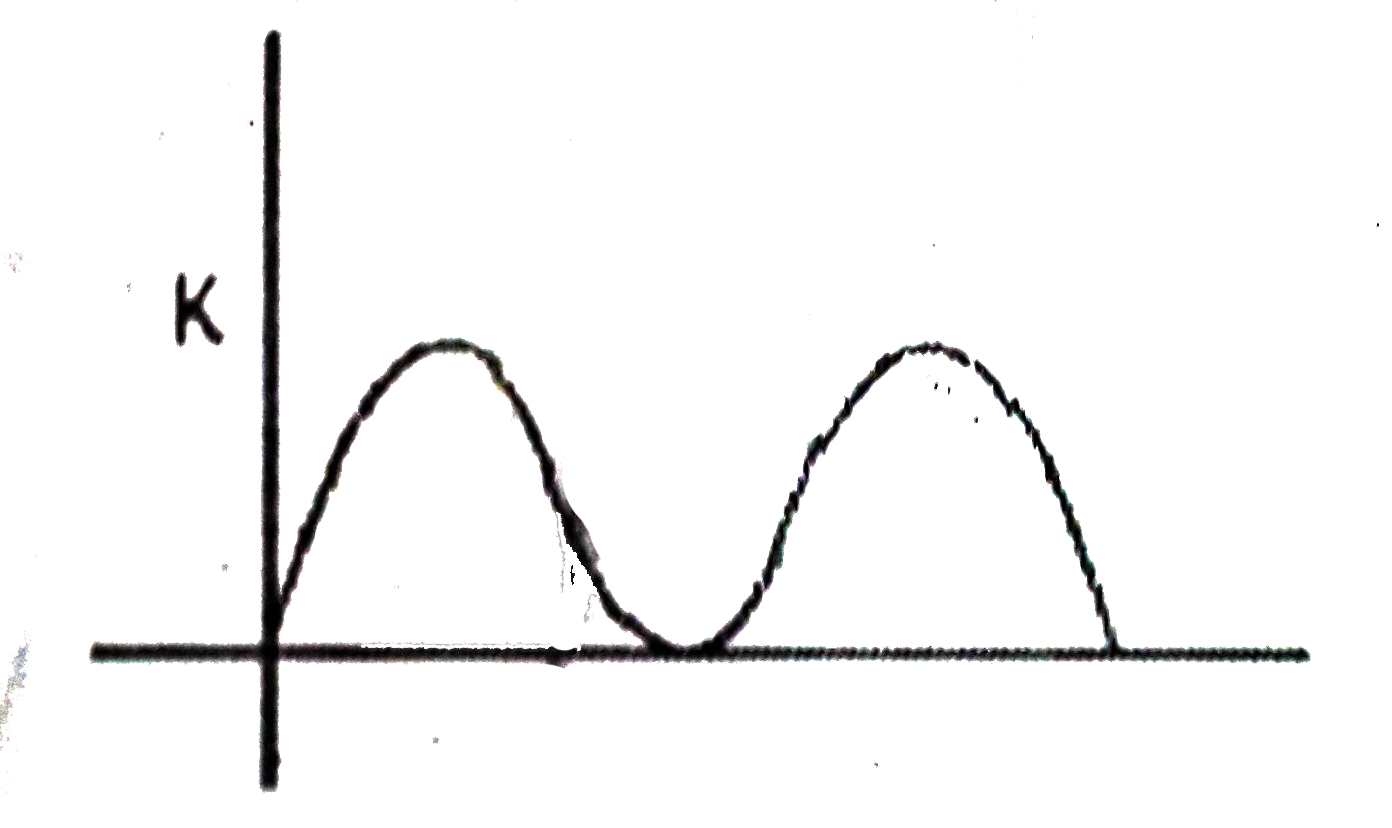
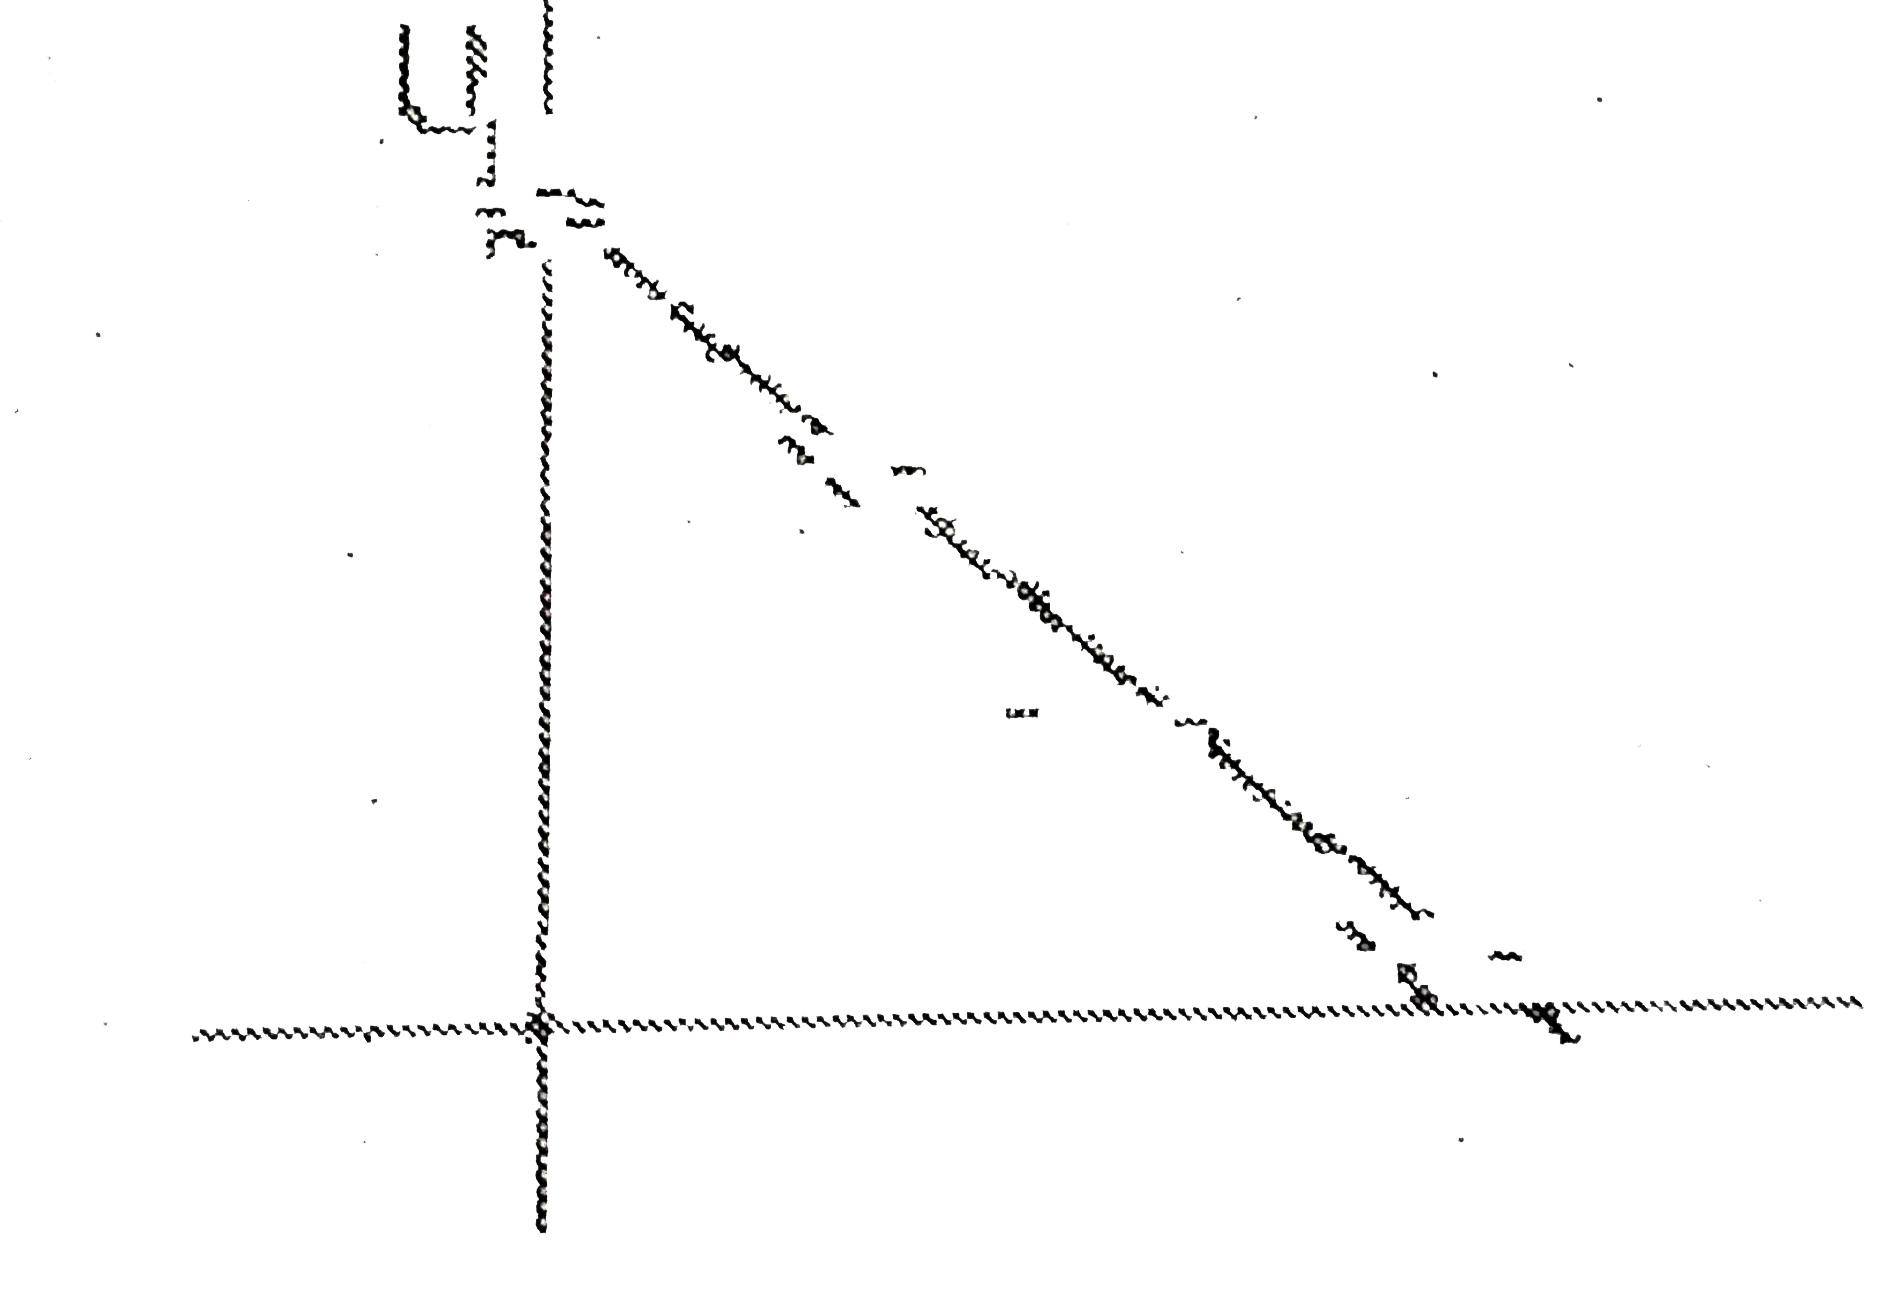
During SHM, a paricle has displacement x form mean position. If accreleration. Kinetic energy and potential energy are represented by a K and U respectively, the choose the appropriate graph


The correct Answer is:C
To solve the question regarding the graphs of kinetic energy (K), potential energy (U), and acceleration (A) during Simple Harmonic Motion (SHM), we can follow these steps:
1. Understand the Motion: In SHM, the displacement x of the particle from the mean position varies sinusoidally with time. The equations governing SHM are:
x(t)=Asin(ωt)
where A is the amplitude and ω is the angular frequency.
2. Find Velocity: The velocity v is the derivative of displacement with respect to time:
v(t)=dxdt=Aωcos(ωt)
3. Find Acceleration: The acceleration a is the derivative of velocity:
a(t)=dvdt=−Aω2sin(ωt)
This indicates that acceleration is maximum when the displacement is maximum and vice versa.
4. Kinetic Energy (K): The kinetic energy of the particle is given by:
K=12mv2=12m(Aωcos(ωt))2=12mA2ω2cos2(ωt)
5. Potential Energy (U): The potential energy in SHM is given by:
U=12kx2=12mω2(Asin(ωt))2=12mA2ω2sin2(ωt)
6. Total Energy: The total mechanical energy E in SHM is constant and is the sum of kinetic and potential energy:
E=K+U=12mA2ω2
7. Graphing the Energies:
- Kinetic Energy K varies as cos2(ωt) which means it reaches maximum when displacement is zero.
- Potential Energy U varies as sin2(ωt) which means it reaches maximum when displacement is maximum.
- The total energy remains constant throughout the motion.
8. Choosing the Correct Graph: Based on the above analysis, we can conclude:
- The graph of kinetic energy will be a cosine squared function (peaks at t=0,T/2,T,…).
- The graph of potential energy will be a sine squared function (peaks at t=T/4,3T/4,…).
- The total energy graph will be a horizontal line since it is constant.
9. Final Selection: After analyzing the options provided, the correct graph will be the one that shows the kinetic energy and potential energy oscillating out of phase with each other, while the total energy remains constant.
x(t)=Asin(ωt)
where A is the amplitude and ω is the angular frequency.
v(t)=dxdt=Aωcos(ωt)
a(t)=dvdt=−Aω2sin(ωt)
This indicates that acceleration is maximum when the displacement is maximum and vice versa.
K=12mv2=12m(Aωcos(ωt))2=12mA2ω2cos2(ωt)
U=12kx2=12mω2(Asin(ωt))2=12mA2ω2sin2(ωt)
E=K+U=12mA2ω2
- Kinetic Energy K varies as cos2(ωt) which means it reaches maximum when displacement is zero.
- Potential Energy U varies as sin2(ωt) which means it reaches maximum when displacement is maximum.
- The total energy remains constant throughout the motion.
- The graph of kinetic energy will be a cosine squared function (peaks at t=0,T/2,T,…).
- The graph of potential energy will be a sine squared function (peaks at t=T/4,3T/4,…).
- The total energy graph will be a horizontal line since it is constant.
Similar Questions
Knowledge Check
The relationship between kinetic energy (K) and potential energy (U) of electron moving in a orbit around the nucleus is
AU=−KBU=−2KCU=−3KDU=−12K
The amgular velocity and the amplitude of a simple pendulum is ω and a respectively. At a displacement x from the mean position, if its kinetic energy is T and potential energy is U, then the ratio of T to U is
View SolutionRatio of kinetic energy at mean position to potential energy at A/2 of a particle performing SHM
View SolutionIn SHM , potential energy of a particle at mean position is E1 and kinetic enregy is E2 , then
View SolutionA particle executing SHM has potential energy U0sin2ωt. The maximum kinetic energy and total energy respectively are
View SolutionDisplacement between maximum potential energy position and maximum kinetic energy position for a particle executing S.H.M is
View SolutionThe potential energy of a particle of mass 2 kg in SHM is (9x2)J. Here x is the displacement from mean position . If total mechanical energy of the particle is 36 J. The maximum speed of the particle is
View SolutionIn S.H.M., potential energy (U) V/s, time (t) . Graph is
View Solution
