The rate constant for the decomposition of N2O5 at various temperatures is given below:
(##KALKLCISCCHEXIIC04SLV051_Q01.png width=80%><br>Drawagraphbetweenlogkand1Tandcalca––tethevaluesofAandEq.Predicttherateconstantat30^@ C and 50^@ C.
To draw the graph between log k and 1Twe may tabulate the given data as follows:

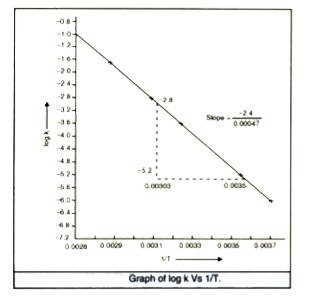
On plotting the data, we get the graph shown in Fig.. From the graph :

slope =−2.40.00047=−Ea2.303R
∴Activation Energy,
Ea=2.4×2.303R0.00047=2.4×2.300×8.314Jmol−10.00047
=97773Jmol−1=97.773KJmol−1
According to Arrhenius equation,
logk=(logA−Ea2.303RT)
orlogk=(−Ea2.303RT)+logA
which is a equation of straight line
(Compare with y=mx+c)
∴logA=−7.2=6.2[y2−y1=−1−(−7.2)]
Frequency factor, A = Antilog 6.2 = 1584893
=1.585×10⁶ collosions s−1
The values of rate constant can be calculated from the graph as follows:

Topper's Solved these Questions
- CHEMICAL KINETICSBOOK - ICSECHAPTER - CHEMICAL KINETICSEXERCISE - PROBLEM
165 Videos
- CHEMICAL KINETICSBOOK - ICSECHAPTER - CHEMICAL KINETICSEXERCISE - INTEXT QUESRTIONS
81 Videos
- BIOMOLECULESBOOK - ICSECHAPTER - BIOMOLECULESEXERCISE - ISC EXAMINATION QUSTIONS (PART-I)(DESCRIPTIVE QUESTIONS)
21 Videos
- CHEMISTRY IN EVERYDAY LIFEBOOK - ICSECHAPTER - CHEMISTRY IN EVERYDAY LIFEEXERCISE - EXERCISE (PART - II (DESCRIPTIVE QUESTIONS) (LONG ANSWER QUESTIONS))
19 Videos
Similar Questions
The rate constant for the decomposition of N2O5 at various temperatures
is given below:

Draw a graph between ln k and 1/T and calculate the values of A and
Ea. Predict the rate constant at 30∘ and 50∘C.
View SolutionThe rate constant for the decomposition of N2O5 at various temperatures is given below:

Draw a graph beetween In k and 1/T and calculate the values of A and Ea. Predict the rate constant at 30∘ and 50∘C
View SolutionThe experimental data for decomposition of
N2O5[2N2O5→4NO2+O2]
in gas phase at 318 K are given below:
(##KALKLCISCCHEXIIC04SLV027_Q01.png width=80%><br>Drawagraphbetweenlog [N_2 O_5] and t .
View SolutionThe experimental data for decomposition of
N2O5[2N2O5→4NO2+O2]
in gas phase at 318 K are given below:
(##KALKLCISCCHEXIIC04SLV027_Q01.png width=80%><br>Drawagraphbetweenlog [N_2 O_5] and t .
View SolutionThe experimental data for decomposition of
N2O5[2N2O5→4NO2+O2]
in gas phase at 318 K are given below:
(##KALKLCISCCHEXIIC04SLV027_Q01.png width=80%><br>Drawagraphbetweenlog [N_2 O_5] and t .
View SolutionThe experimental data for decomposition of
N2O5[2N2O5→4NO2+O2]
in gas phase at 318 K are given below:
(##KAL_KLC_ISC_CHE_XII_C04_SLV_028_Q01.png" width="80%">
What is rate law?
View SolutionThe experimental data for decomposition of
N2O5[2N2O5→4NO2+O2]
in gas phase at 318 K are given below:
(##KAL_KLC_ISC_CHE_XII_C04_SLV_028_Q01.png" width="80%">
What is rate law?
View SolutionThe experimental data for decomposition of
N2O5[2N2O5→4NO2+O2]
in gas phase at 318 K are given below:
(##KAL_KLC_ISC_CHE_XII_C04_SLV_028_Q01.png" width="80%">
What is rate law?
View SolutionThe experimental data for decomposition of
N2O5[2N2O5→4NO2+O2]
in gas phase at 318 K are given below:
(##KAL_KLC_ISC_CHE_XII_C04_SLV_029_Q01.png" width="80%">
Calculate the rate constant.
View SolutionThe experimental data for decomposition of
N2O5[2N2O5→4NO2+O2]
in gas phase at 318 K are given below:
(##KAL_KLC_ISC_CHE_XII_C04_SLV_029_Q01.png" width="80%">
Calculate the rate constant.
View Solution
