Draw a diplacement-time graph for the data given below with respect to a particle moving in a straight line

Step by step video & image solution for Draw a diplacement-time graph for the data given below with respect to a particle moving in a straight line by Physics experts to help you in doubts & scoring excellent marks in Class 8 exams.
Updated on:21/07/2023Similar Questions
Knowledge Check
The displacment-time graph of a particle moving with respect to a reference point is a straight line
Athe reference point is stationary with zero velocity.Bthe accleration of the object is zeroCbody moves with uniform velocityDall the aboveFrom athe velocity time graph, given in of a particle moving in a straight line, one can conclude that
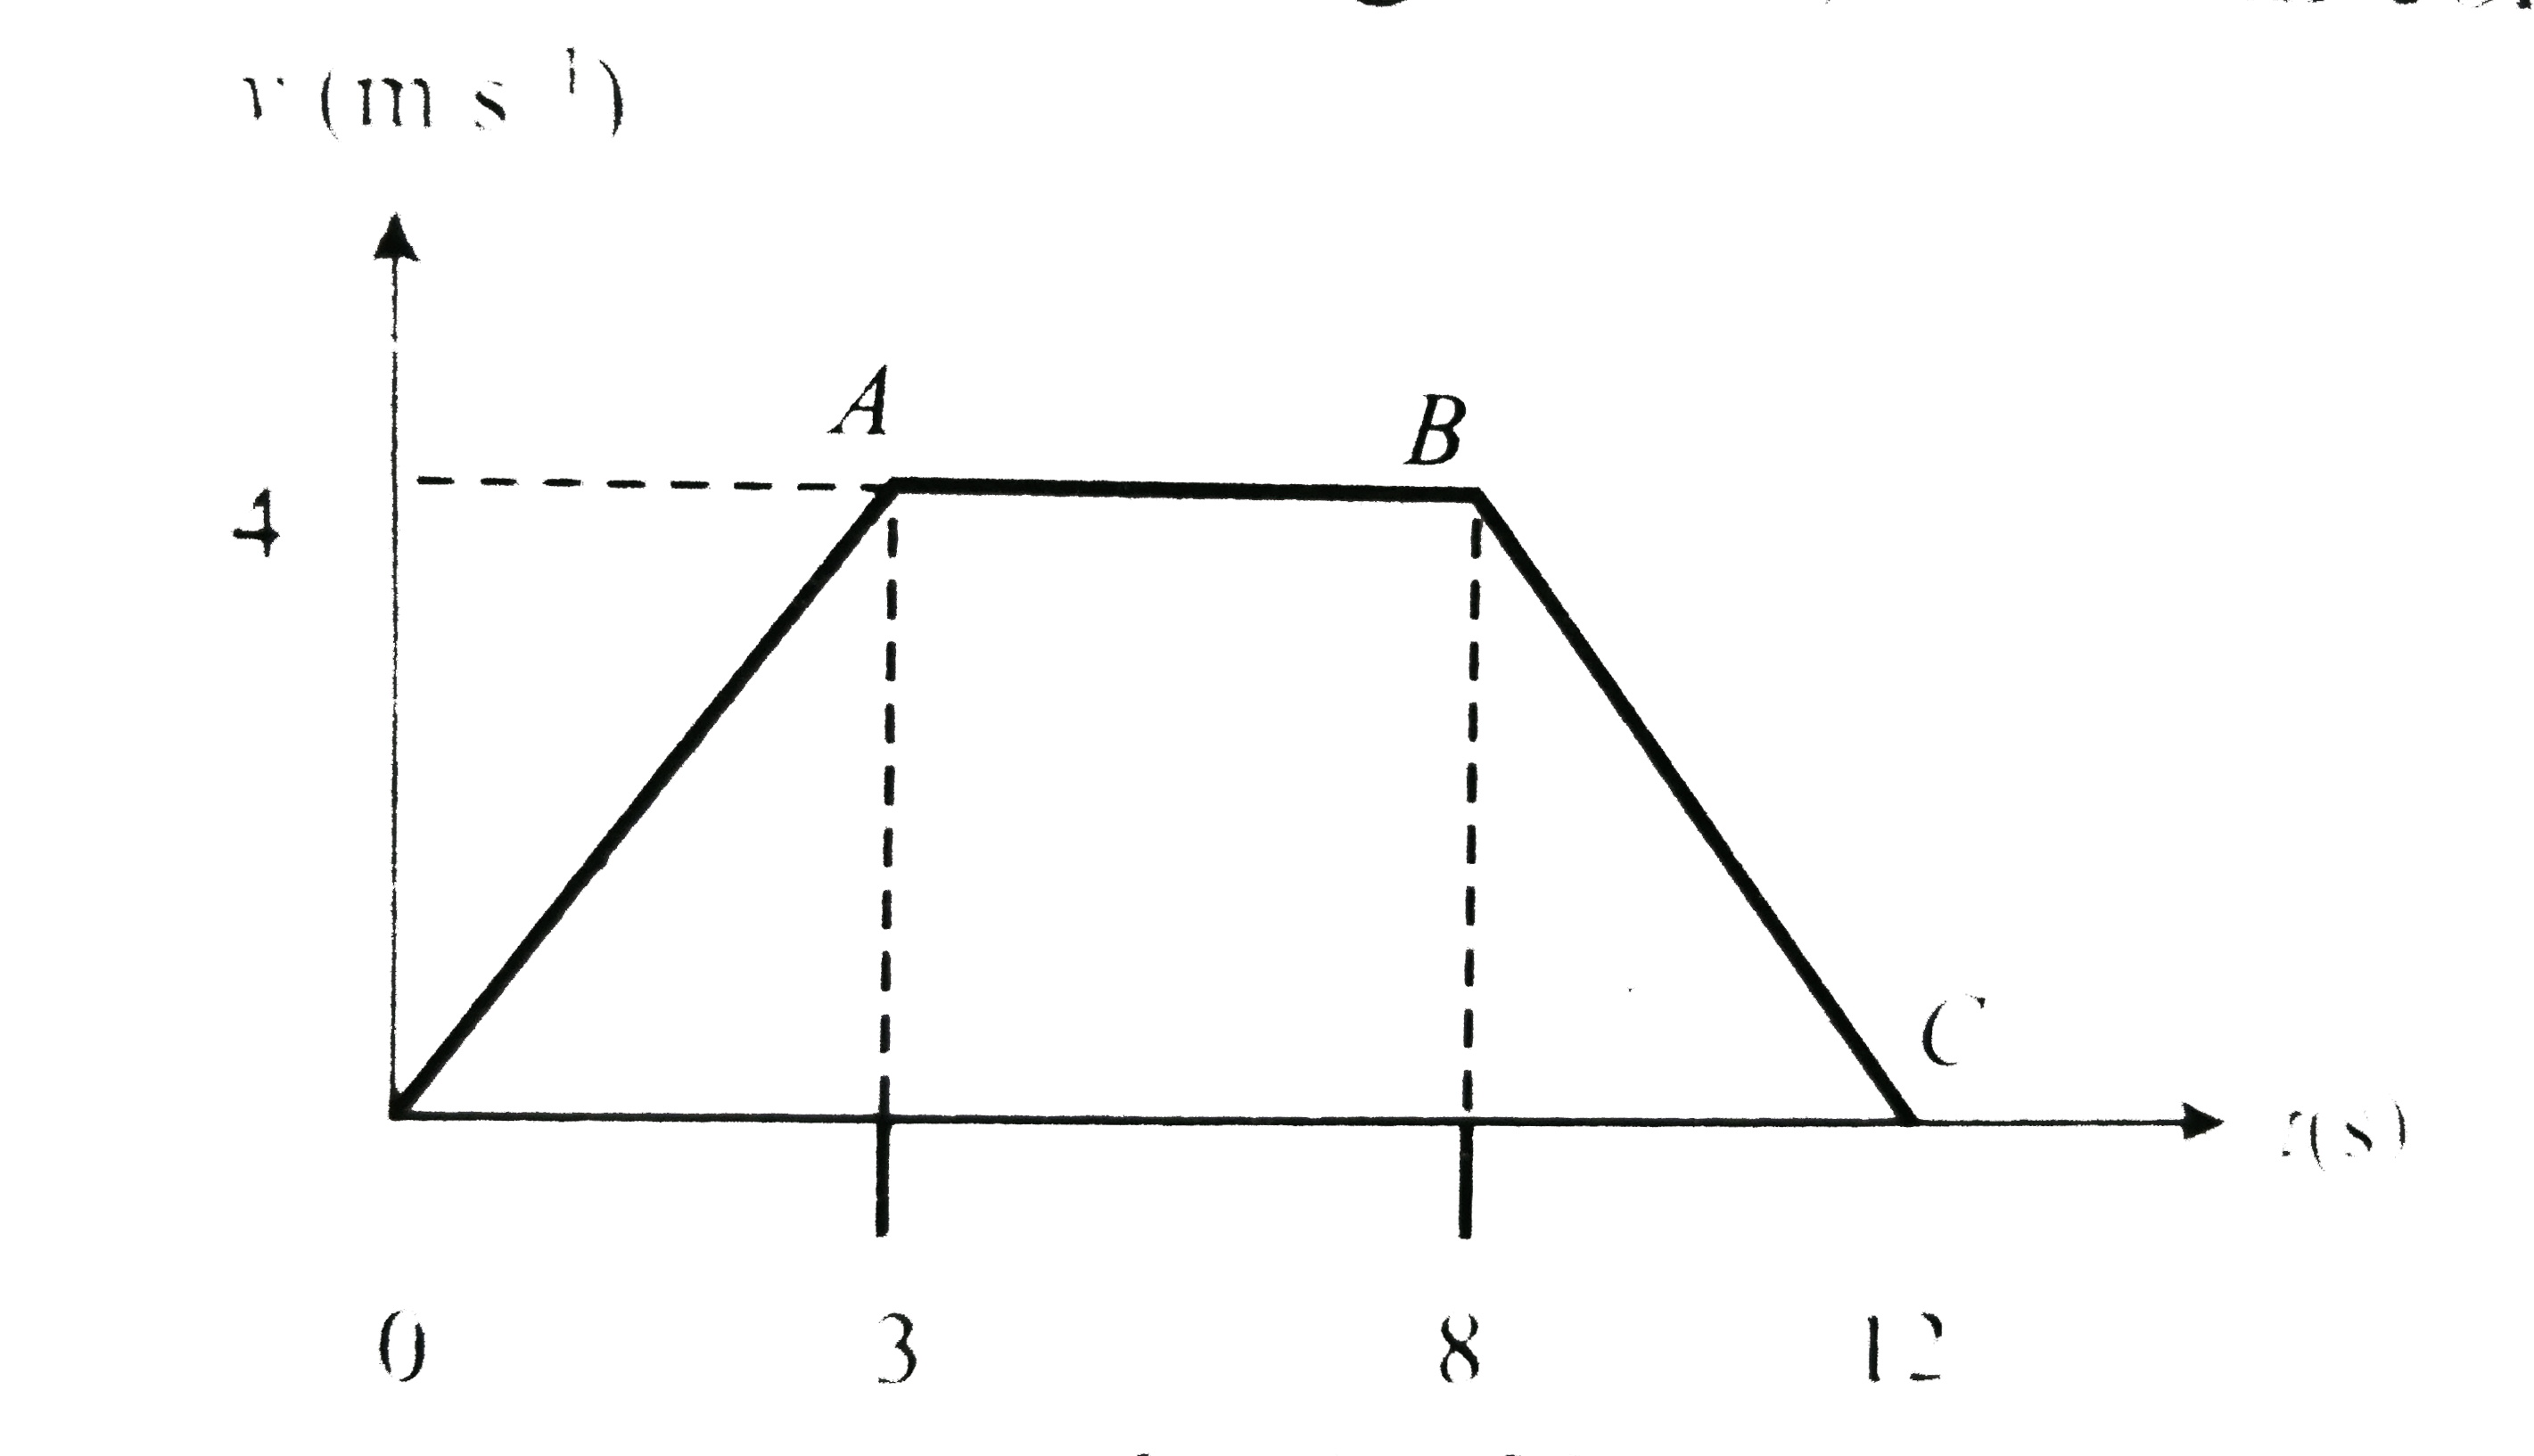 .AIts average velocity during the 12s interval is 24/7ms−1.BIts velocity for the first 3s is uniform and is eual to 4ms−1.CThe body has a constant acceleration between t=3s and t=8s.DThe body has a uniform retardation from t=8s to t=12s.
For which of the following graphs the average velocity of a particl moving along a straight line for time interval (0,t) must be negative−
A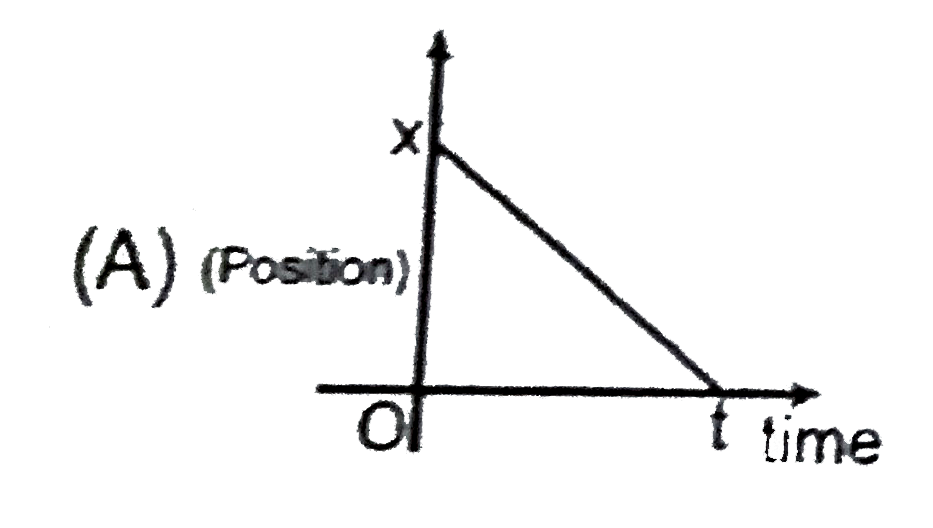 B
B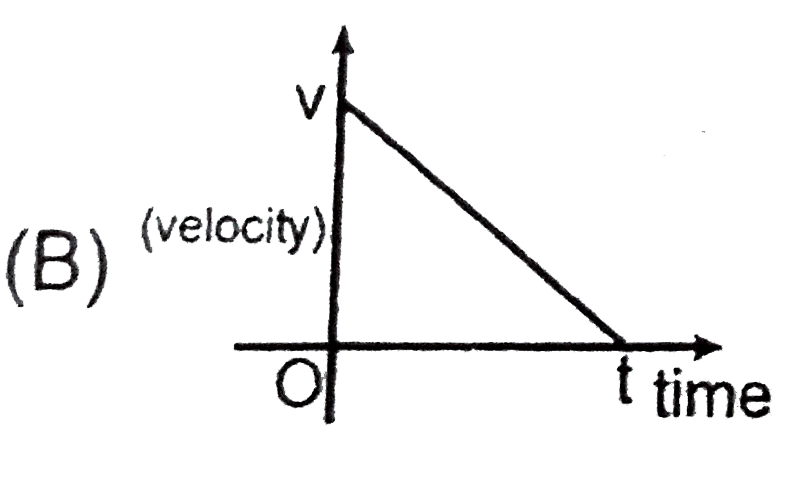 C
C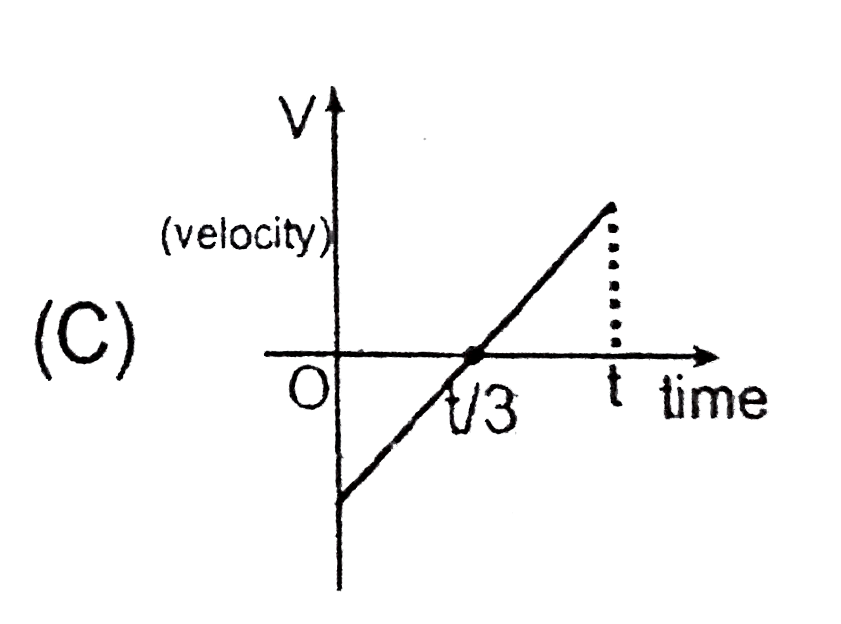 D
D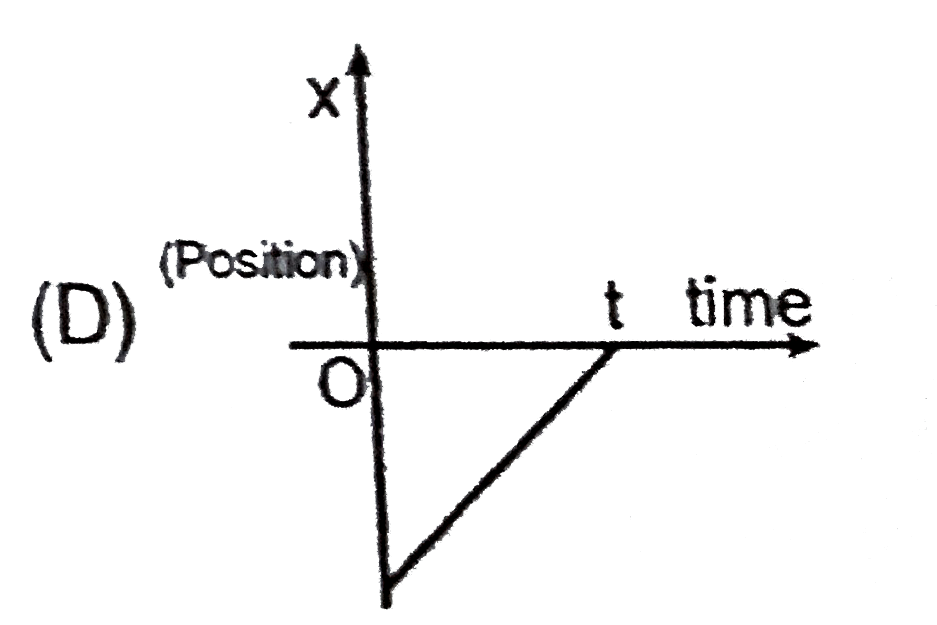
The diagram shows the displacement - time graph for a particle moving in a straight line. The distance (in m) coverted by the particle in the time interval t=0 to t=5s is
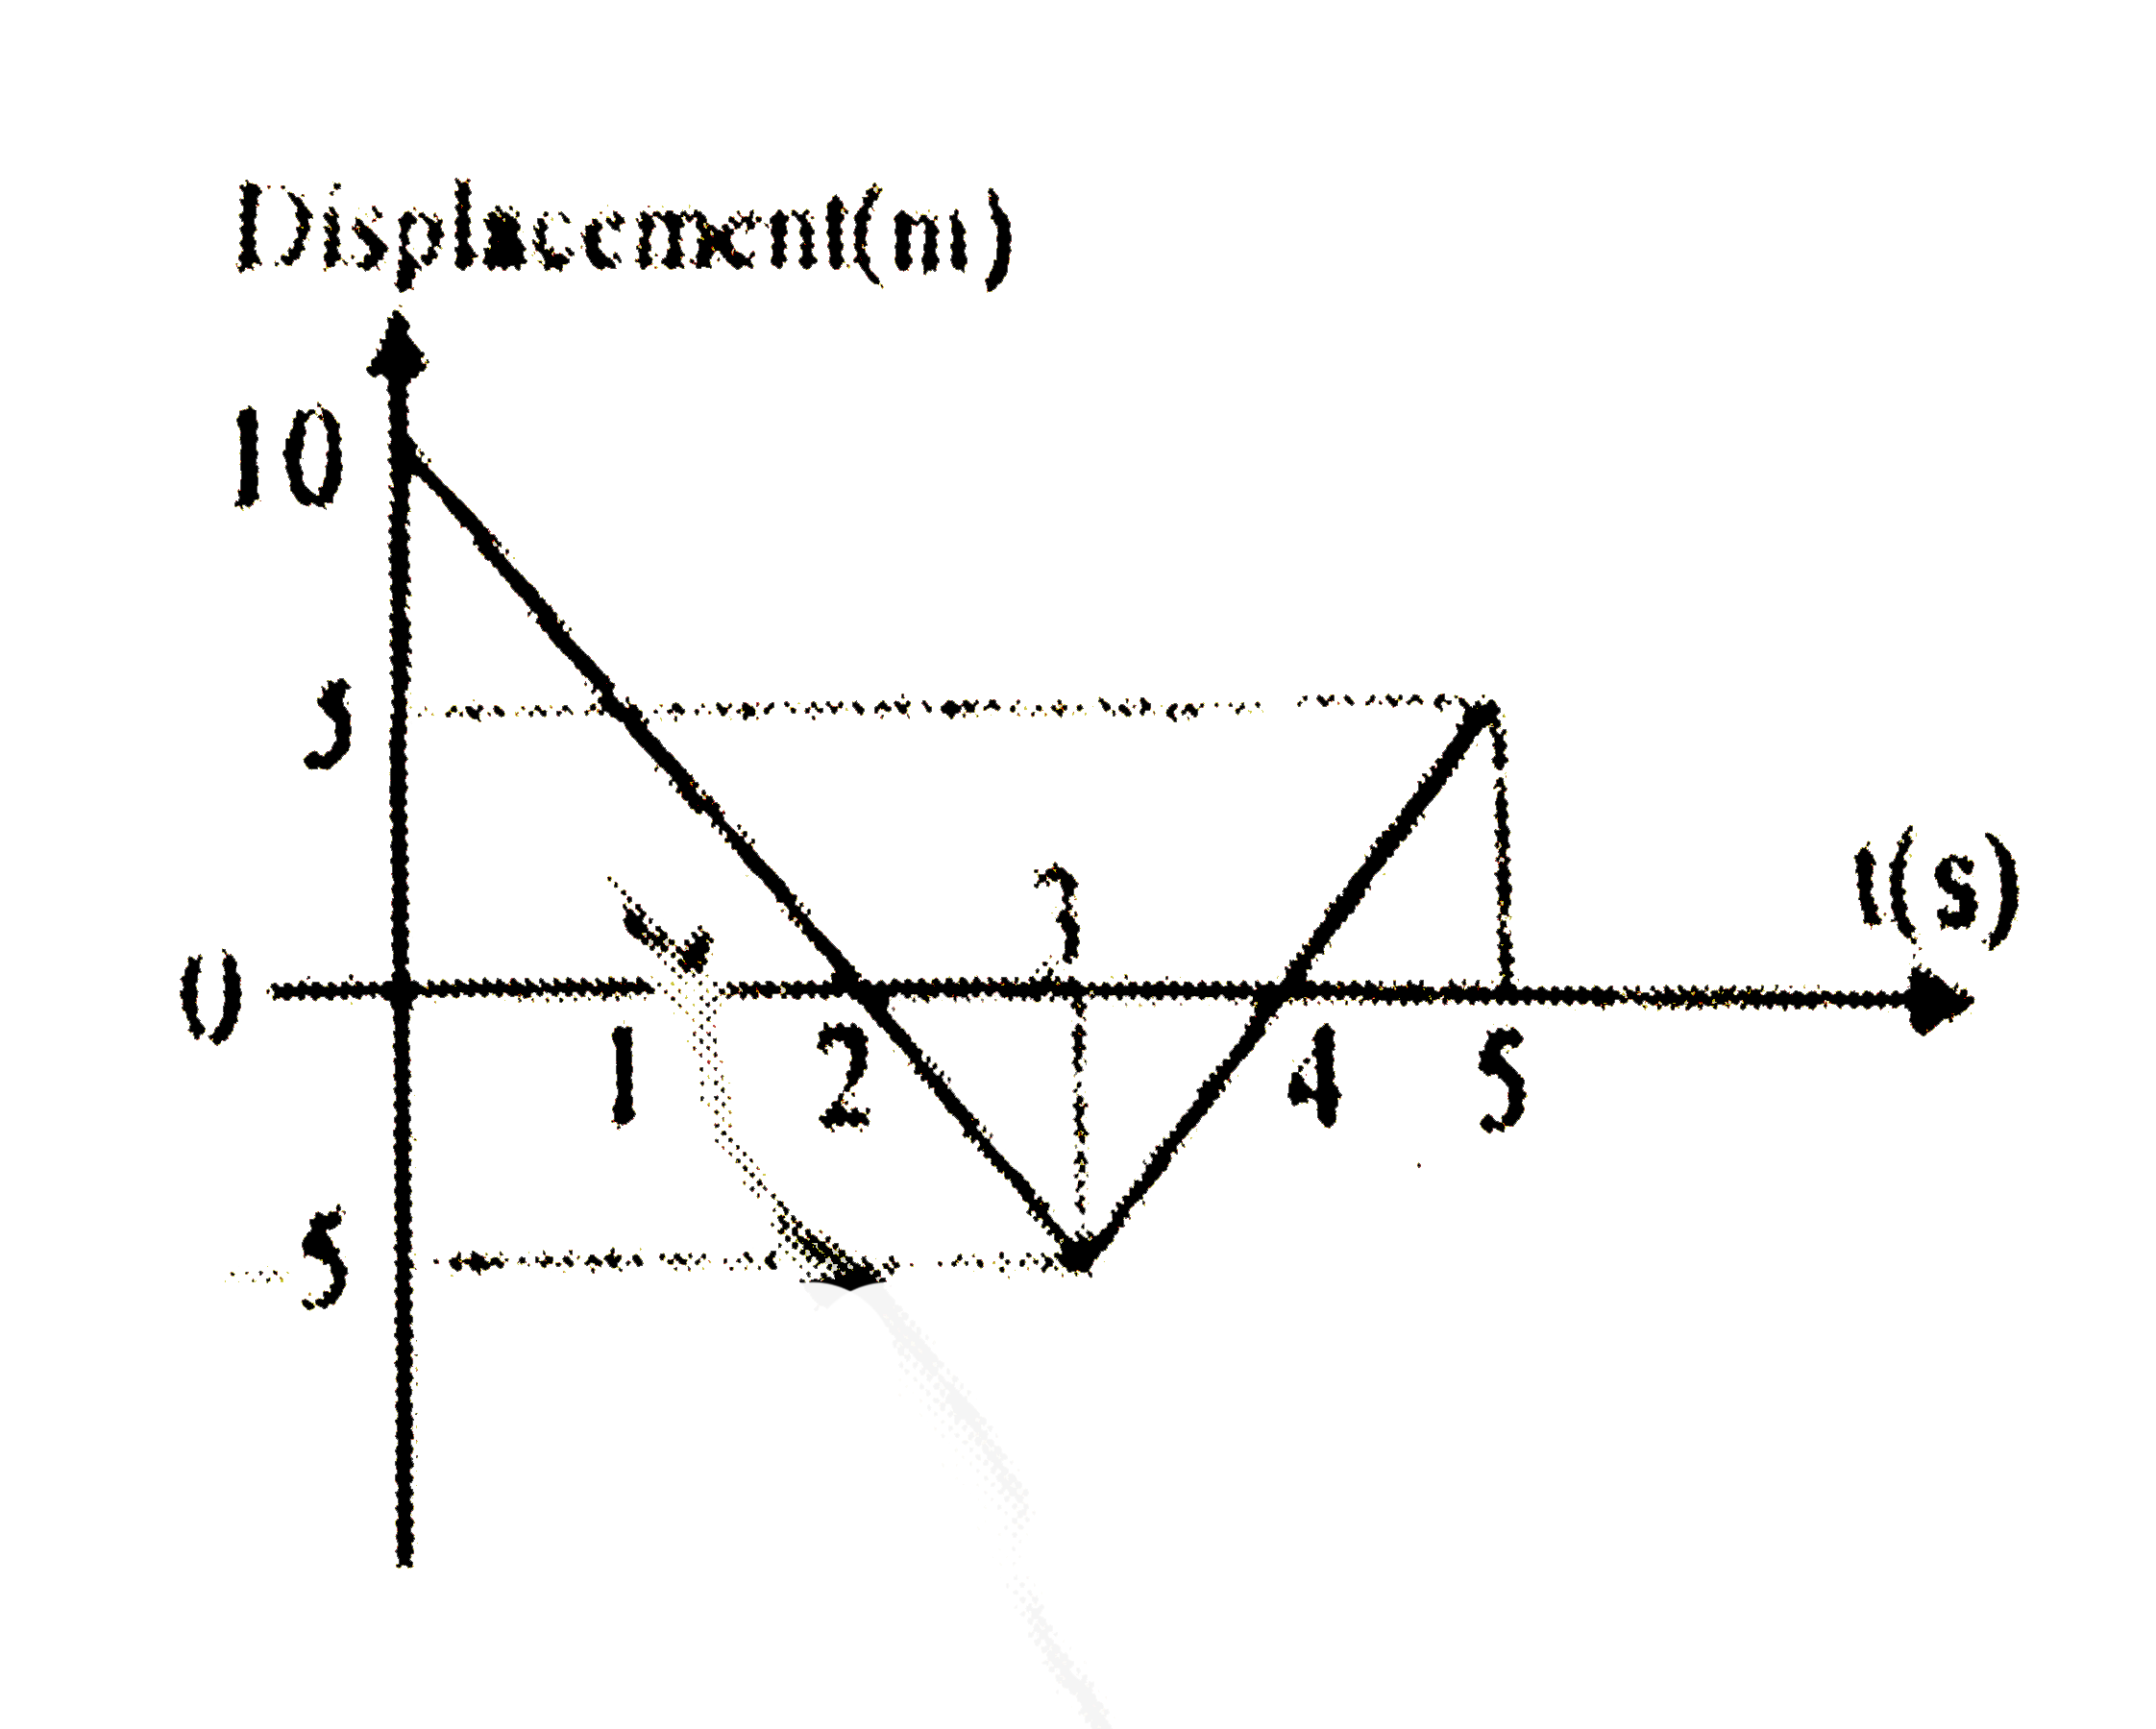
View SolutionThe distance-time graph of a particle moving along a curved path is a straight line .
View SolutionDisplacement (s)-time (t) graphs of two particles moving in a straight line along the X-axis are shown below: It may be stated that the

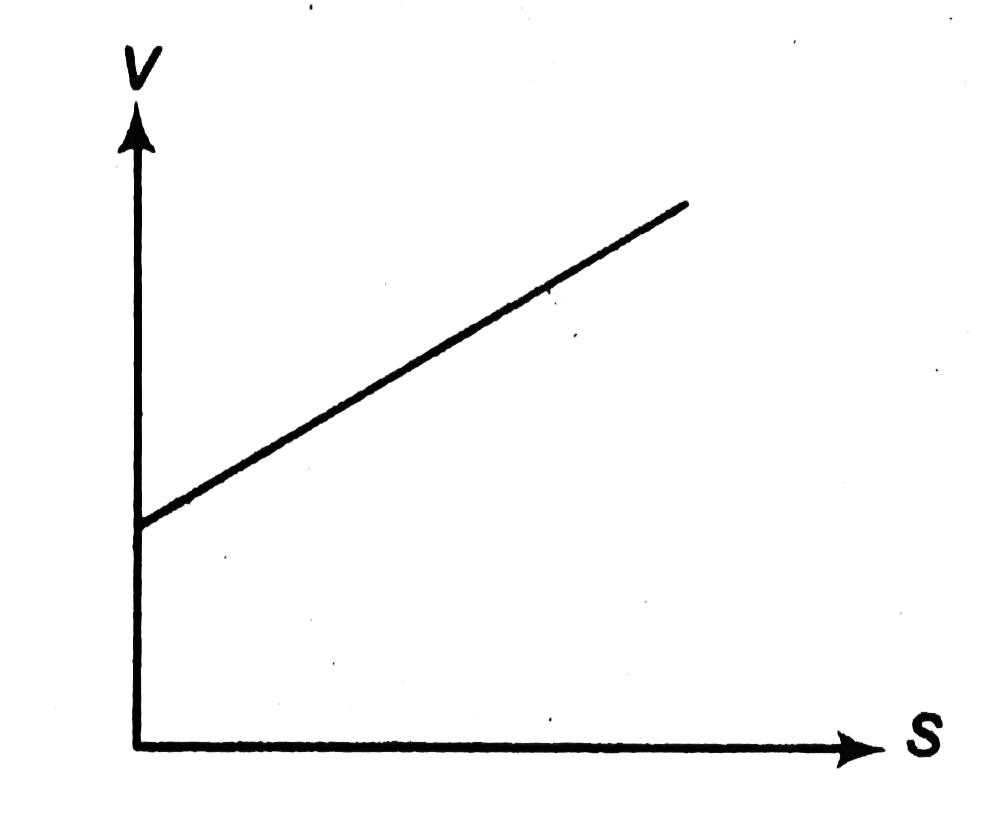
View SolutionVelocity displacement graph of a particle moving in a straight line is as shown in figure.

View SolutionDisplacement time graph of a particle moving in a straight line is a shown in figure.

View Solution


