The diagram shows the displacement - time graph for a particle moving in a straight line. The distance (in m) coverted by the particle in the time interval t=0 to t=5s is
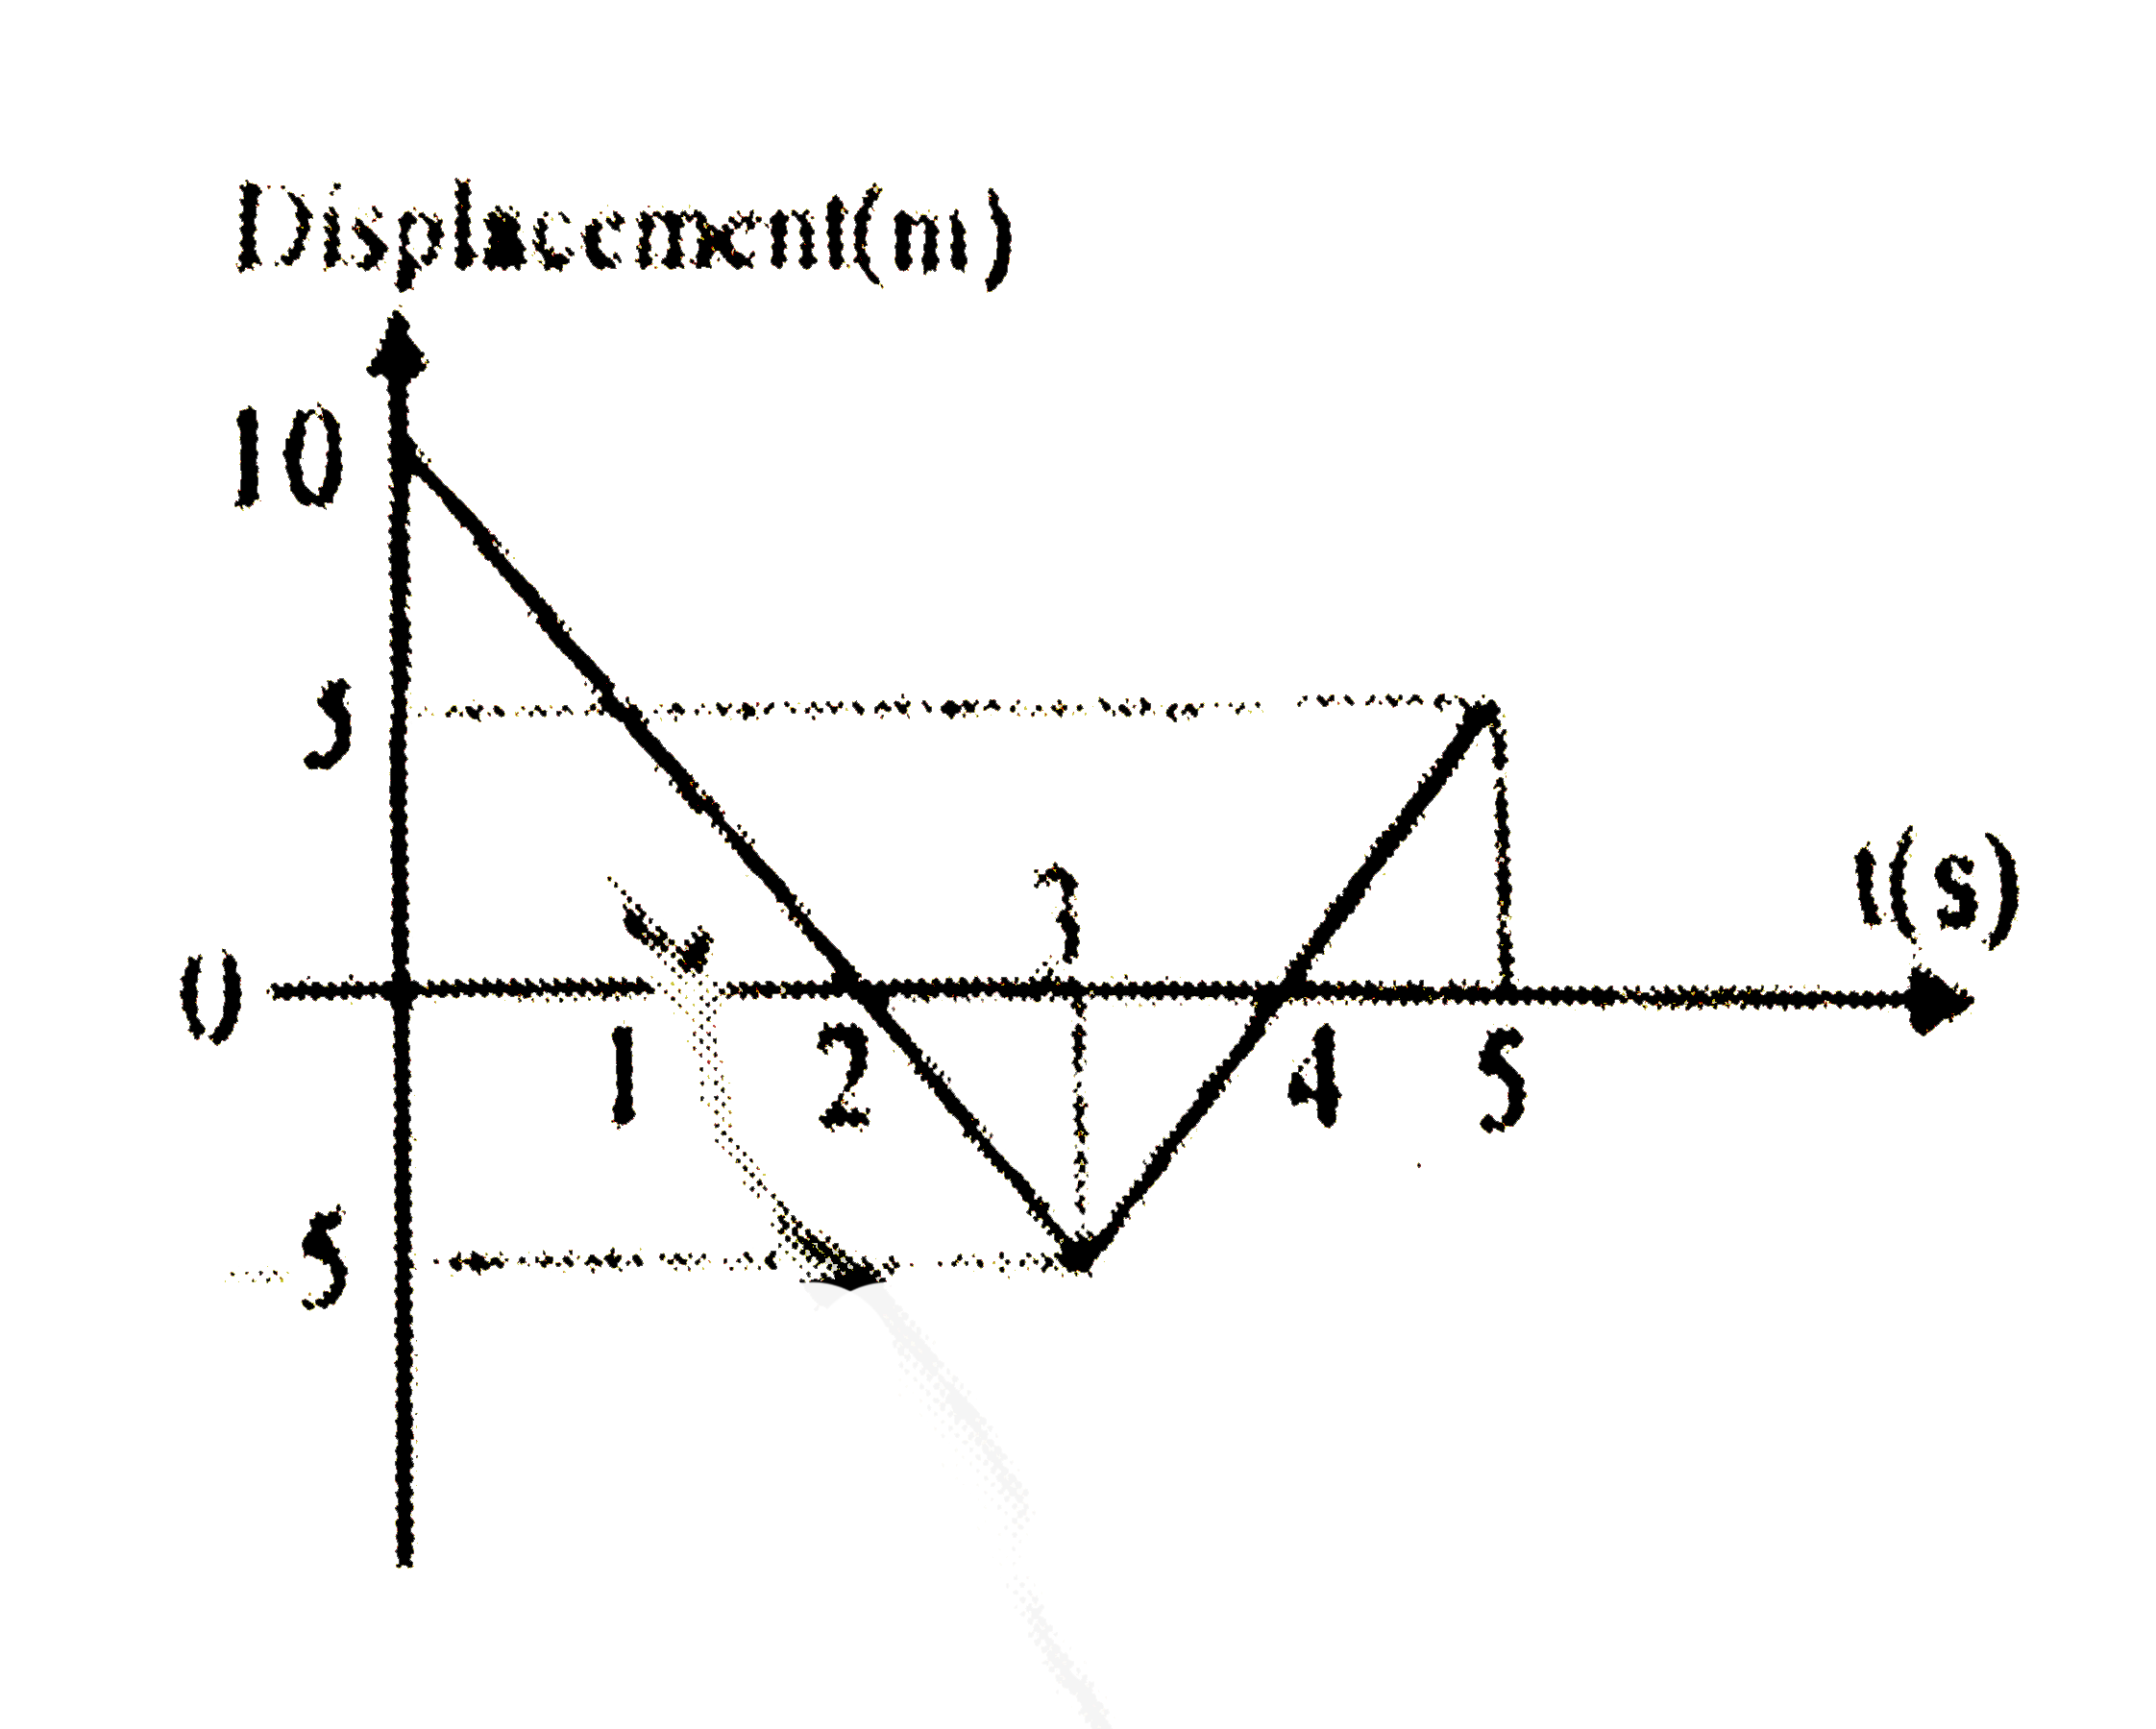
Step by step video & image solution for The diagram shows the displacement - time graph for a particle moving in a straight line. The distance (in m) coverted by the particle in the time interval t=0 to t=5s is by Maths experts to help you in doubts & scoring excellent marks in Class 12 exams.
Updated on:21/07/2023Topper's Solved these Questions
Similar Questions
The diagram shows the displacement-time graph for the particle moving in a straight line. What is average speed (in m/s) for the interval 0-10 s?
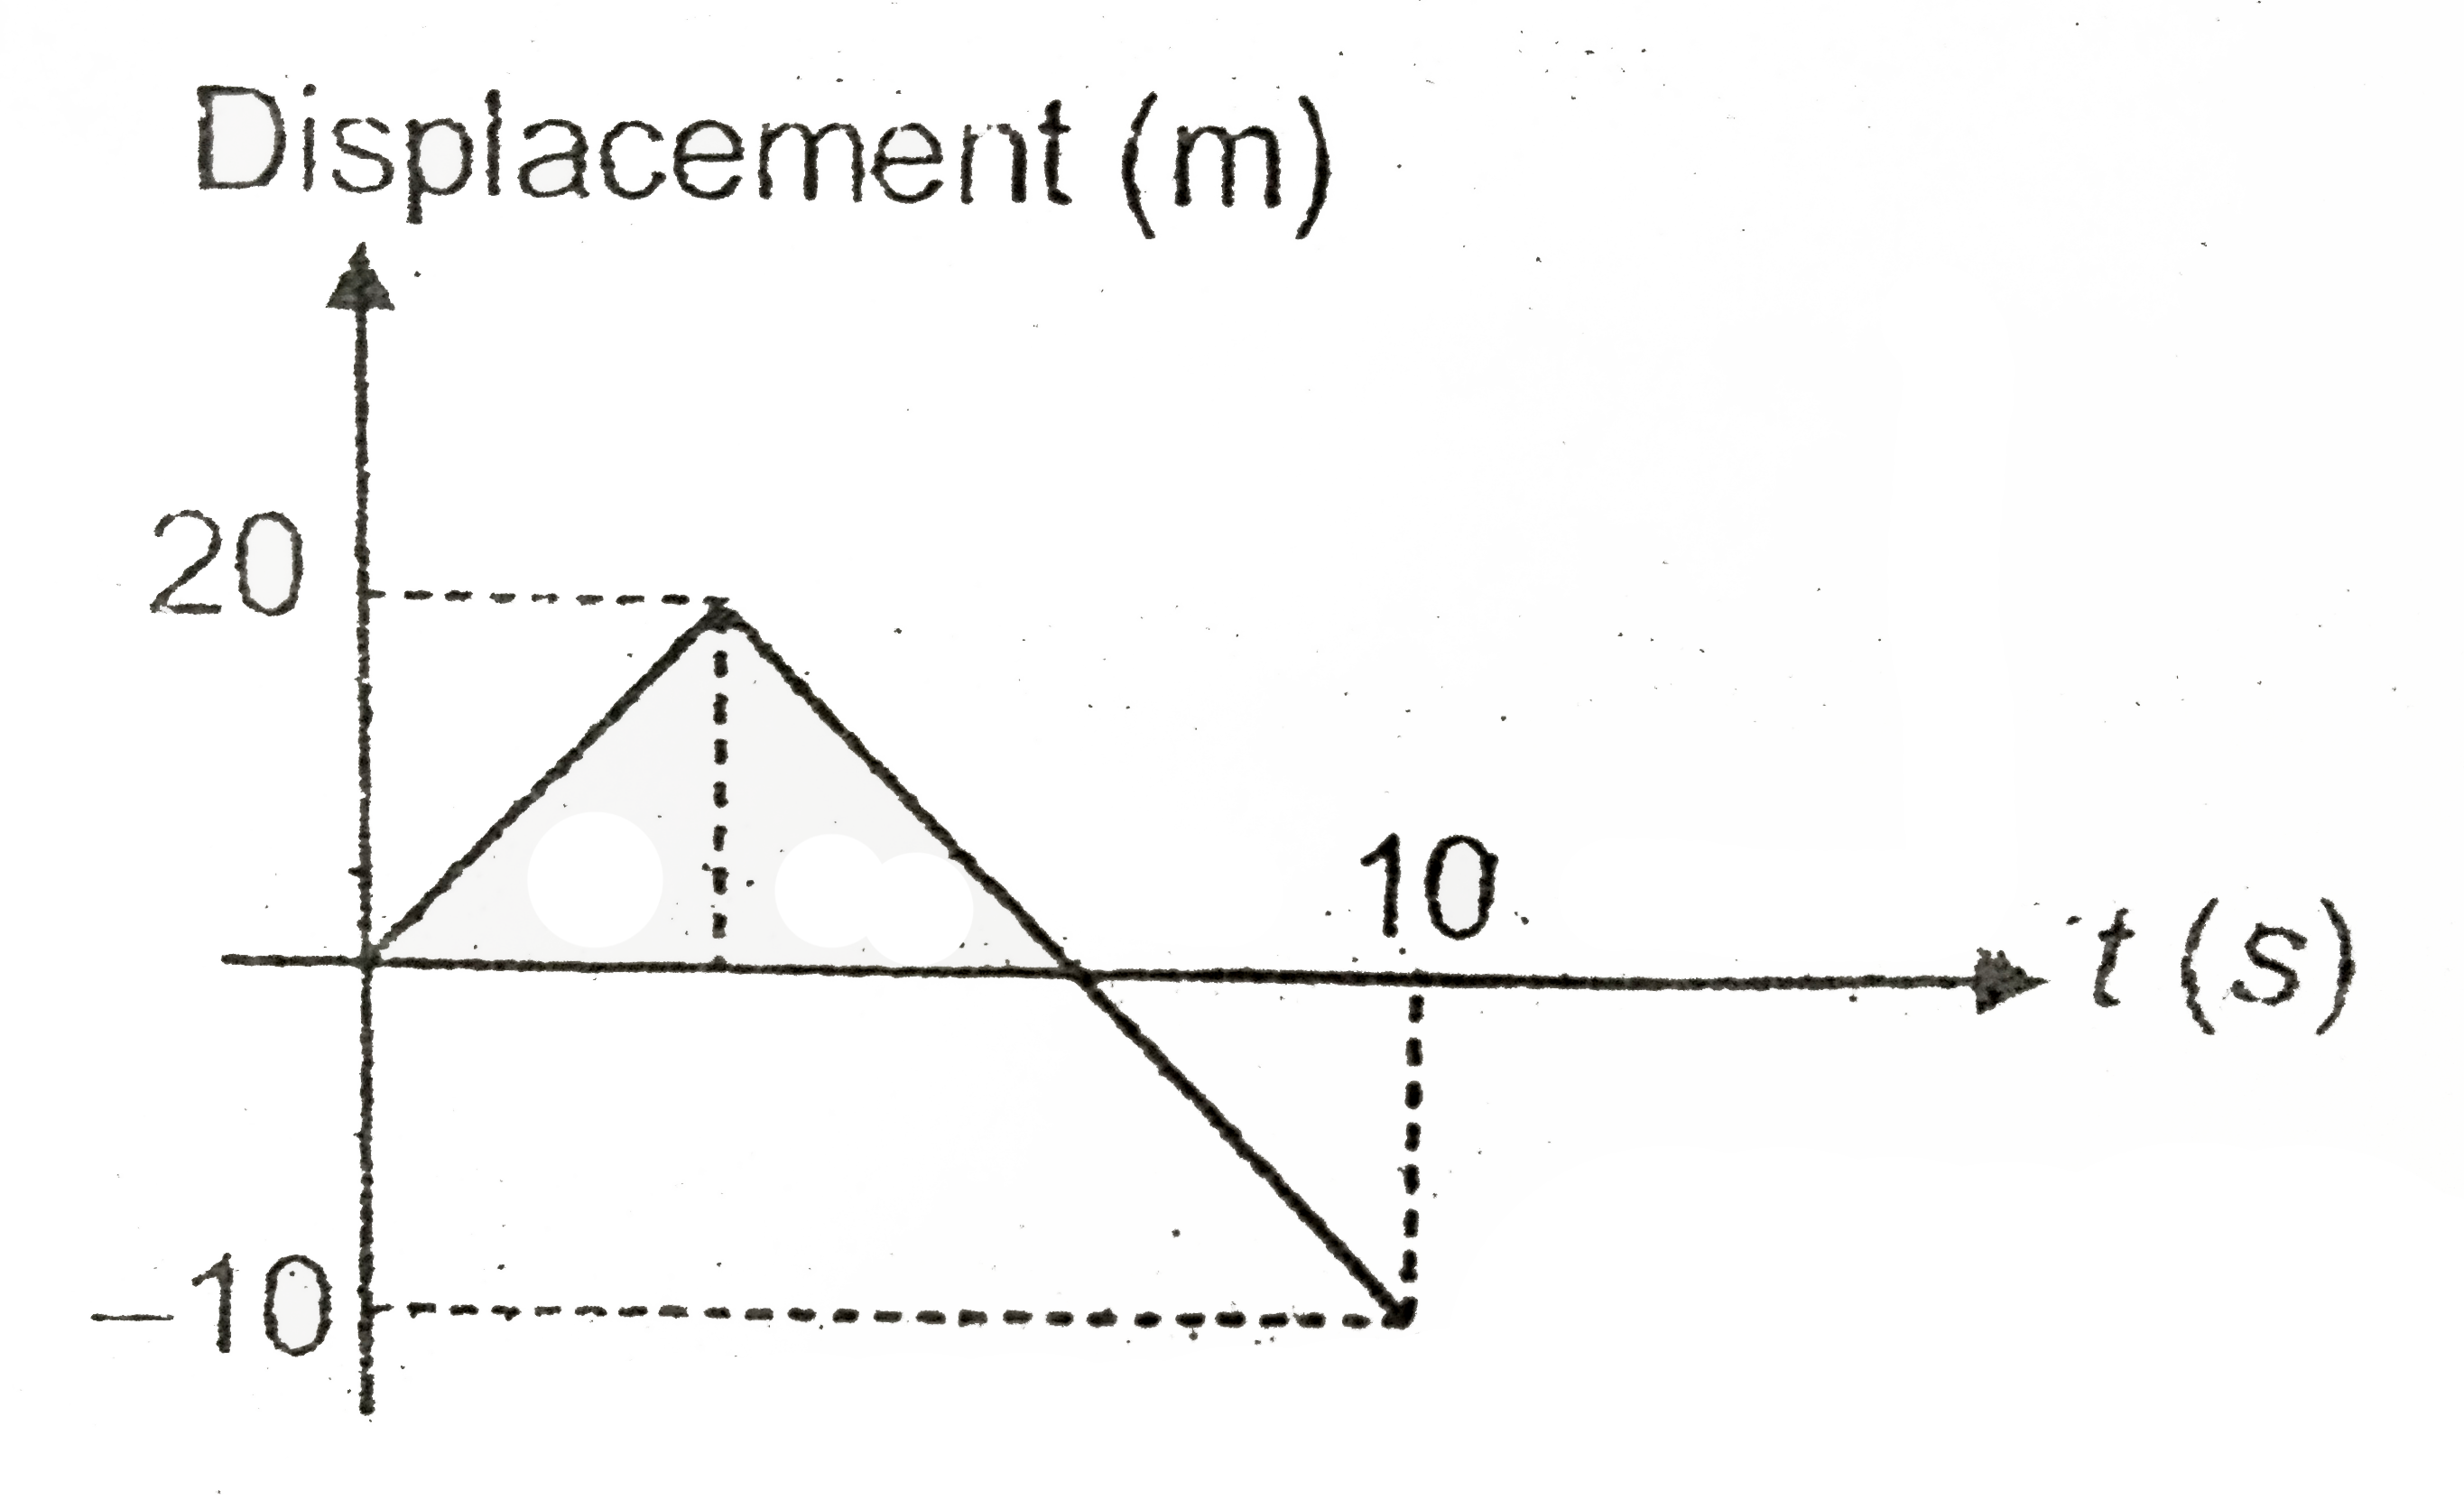
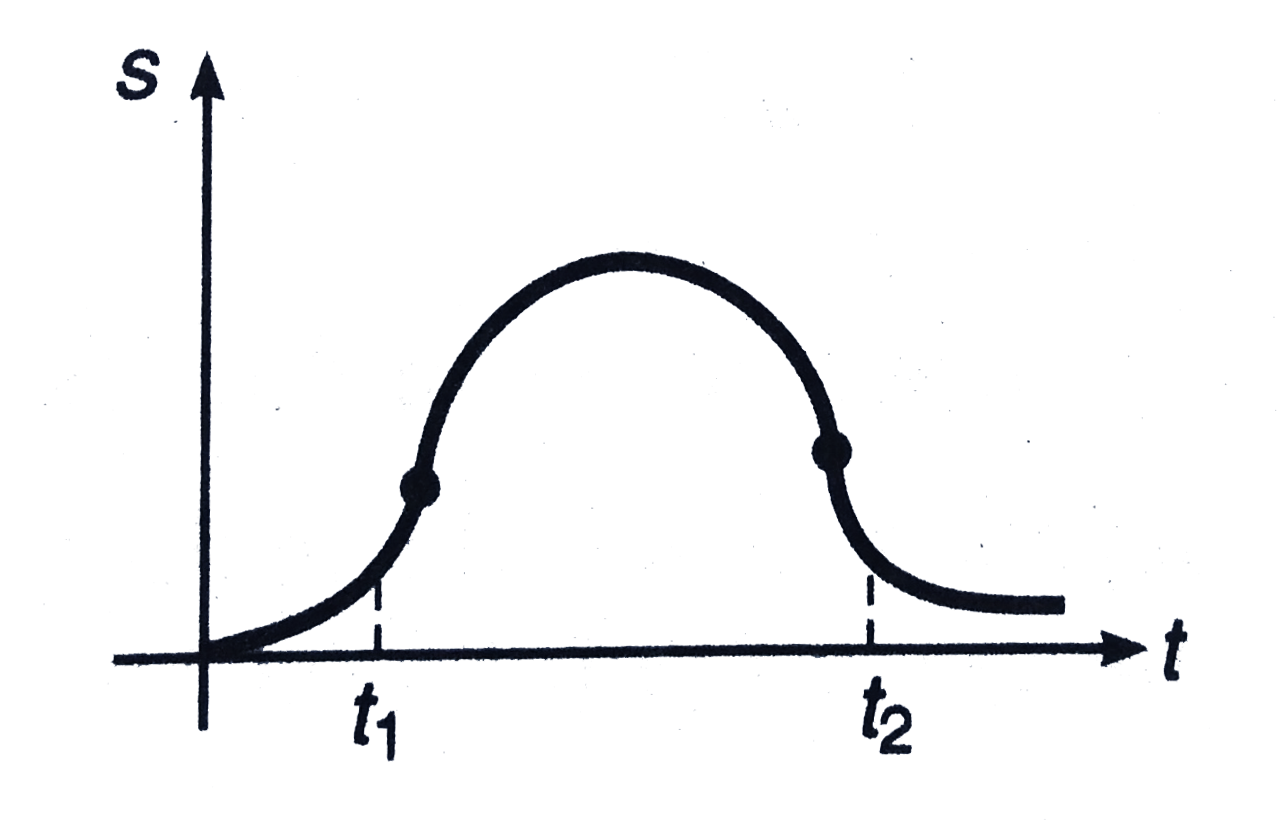
View SolutionFigure shows the displacement-time graph of a particle moving in a straight line. Find the signs of velocity and acceleration of particle at time t=t1andt=t2.
View Solution
Knowledge Check
Displacement time graph of a particle moving in a straight line is a shown in figure.
 Ain region A acceleration is positiveBin region B acceleration is negativeCin region C acceleration is positiveDin region D acceleration is negative
The figure shows a velocity-time graph of a particle moving along a straight line
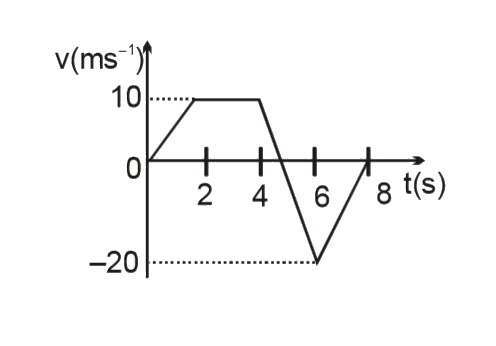
Q. The total distance travelled by the particle isA66.6 mB51.6 mCzeroD36.6mThe figure shows a velocity-time graph of a particle moving along a straight line
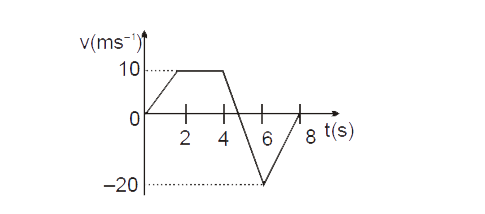
The total distance travelled by the particle isA66.6 mB51.6 mCzeroD36.6m
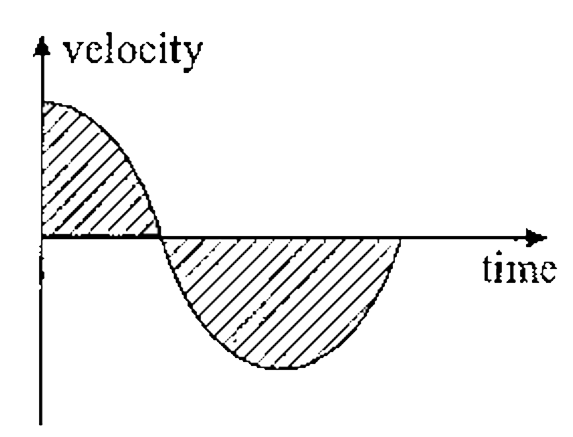
The diagram shows the velocity-time graph for a particle moving in a straight line. The sum of the two shaded areas represents :
View SolutionThe diagram shows the displacement-time graph for a particle moving in a straight line. Find the average velocity for the interval from t=0 to t=5s.
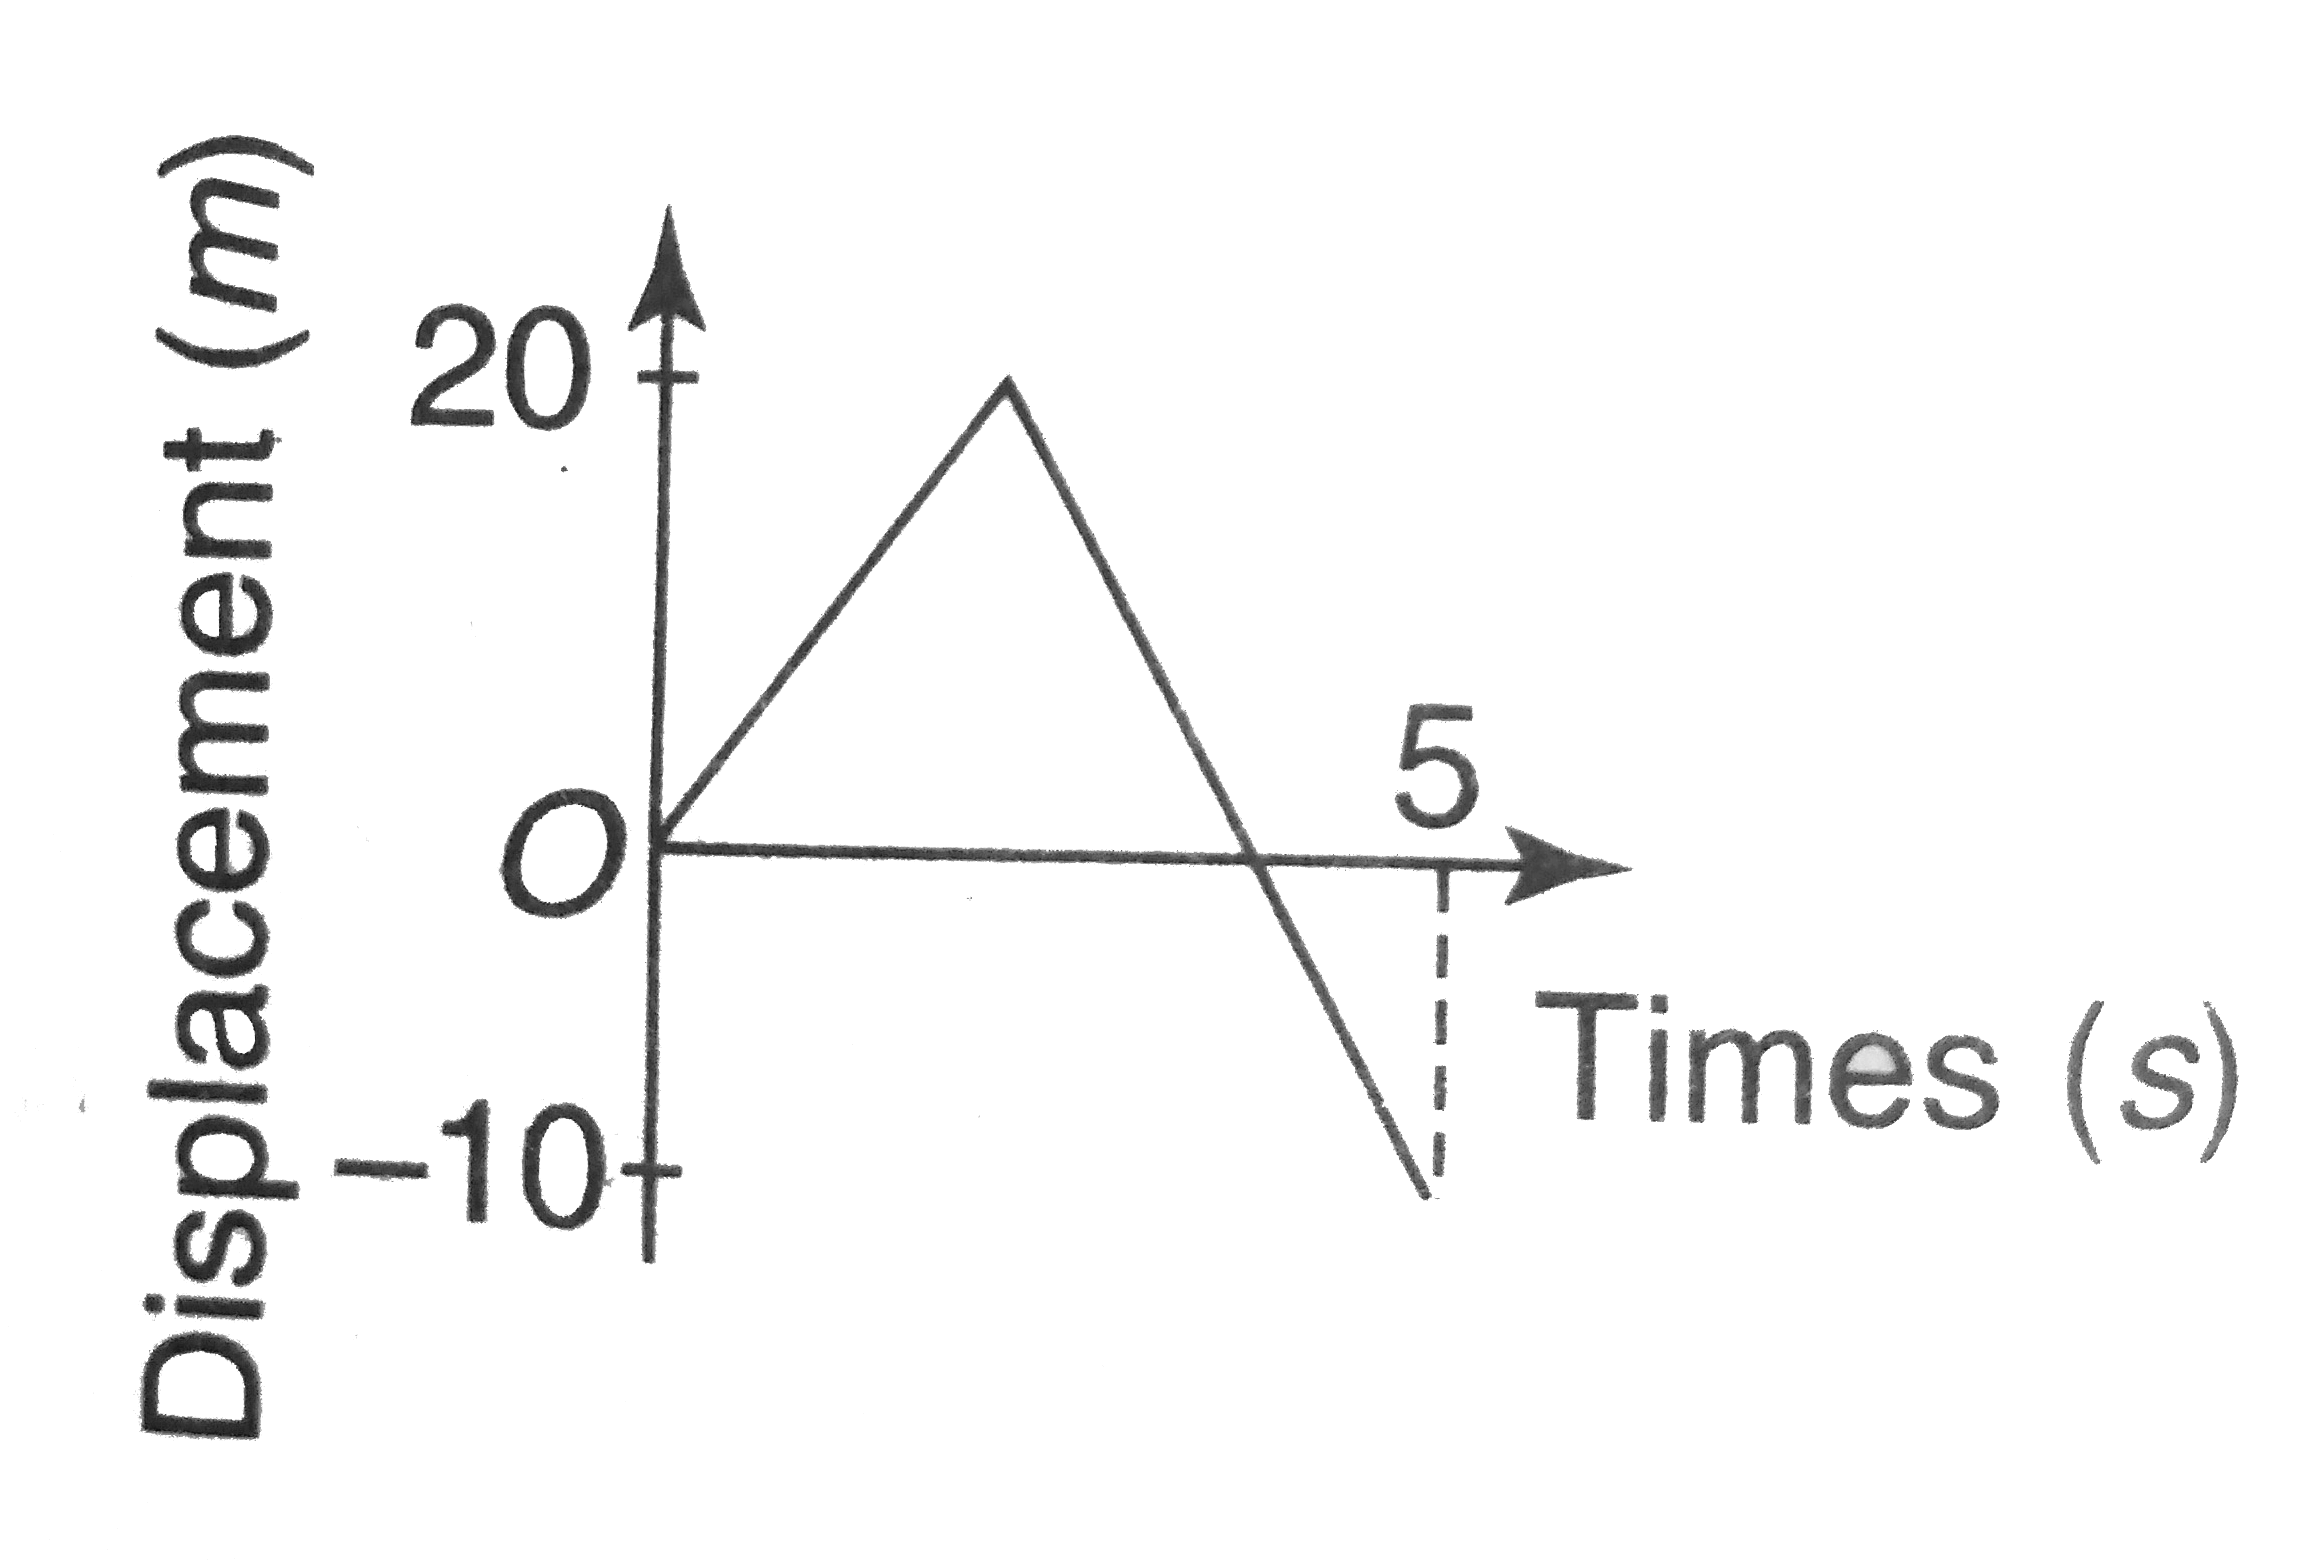
View SolutionThe diagram shows the displacement-time graph for a particle moving in a straight line. Find the average velocity for the interval from t=0 to t=5s.

View SolutionThe figure shows a velocity-time graph of a particle moving along a straight line
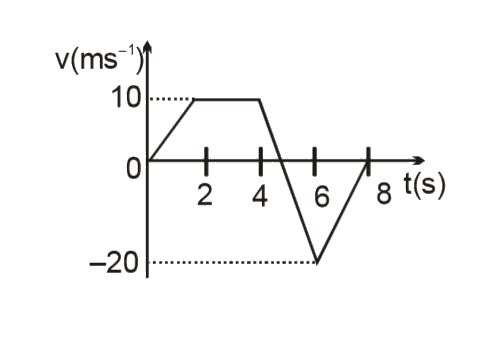
Q. The maximum of displacement of the particle is
View SolutionThe figure shows a velocity-time graph of a particle moving along a straight line
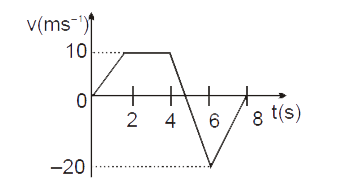
The maximum of displacement of the particle is
View Solution
