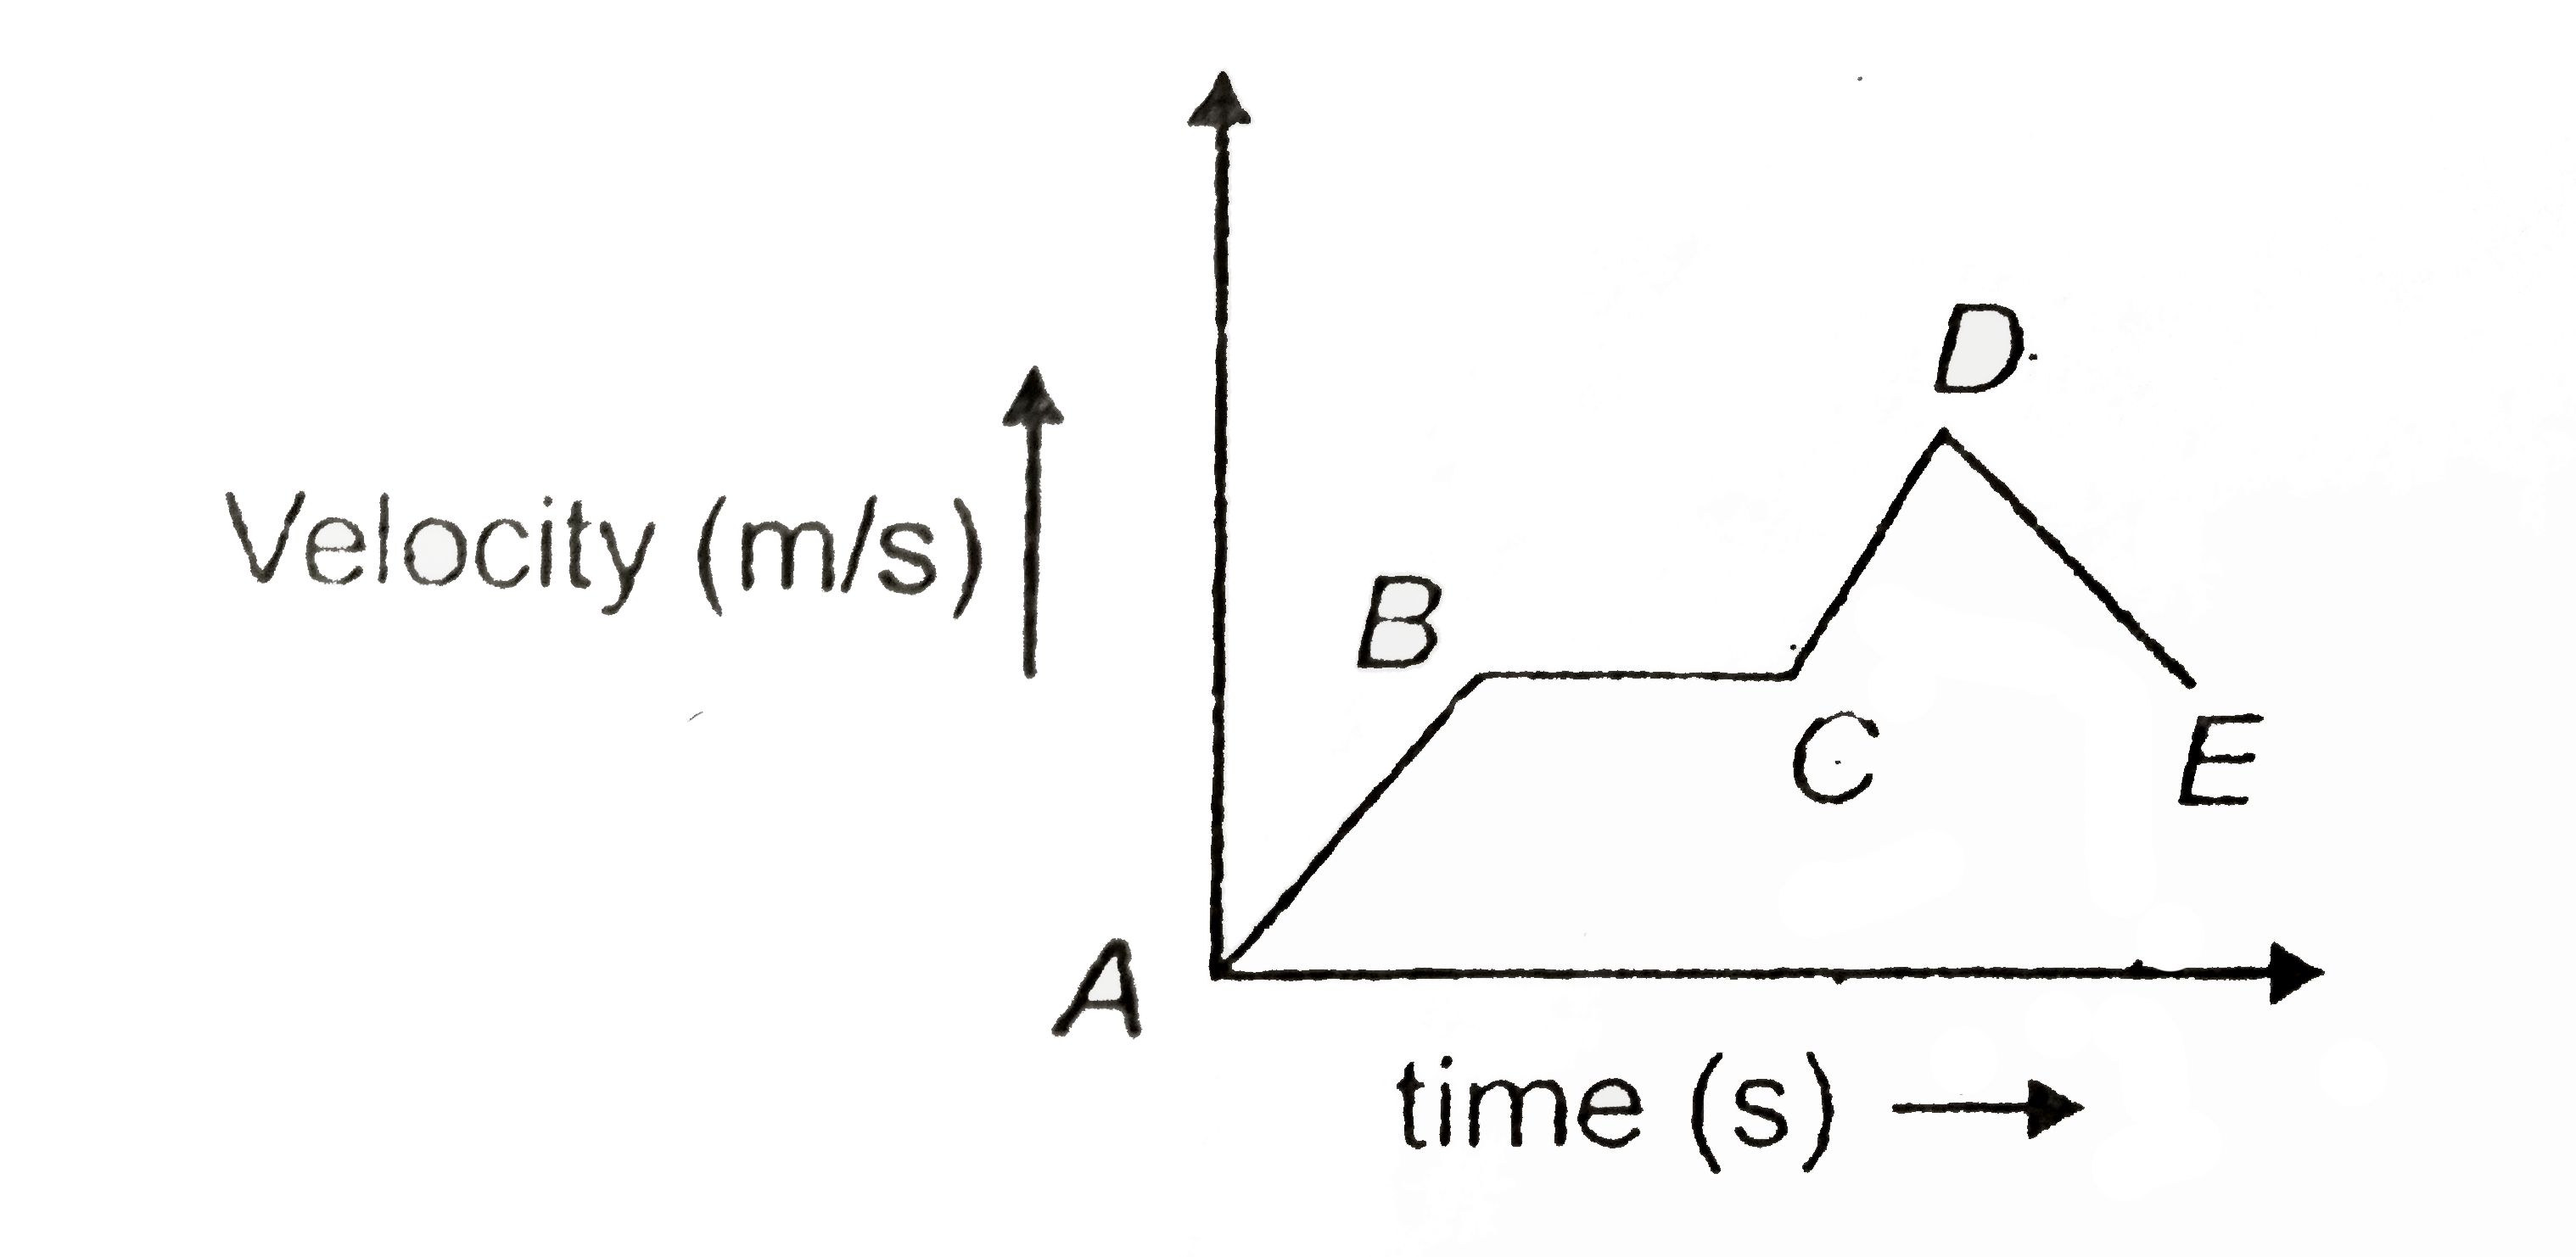
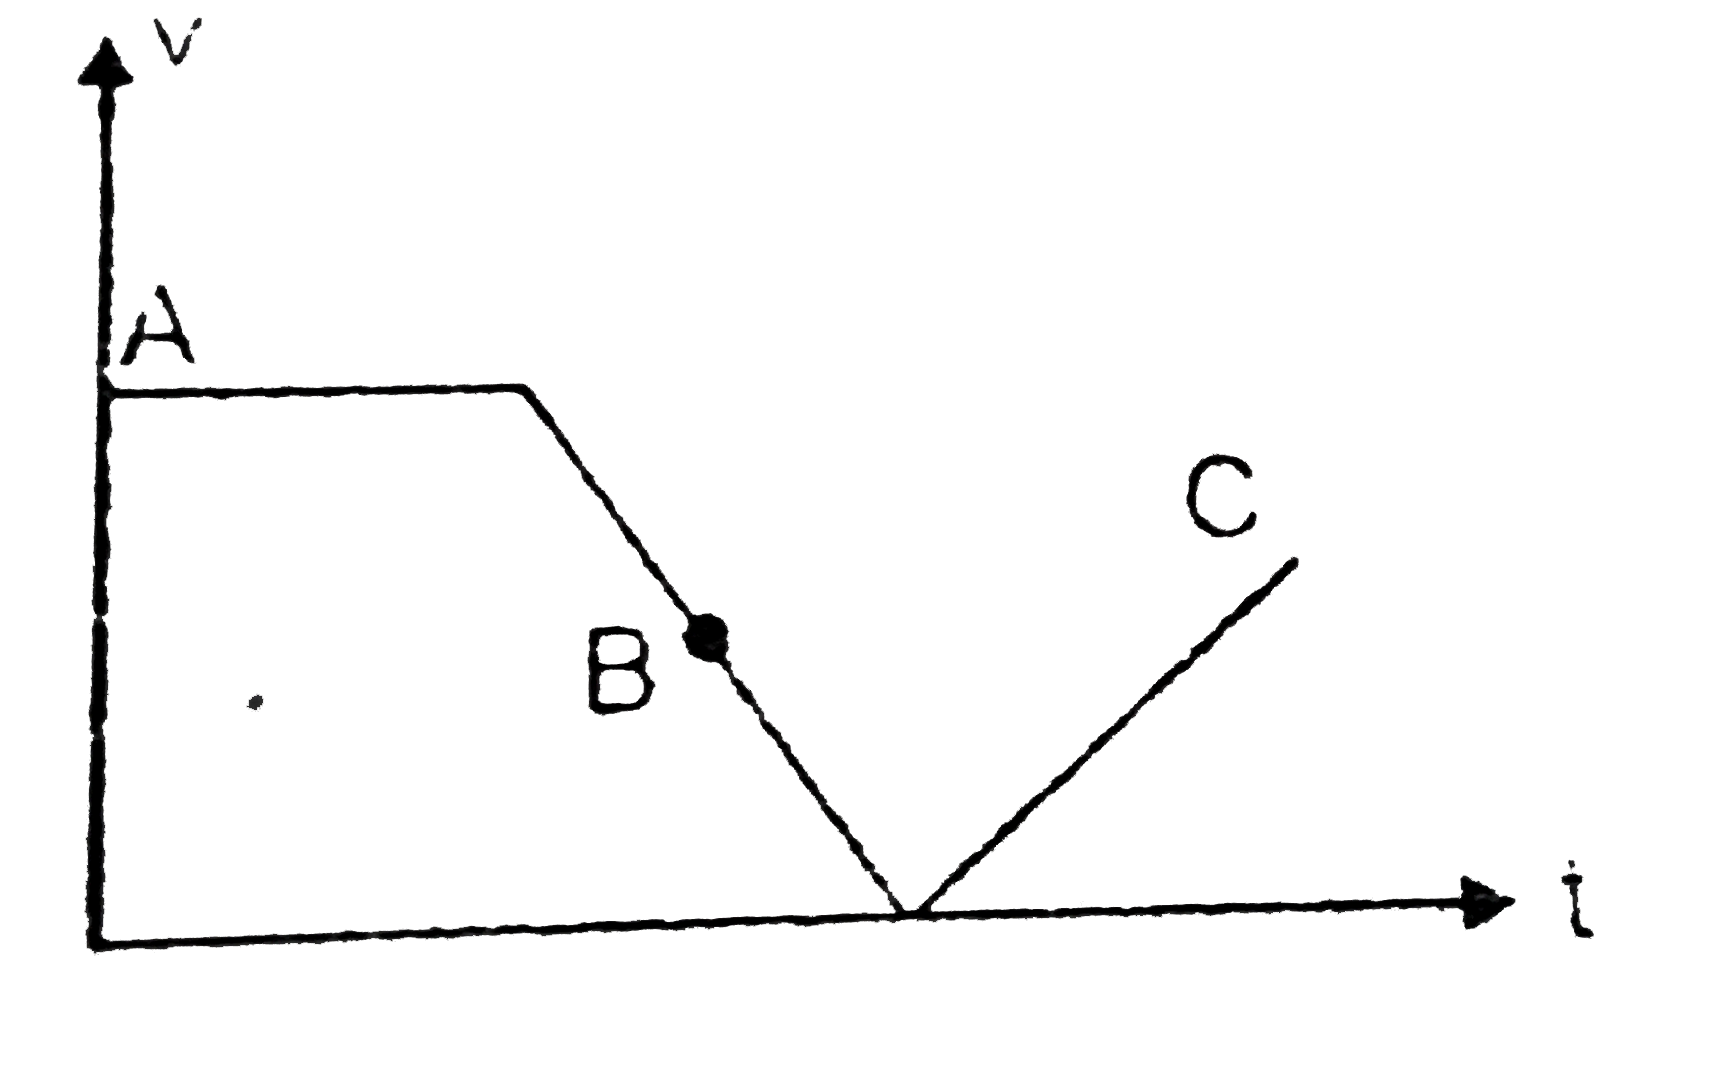
The velocity-time graph of a certain is shown in the following graph. The part of the graph that shows deceleration of the body is
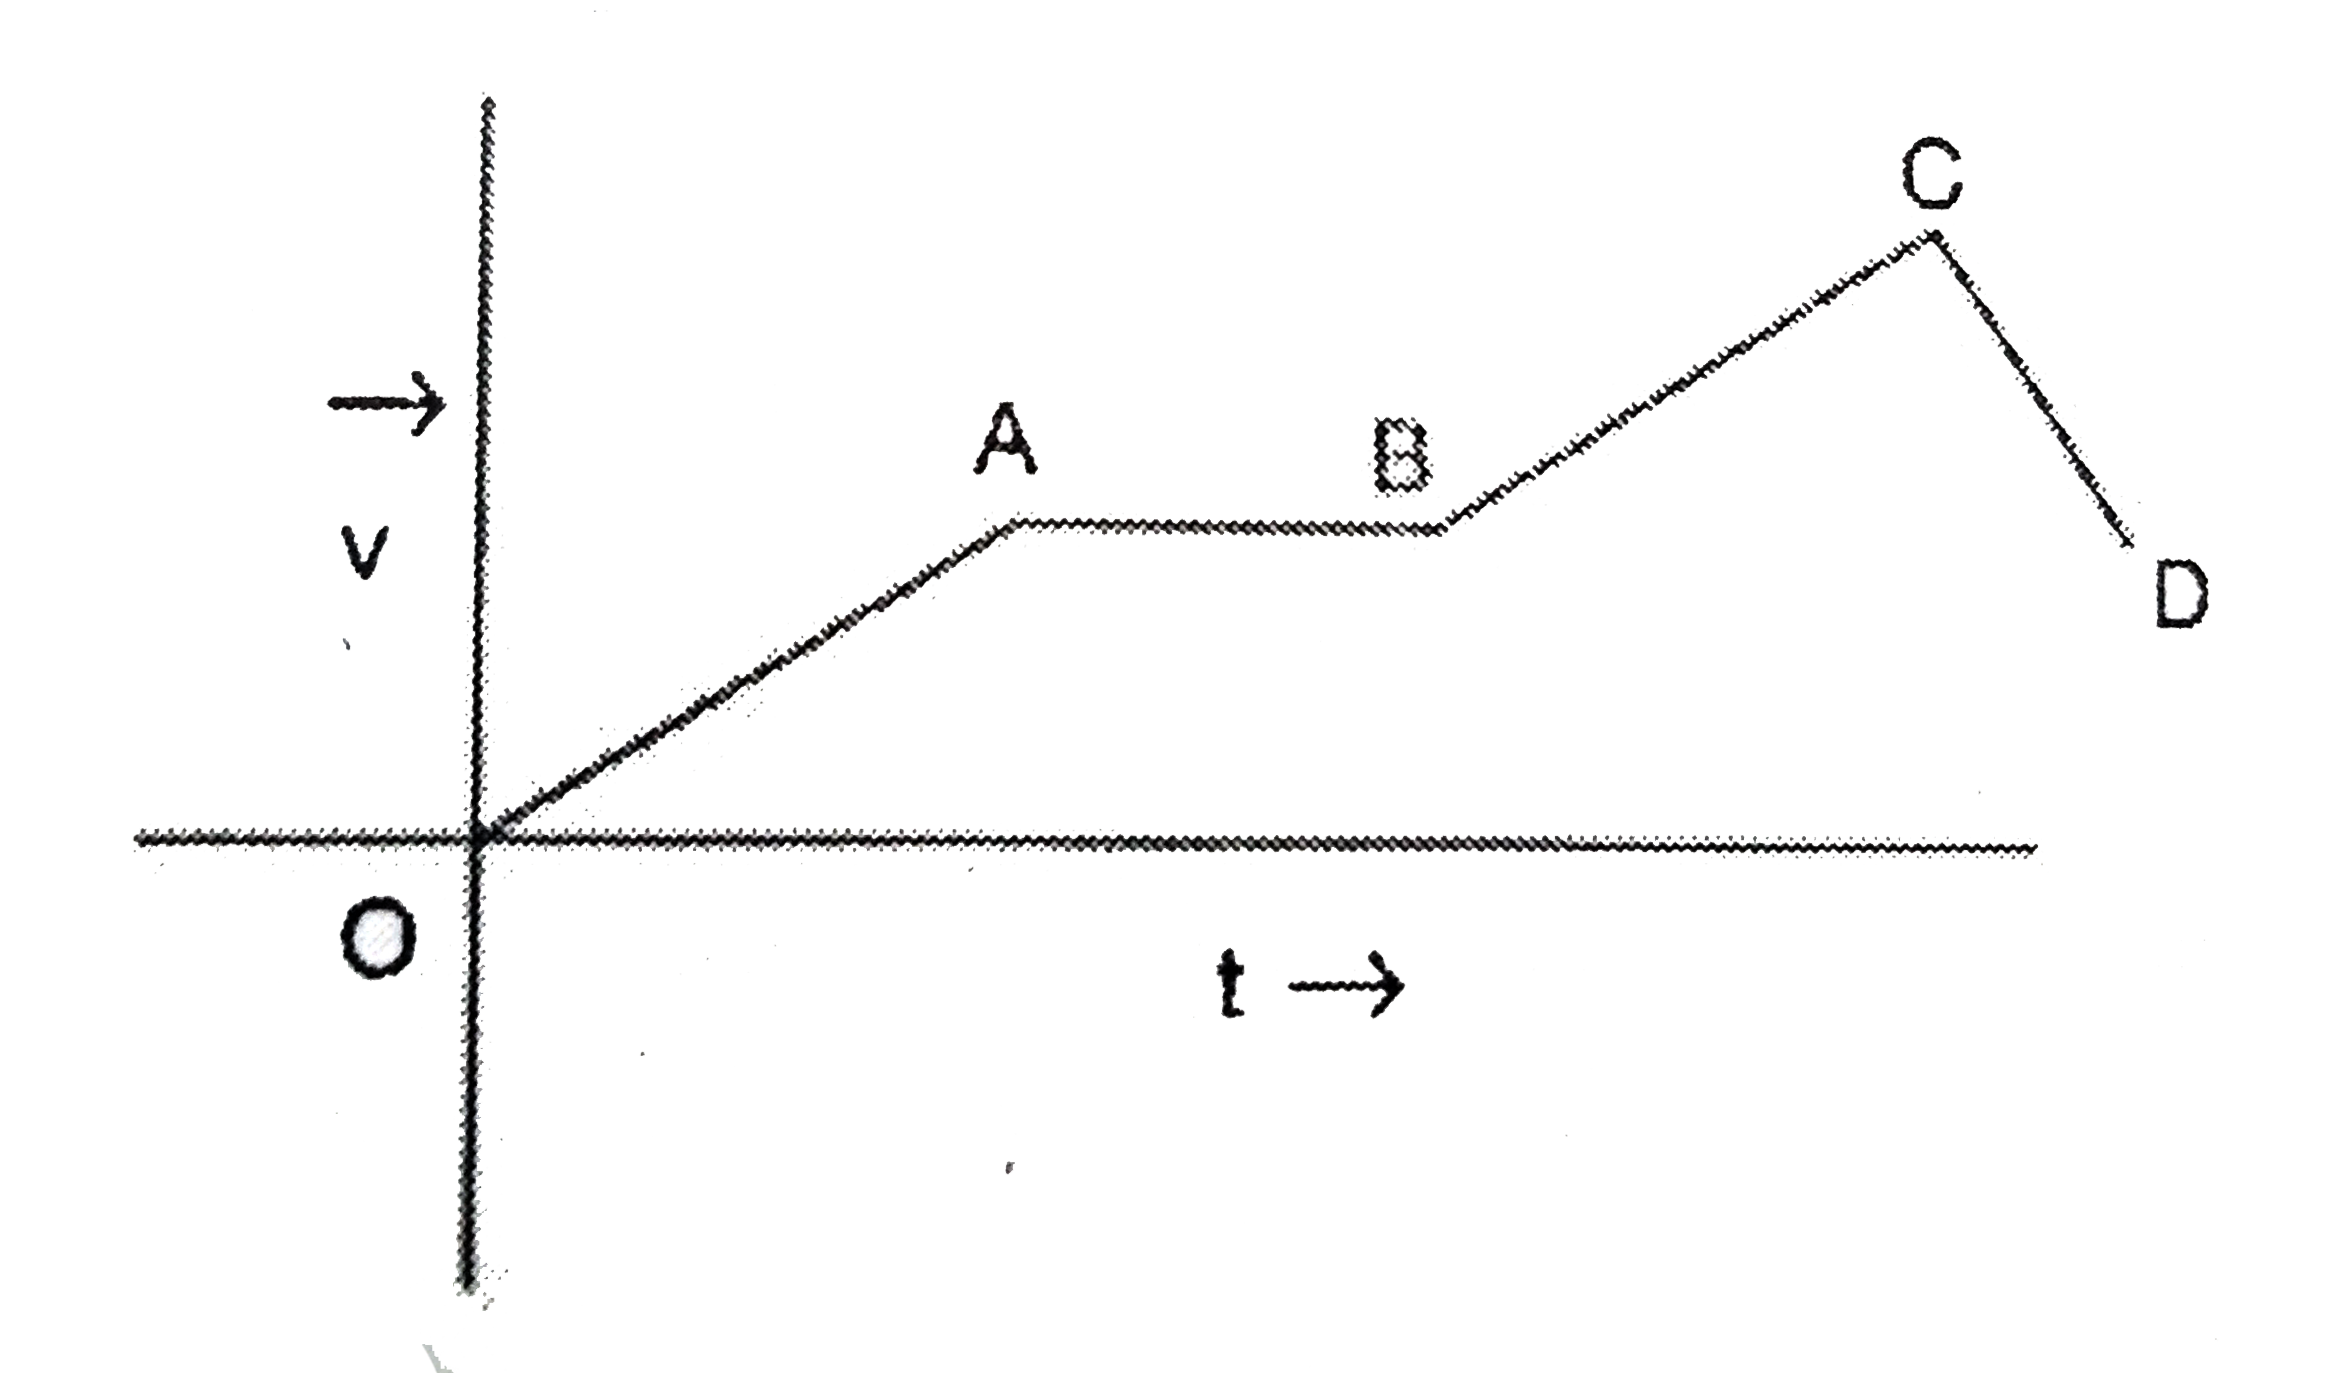
OA
AB
BC
CD
The correct Answer is:D
Step by step video & image solution for The velocity-time graph of a certain is shown in the following graph. The part of the graph that shows deceleration of the body is by Physics experts to help you in doubts & scoring excellent marks in Class 8 exams.
Updated on:21/07/2023Similar Questions
Knowledge Check
The velocity − time graph of a particle is as shown in figure
 AIt moves with a constant acceleration throughoutBIt moves with an acceleration of constant magnitude but changing direction at the end of every two secondCThe displacement of the particle is zeroDThe velocity becomes zero at t=4 second
The distance- time graph of a body is as shown in the figure. The part of the graph that represent the unifrom speed of the body is
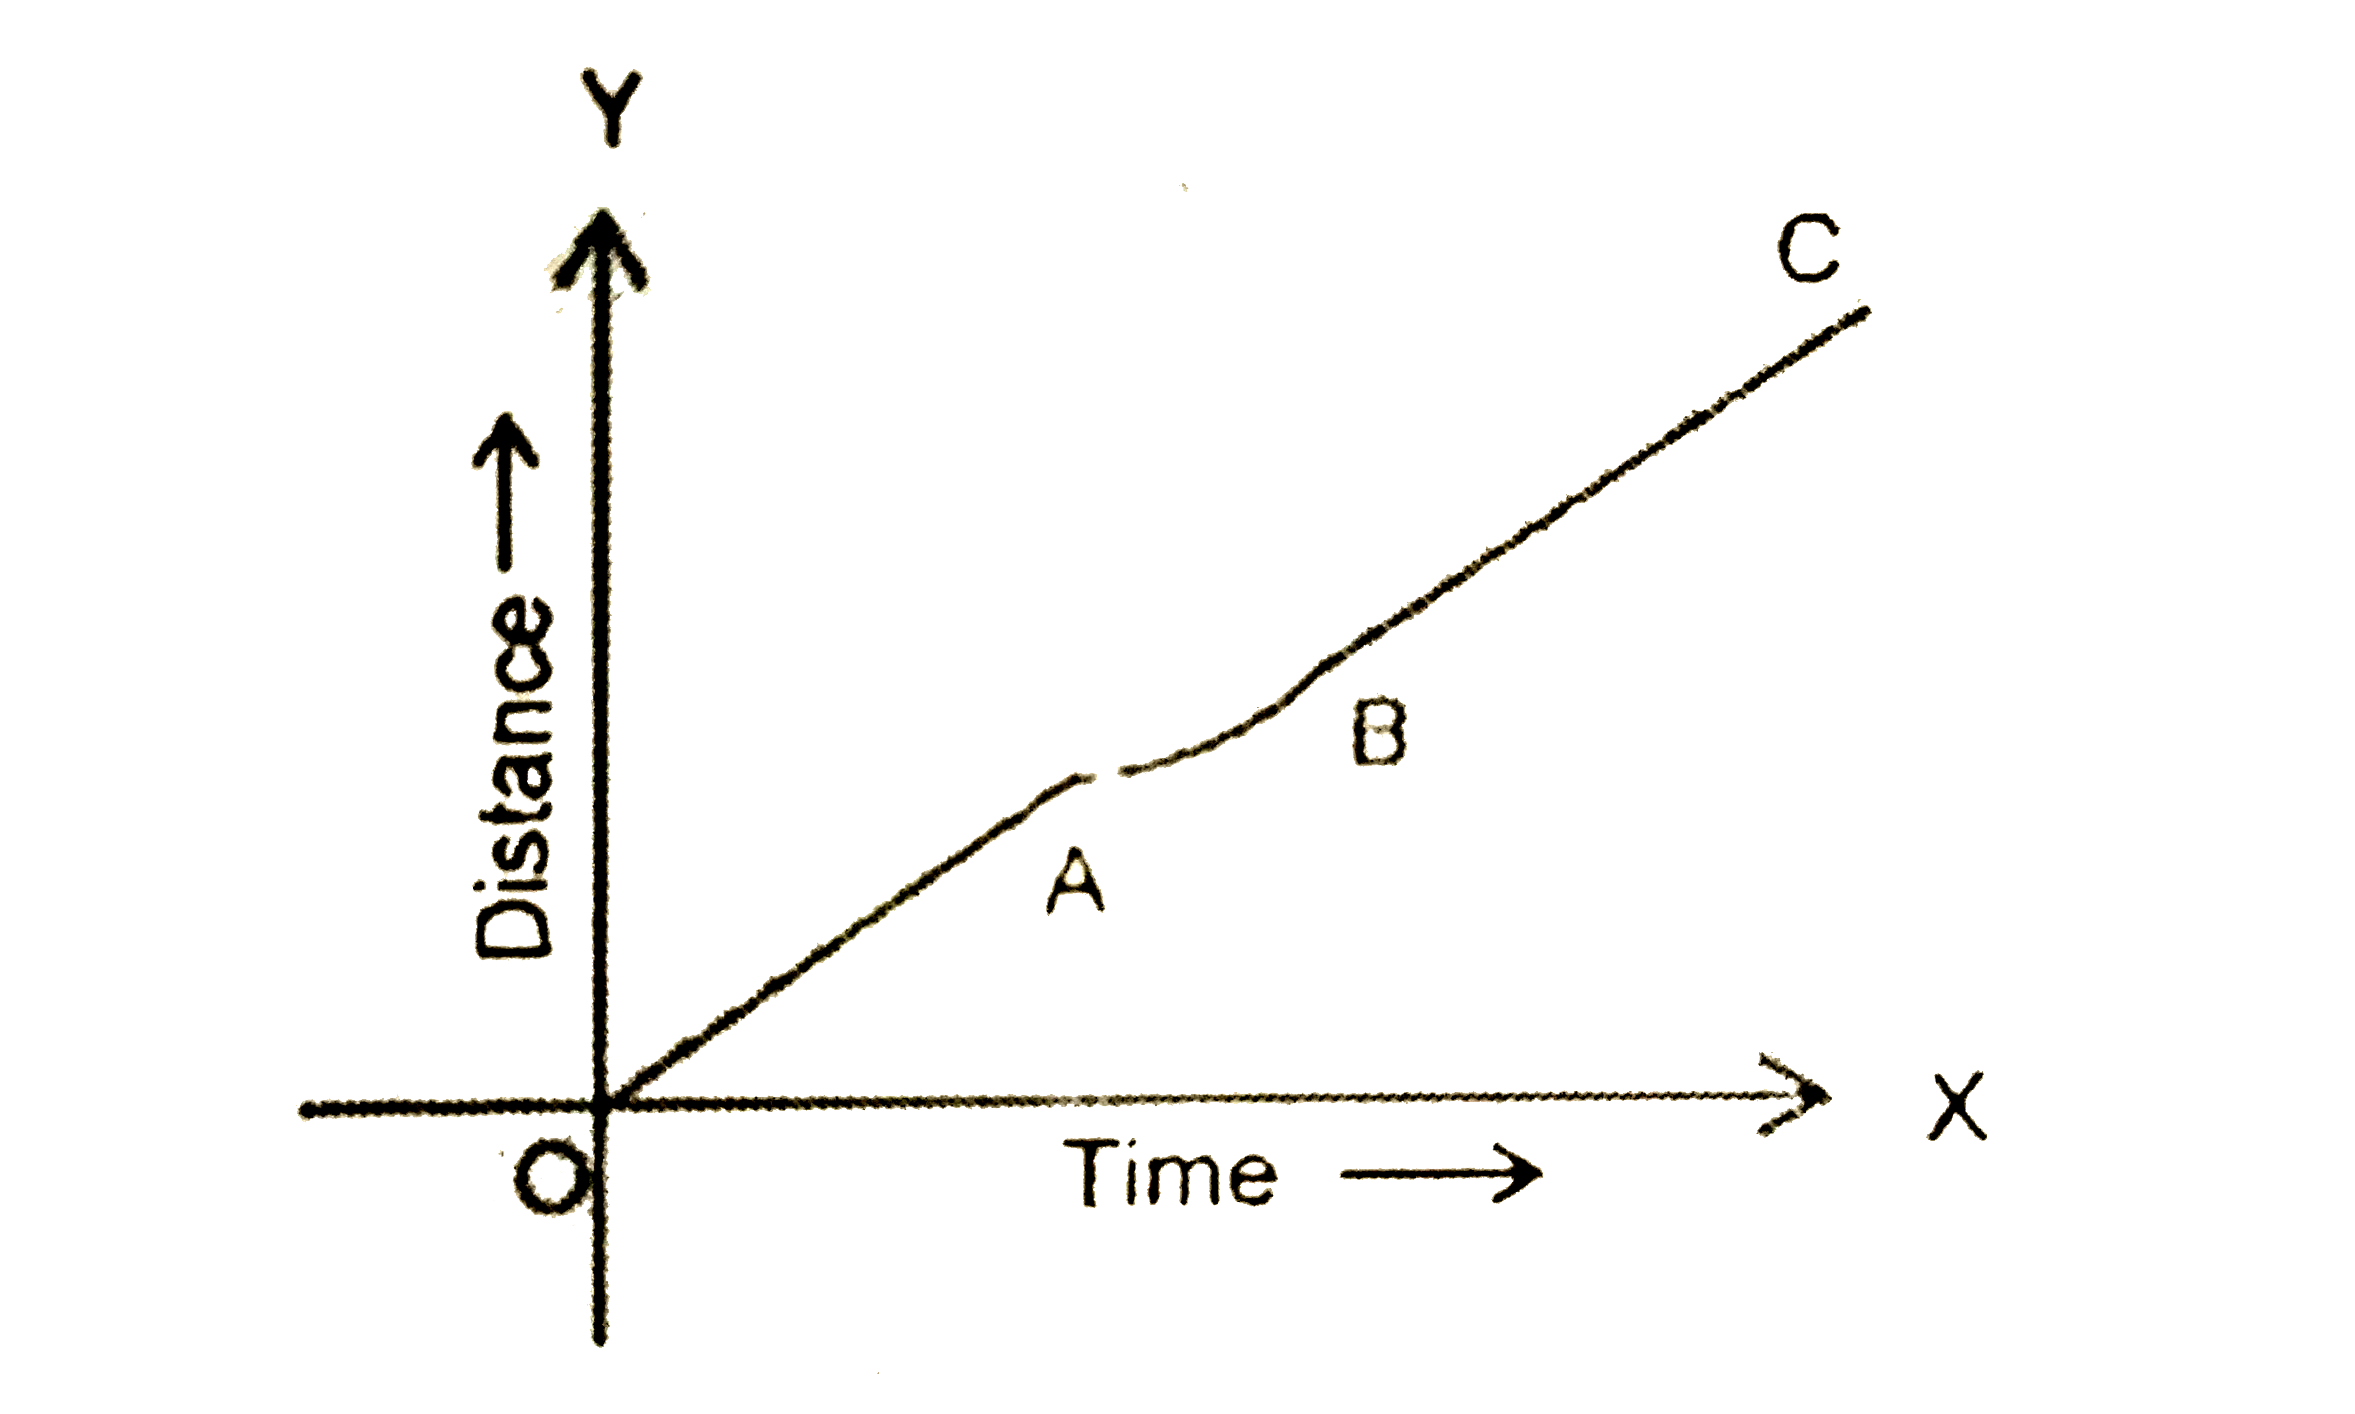 AOABABCBCDBoth OA and BC
The distance- time graph of a body is as shown in the figure. The part of the graph that represent the unifrom speed of the body is
 AOABABCBCDBoth OA and BC
The velocity time graph of a body is shown in fig. it indicates that :
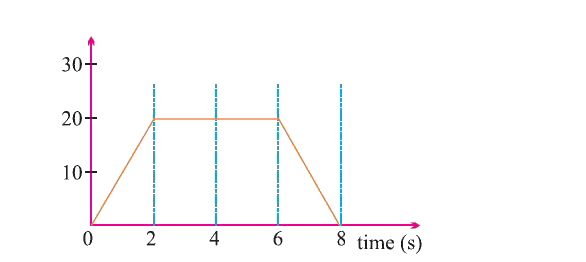
View SolutionThe velocity time graph for a particle is shown in figure. Draw acceleration time graph from it.
View SolutionThe displacement-time grpah of a body is shown in the figure below.
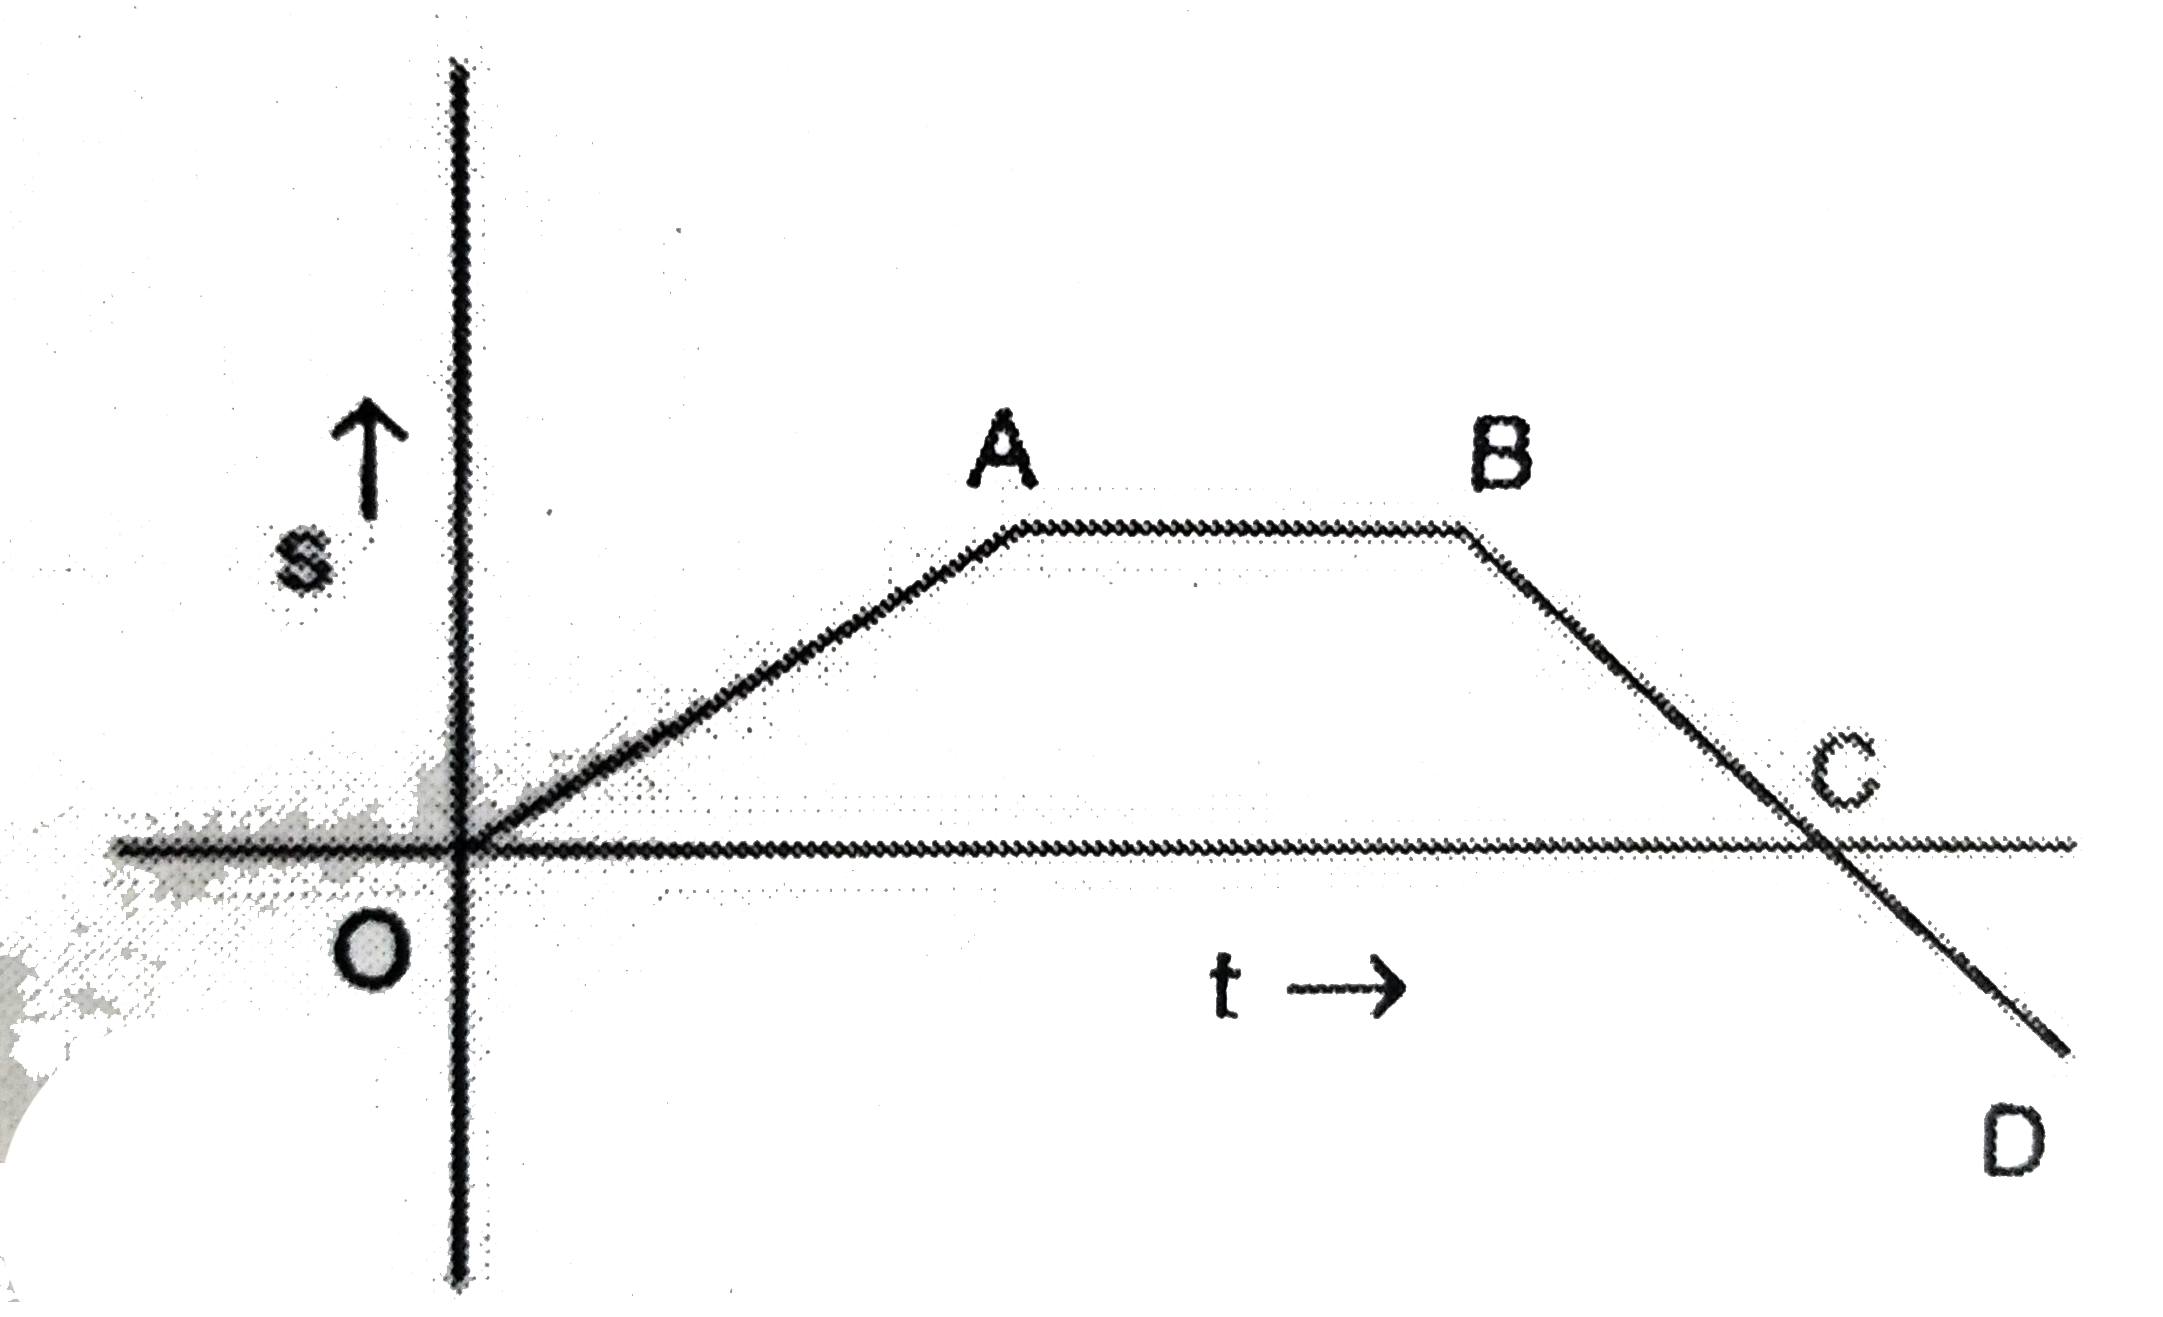
The part of the graph that represens the body at rest is
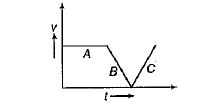
View SolutionThe velocity-time graph of a body is shown in the figure, it implies that at point B
View SolutionThe displacement-time grpah of a body is shown in the figure below.

The part of the graph that represens the body at rest is
View Solution

