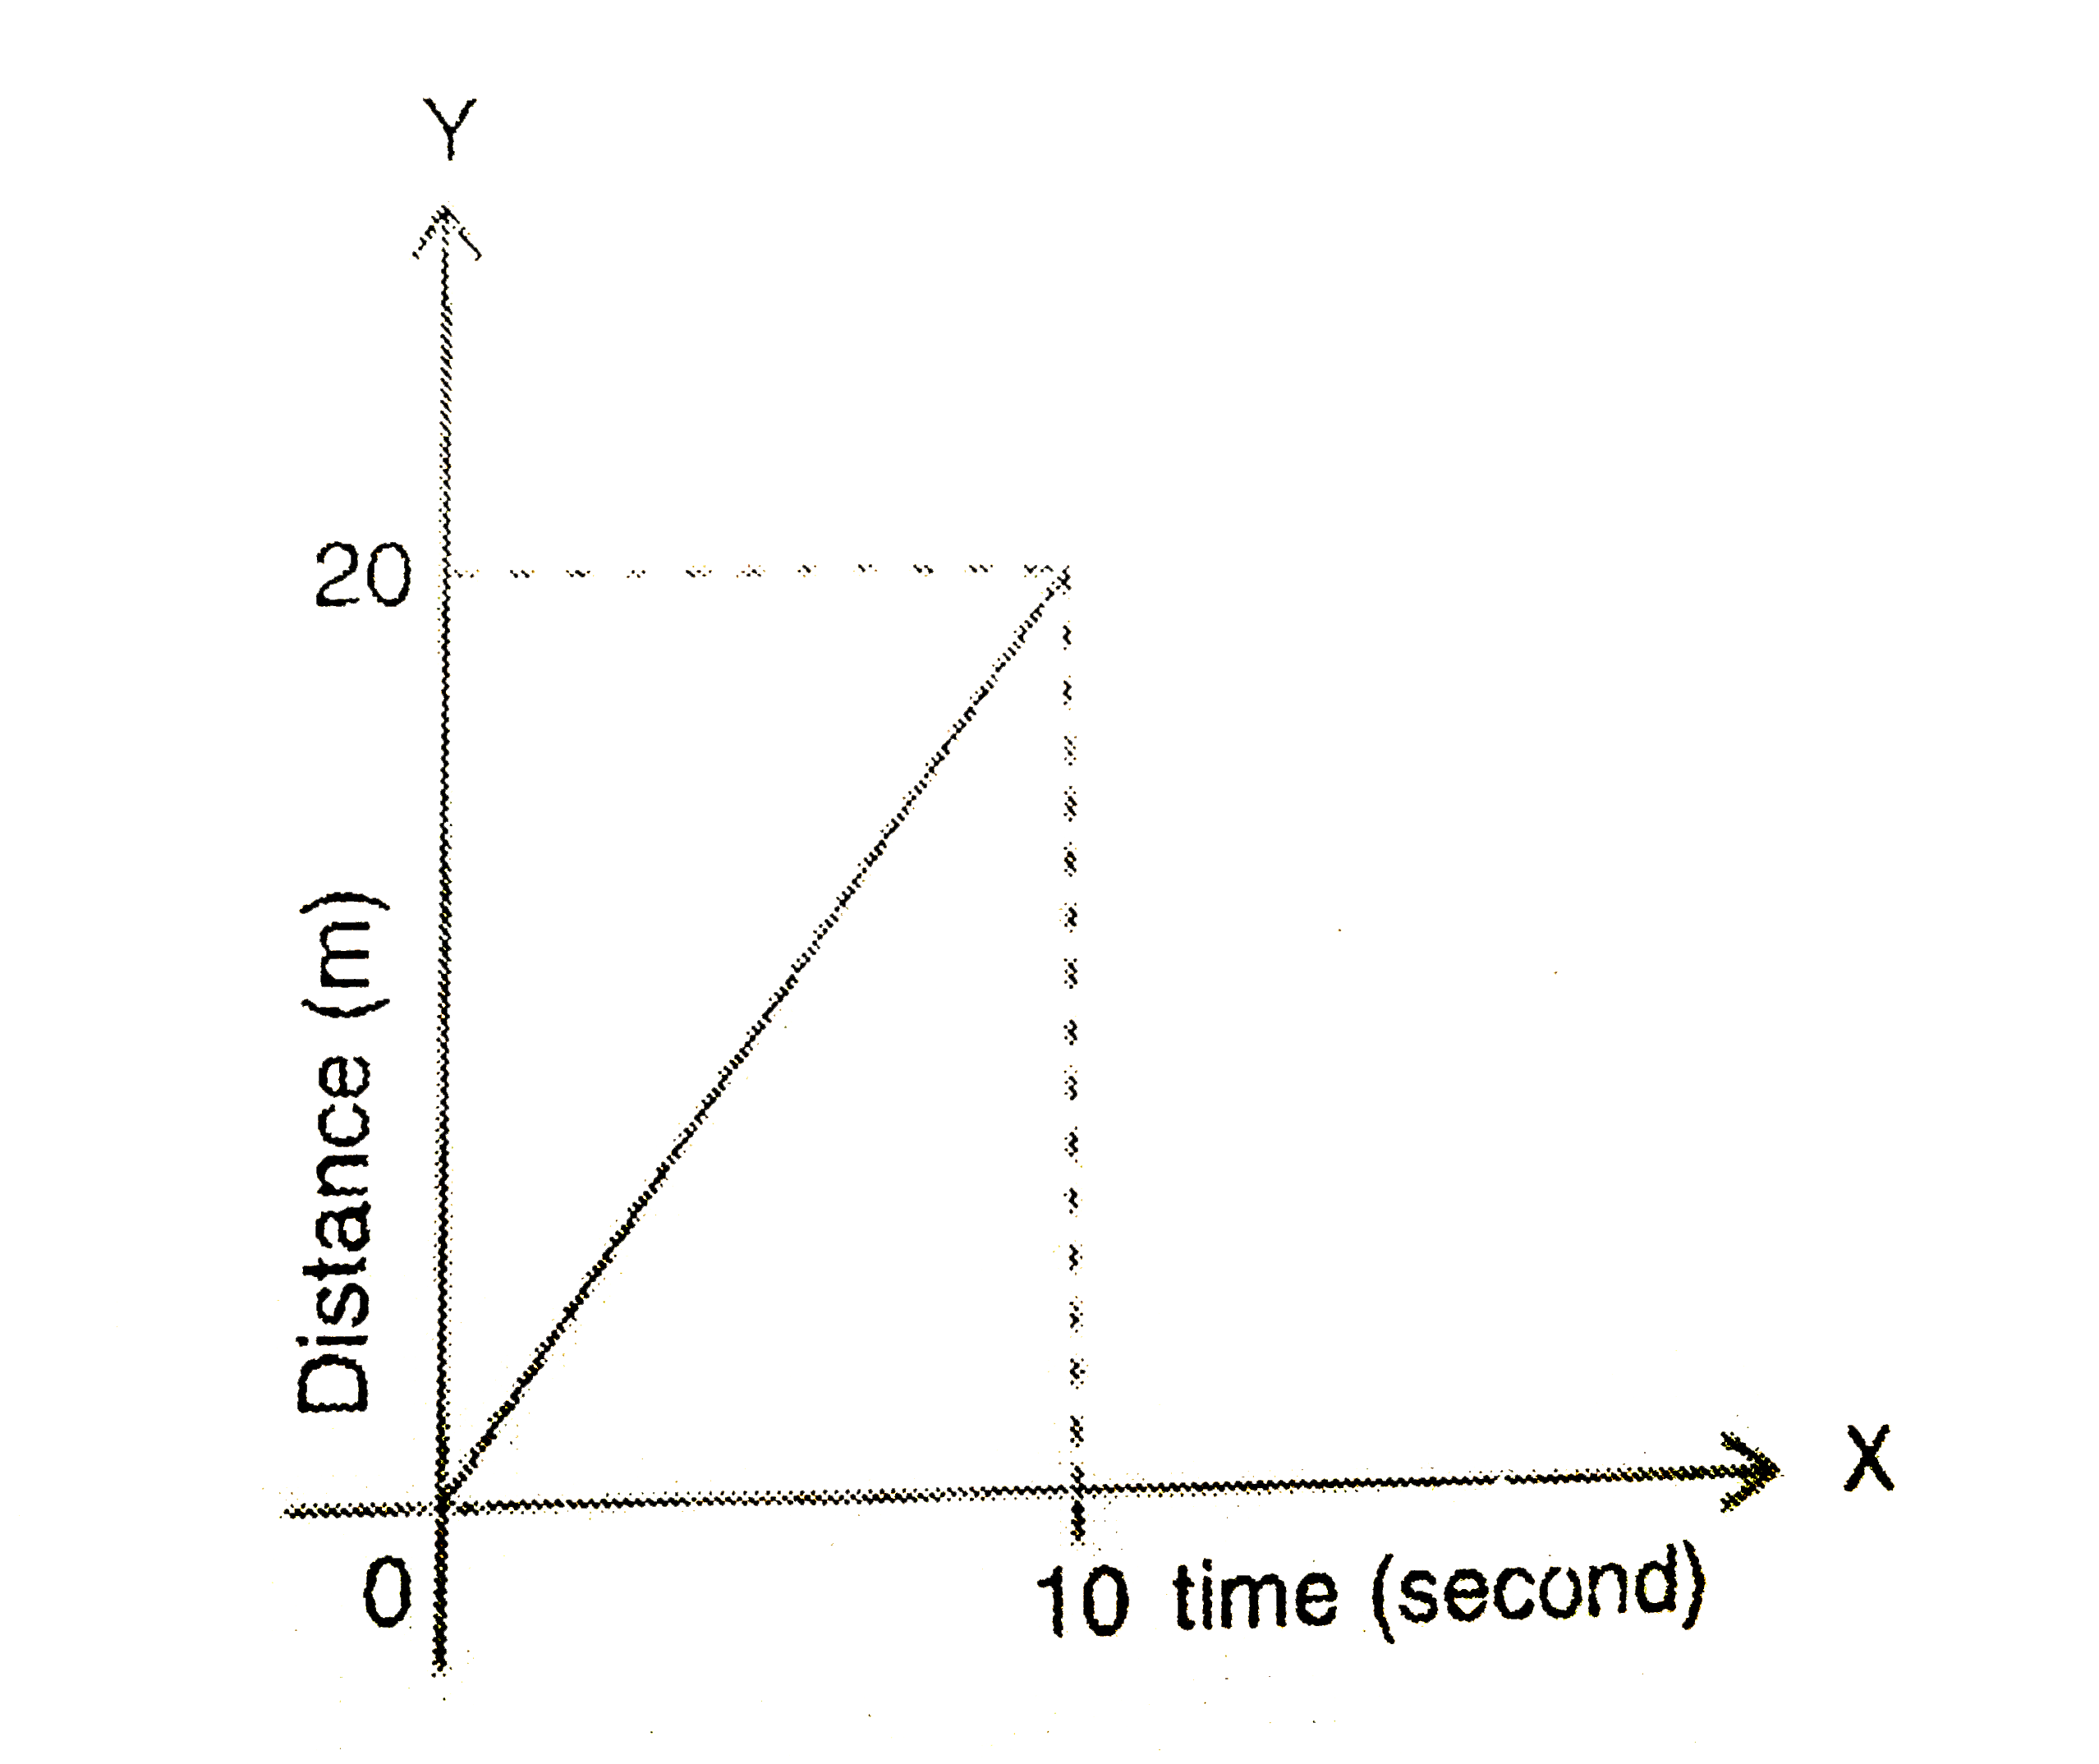
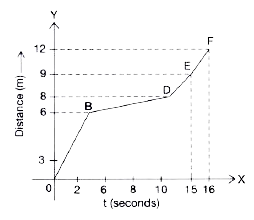
The motion of a body is depicted graphically as shown in the figure. The average speed of the body is ______ ms−1.
A
3/4
B
9/8
C
4/3
D
8/9
Text Solution
The correct Answer is:A
From the graph:
The total distance moved by the body = OF = 12 m.
The total time taken = 16 s.
Average speed =total distancetotal time=1216ms−1=34ms−1
|
Similar Questions
Knowledge Check
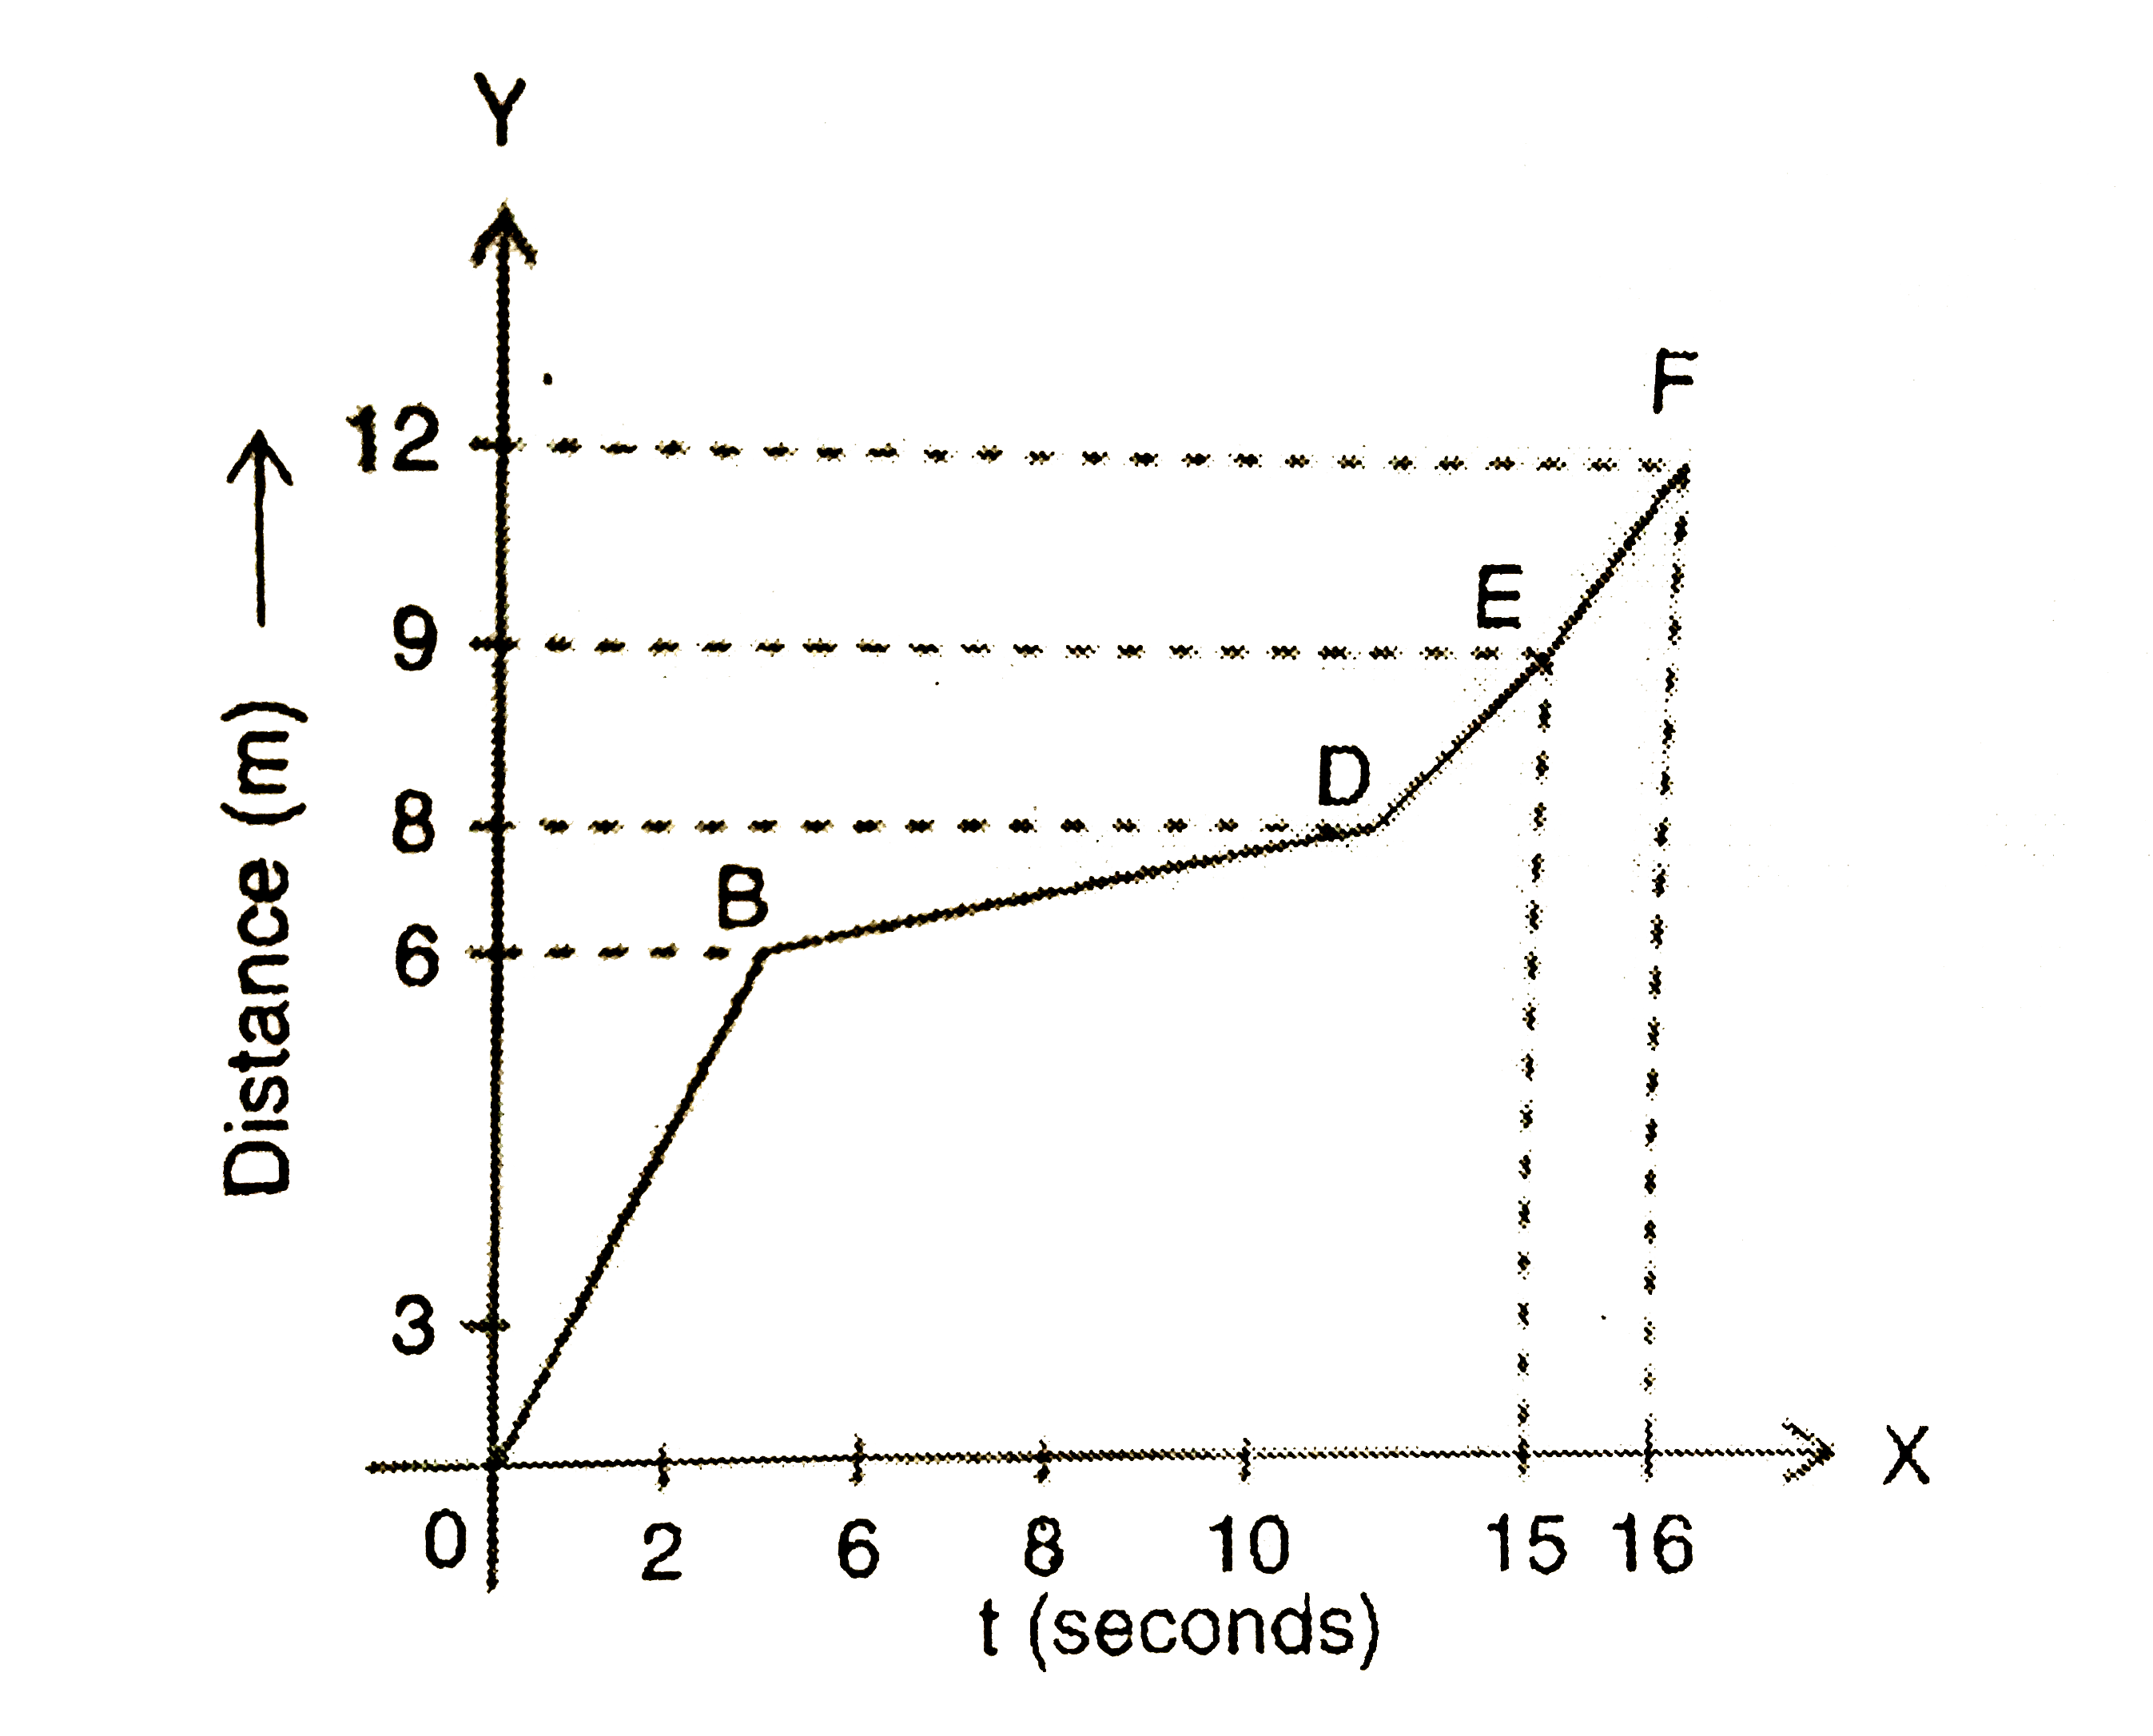
The motion of a body is depicted graphically as shown in the figure, then the average speed of the body is _____ ms−1.
 A34B98C43D89
The motion of a body is depicted graphically as shown in the figure, then the average speed of the body is _____ ms−1.
 A34B98C43D89
The motion of a body is depicted graphically as shown in the given figure. Then
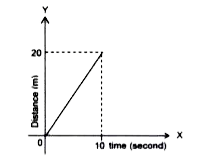 AThe average speed of the body is 2ms−1.BThe average speed of the body is zero.CThe body changes its direction twice.DAll of the above
Distance versus time graph of an object is as shown in the figure. The average speed of the object is _____ ms−1
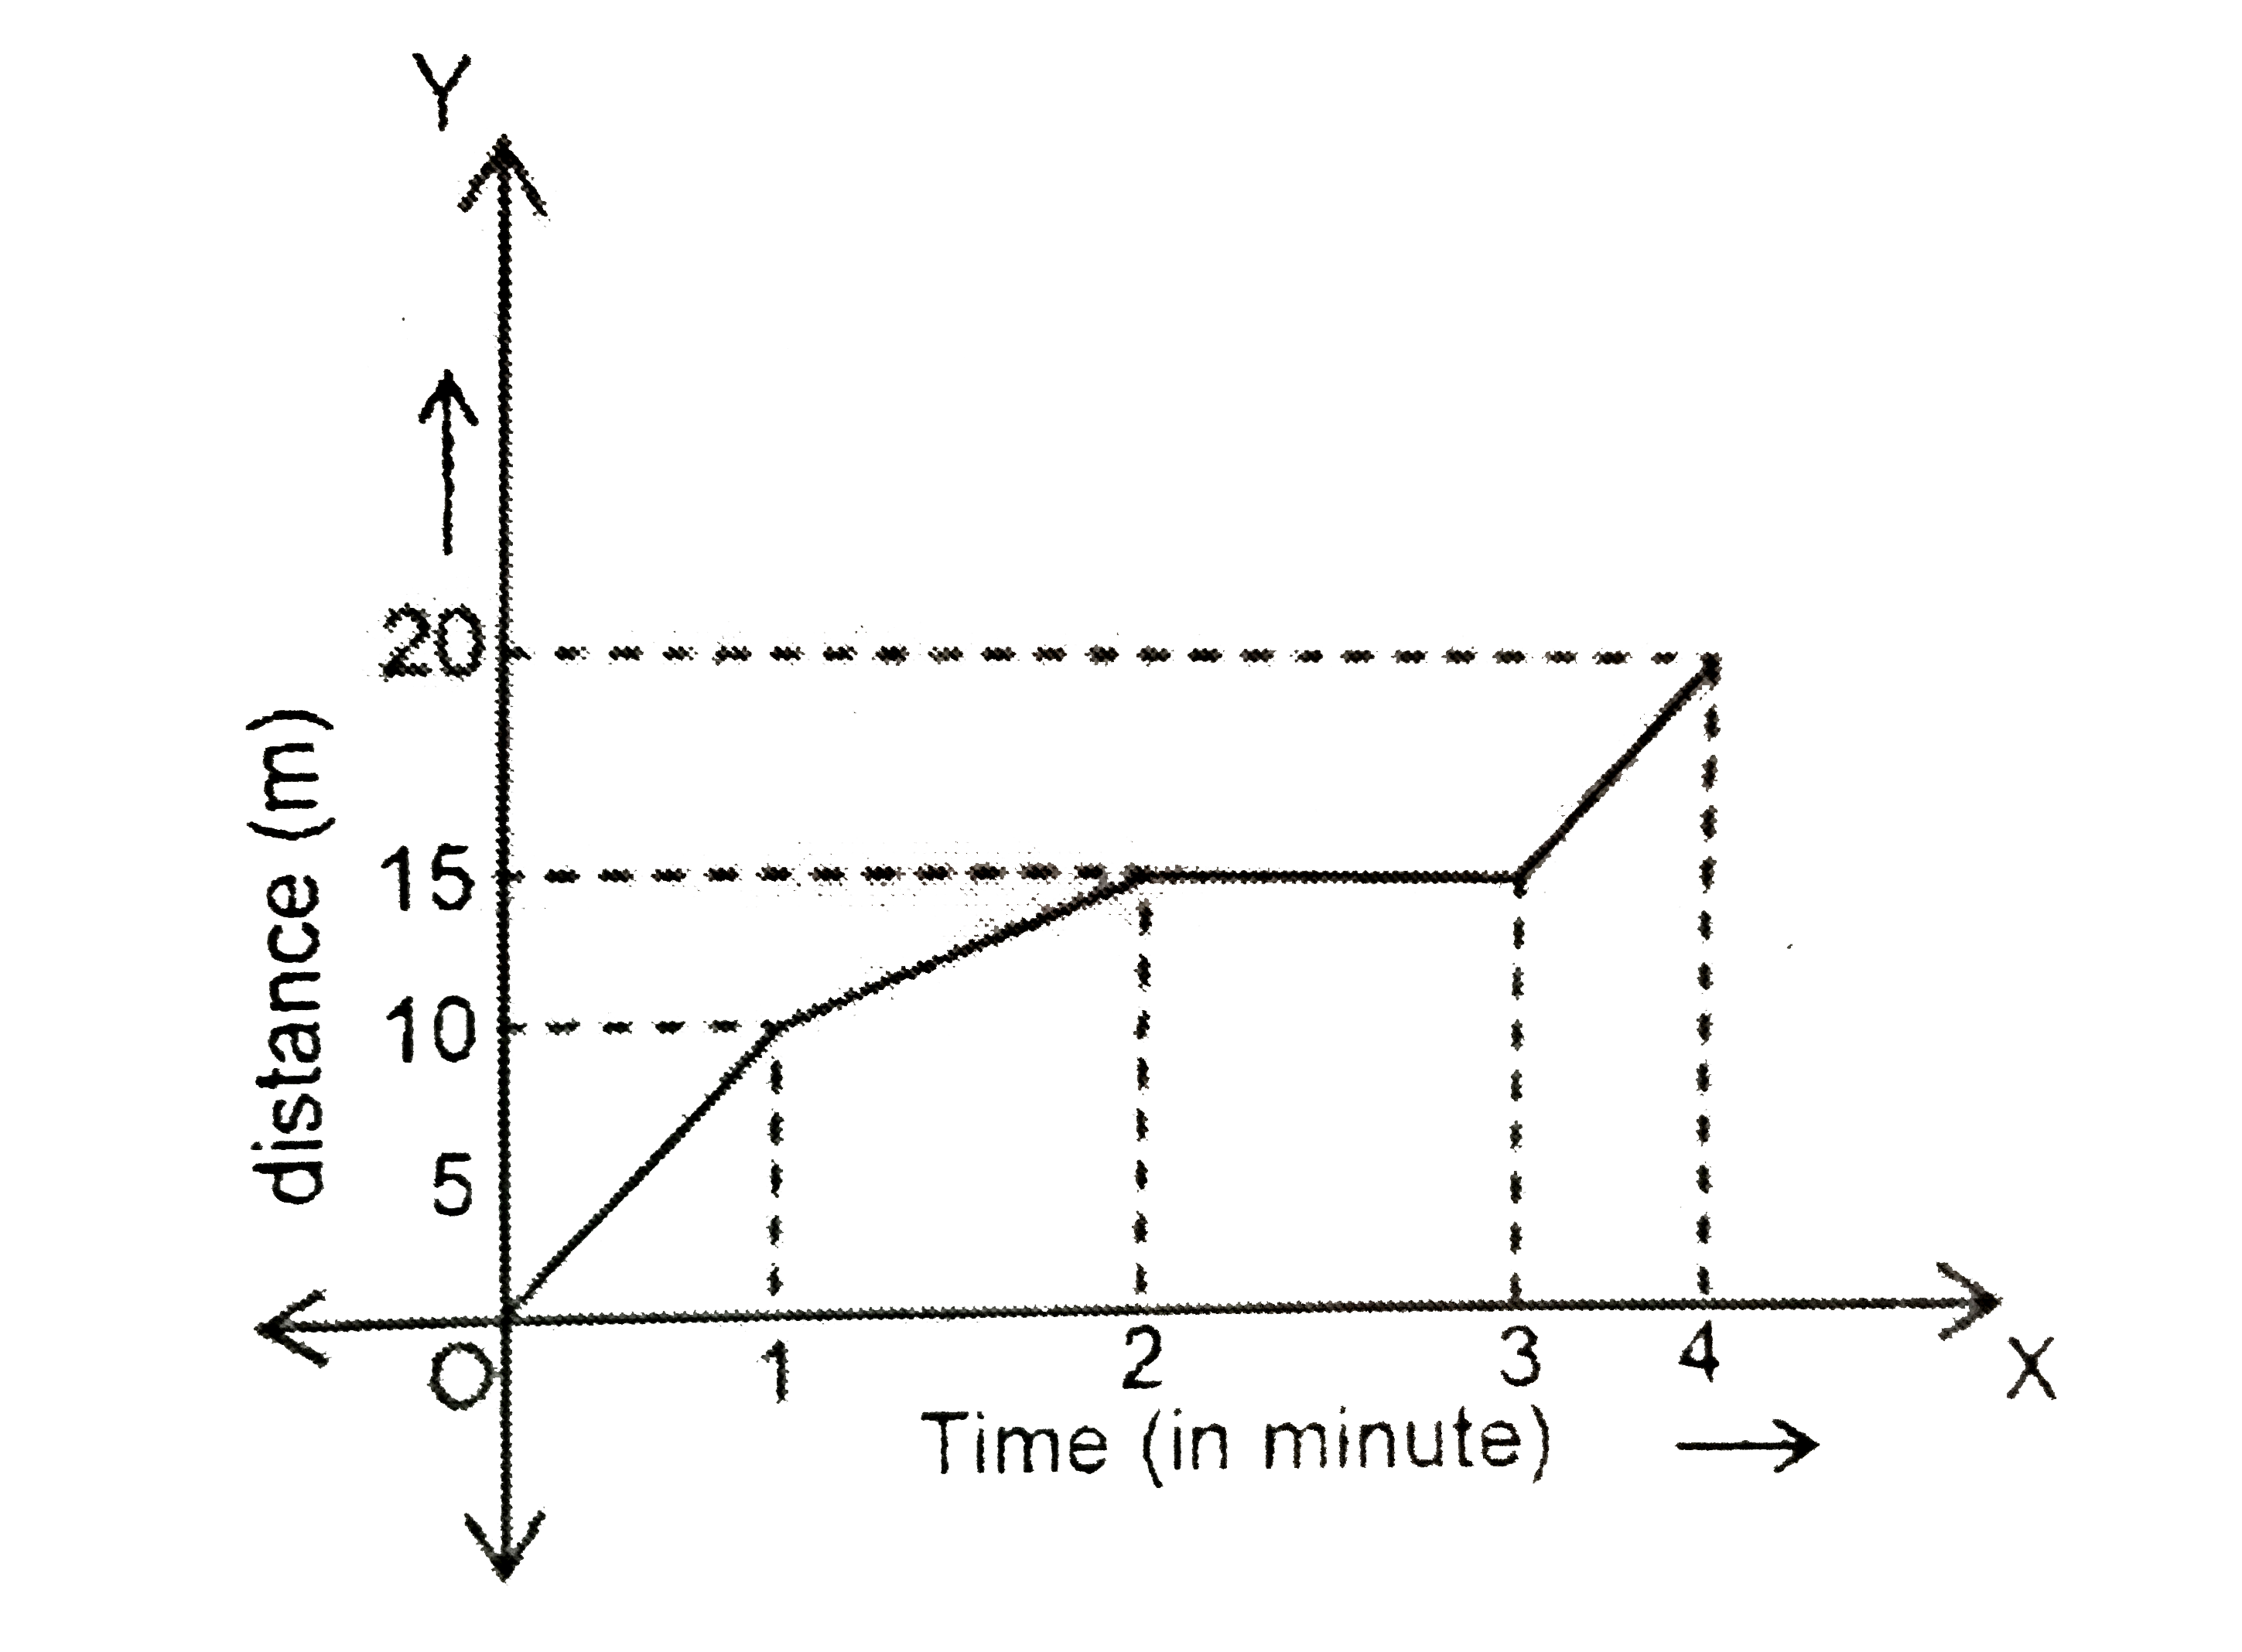
View SolutionDistance versus time graph of an object is as shown in the figure. The average speed of the object is _____ ms−1

View SolutionA body moves with a unifrom speed of 10kmh−1 for 2h. The average speed of the body is ______ km h−1
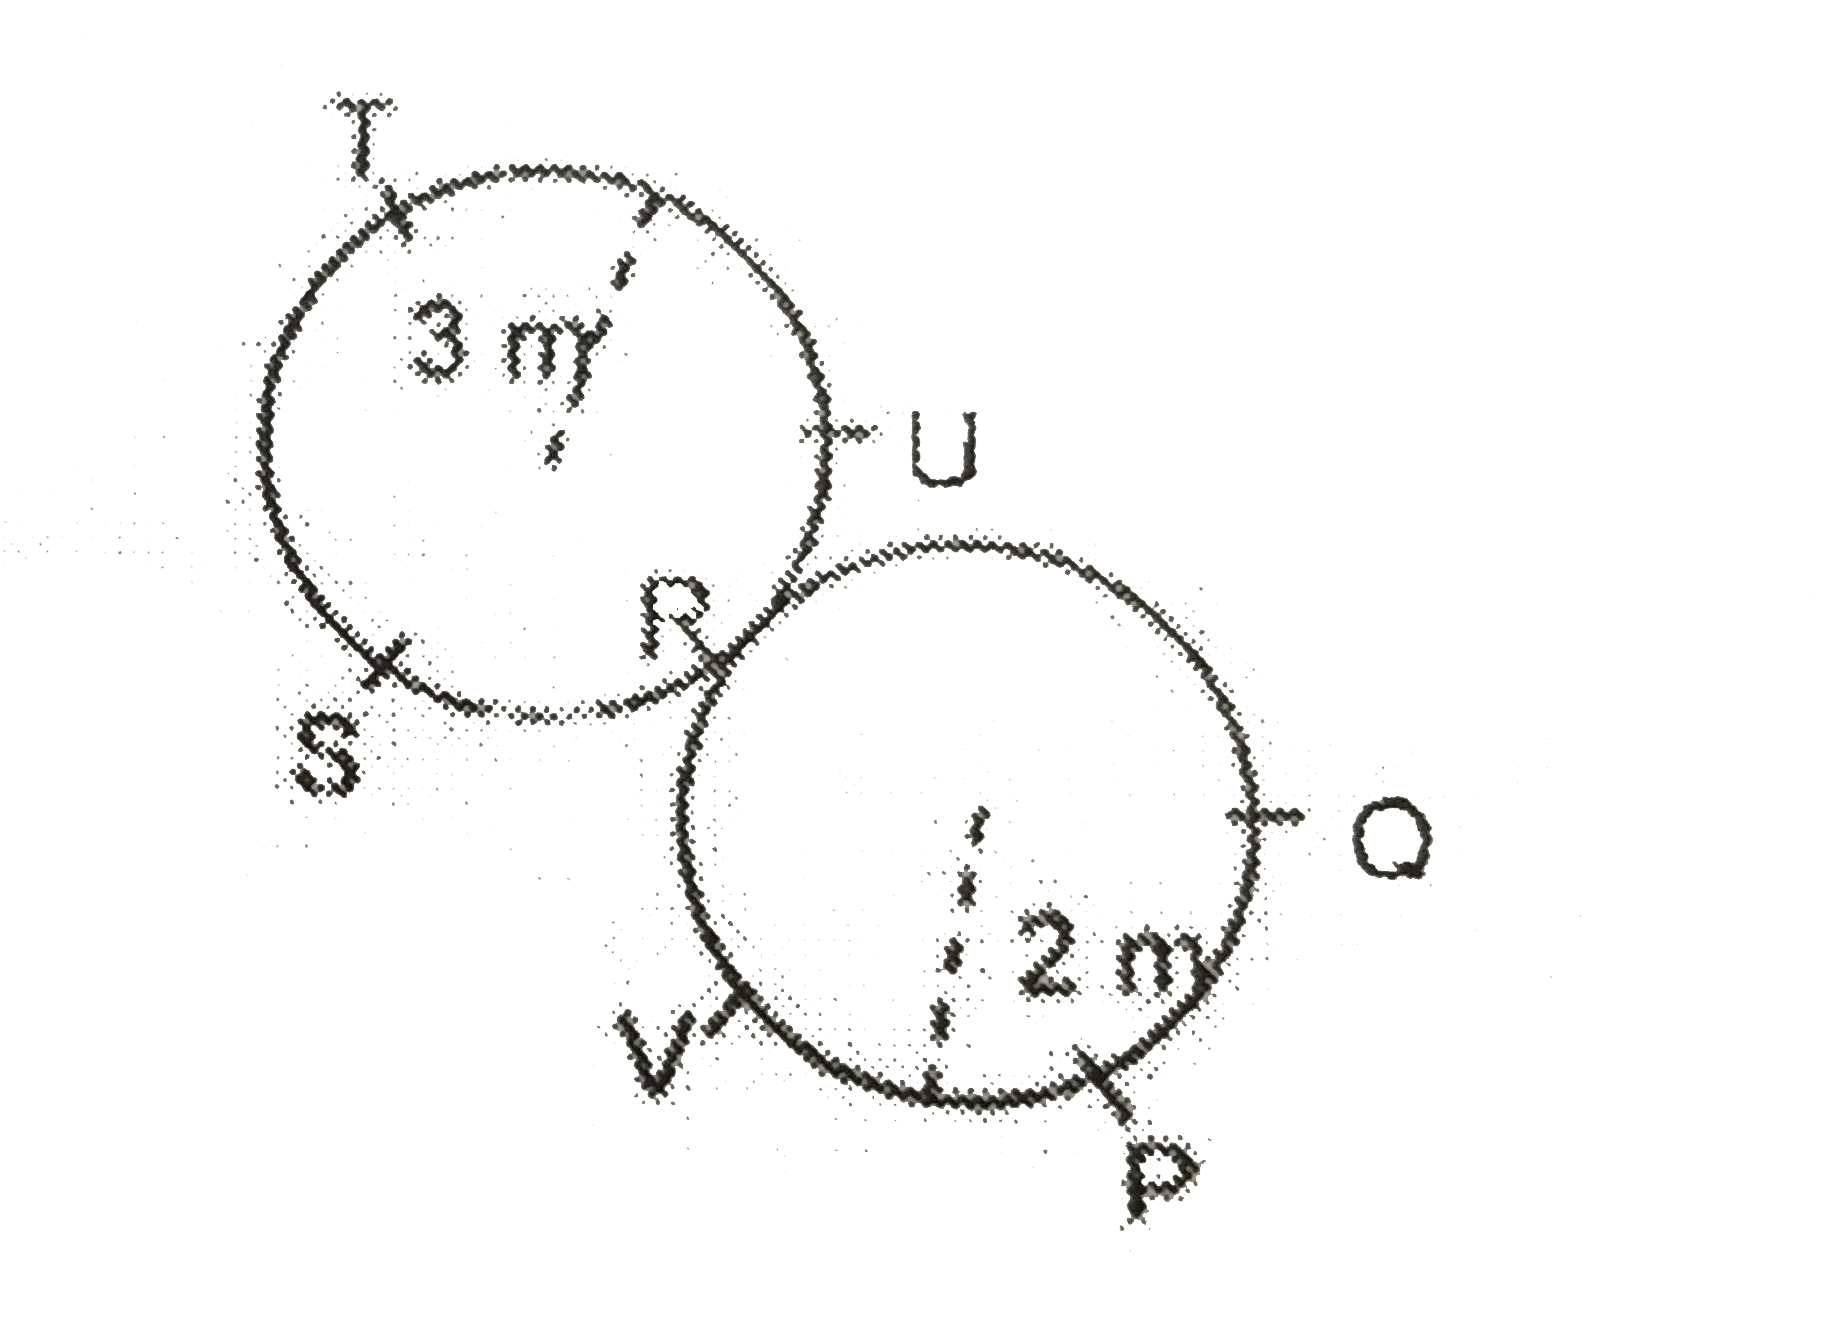
View SolutionAn athelete moves along a path PQRSTUVP, in 44 seconds as shown in the figure, then the average speed of the athlete is ______ ms−1
View SolutionA body moves with a uniform speed of 10 km h−1 for 2 h. The average speed of the body is ______ km h−1.
View Solution

