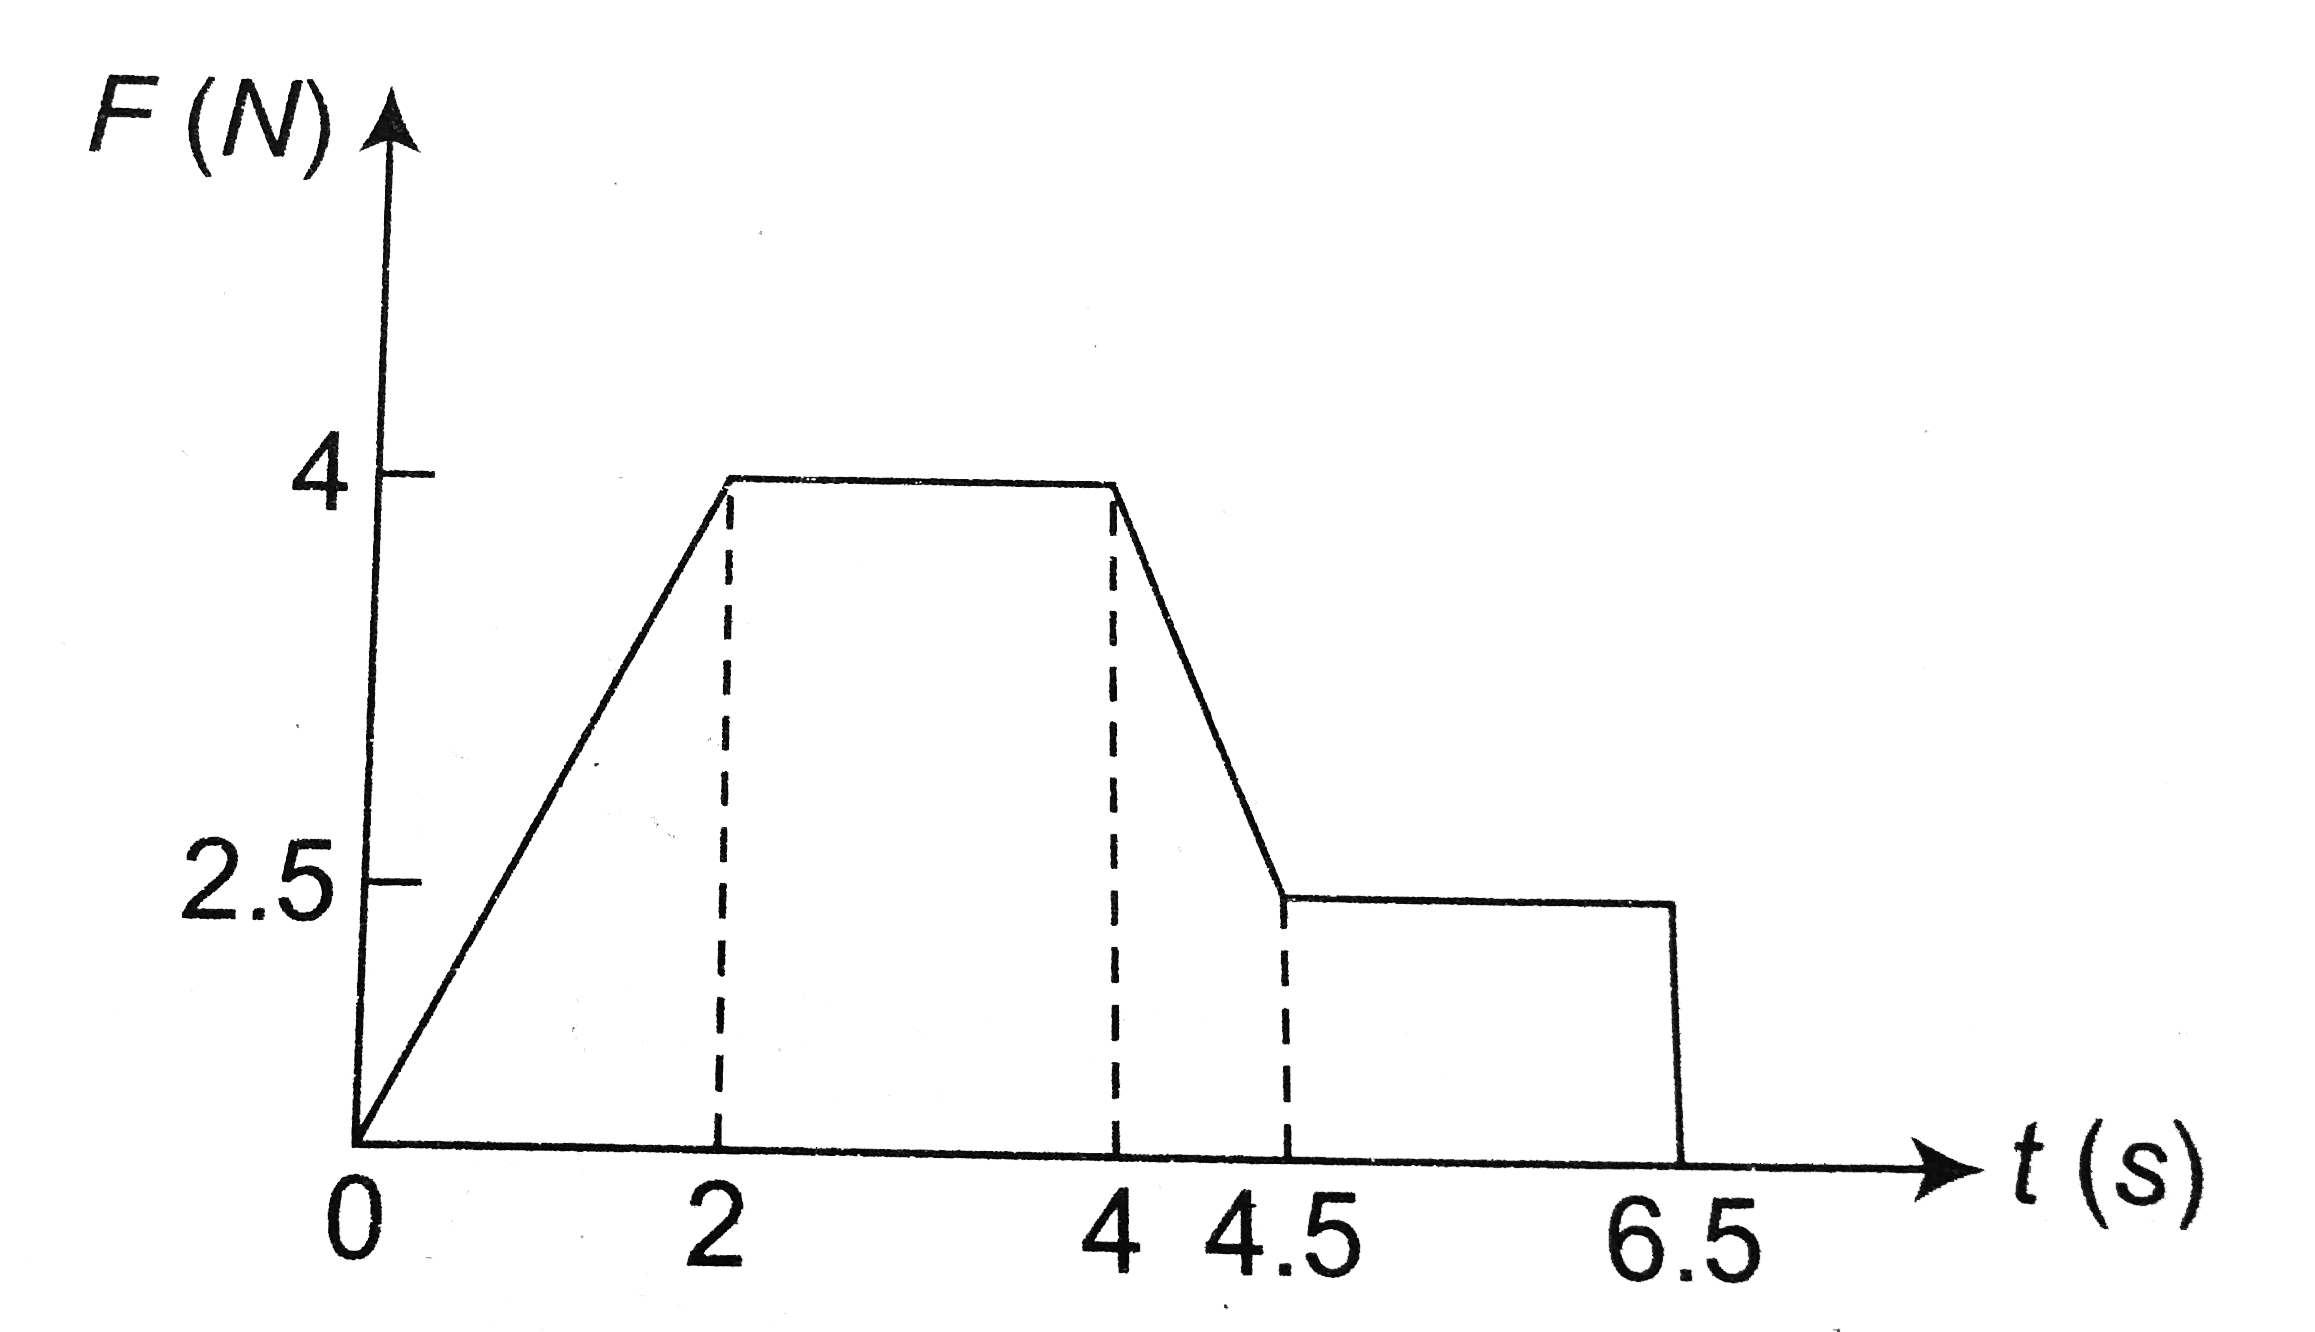
A body of 2kg has an initial speed 5ms−1 . A force acts on it for some time in the direction of motion. The force time graph is shown in figure. The force time graph is shown in figure. The final speed of the body is
9.25ms_(−1)
5ms_(−1)
14.25ms_(−1)
4.25ms_(−1)
The correct Answer is:C
Impulse=Change in momentum =m(v2−v1) …(i)
Again impulse=Area between the graph and time axis
=12×2×4+2×4+12(4+2.5)×0.5+2×2.5
=4+8+1.625+5=18.625
From (i) and (ii), m(v2−v1)=18.625
⇒v2=18.625m=v1=18.6252+5=14.25m/s .
Topper's Solved these Questions
- NEWTONS LAWS OF MOTIONBOOK - A2ZCHAPTER - NEWTONS LAWS OF MOTIONEXERCISE - Equilibrium Of A Particle
19 Videos
- NEWTONS LAWS OF MOTIONBOOK - A2ZCHAPTER - NEWTONS LAWS OF MOTIONEXERCISE - Applications Of Newton'S Laws Of Motion
33 Videos
- NEWTONS LAWS OF MOTIONBOOK - A2ZCHAPTER - NEWTONS LAWS OF MOTIONEXERCISE - Chapter Test
30 Videos
- MOTION IN TWO DIMENSIONBOOK - A2ZCHAPTER - MOTION IN TWO DIMENSIONEXERCISE - Chapter Test
29 Videos
- OSCILLATION AND SIMPLE HARMONIC MOTIONBOOK - A2ZCHAPTER - OSCILLATION AND SIMPLE HARMONIC MOTIONEXERCISE - Chapter Test
29 Videos
Similar Questions
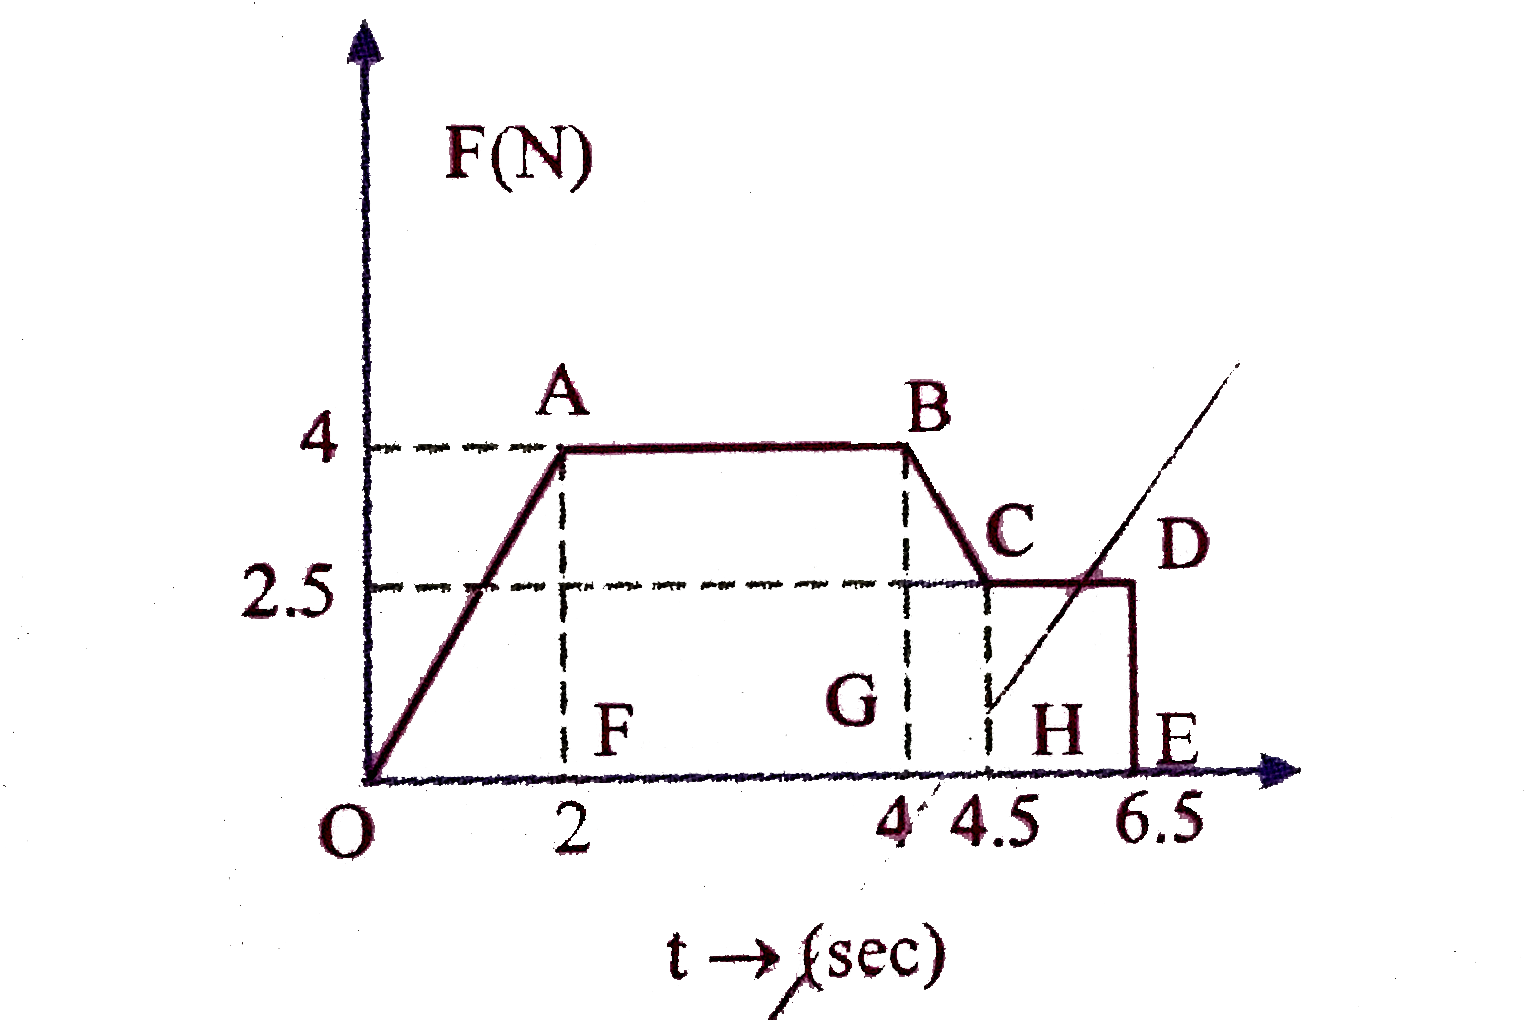
A body of mas 2kg has an initial speed 5ms−1 A force acts on it for some time in the direction of motion The force-time graph is shown. Find the final speed of the body
 .
.
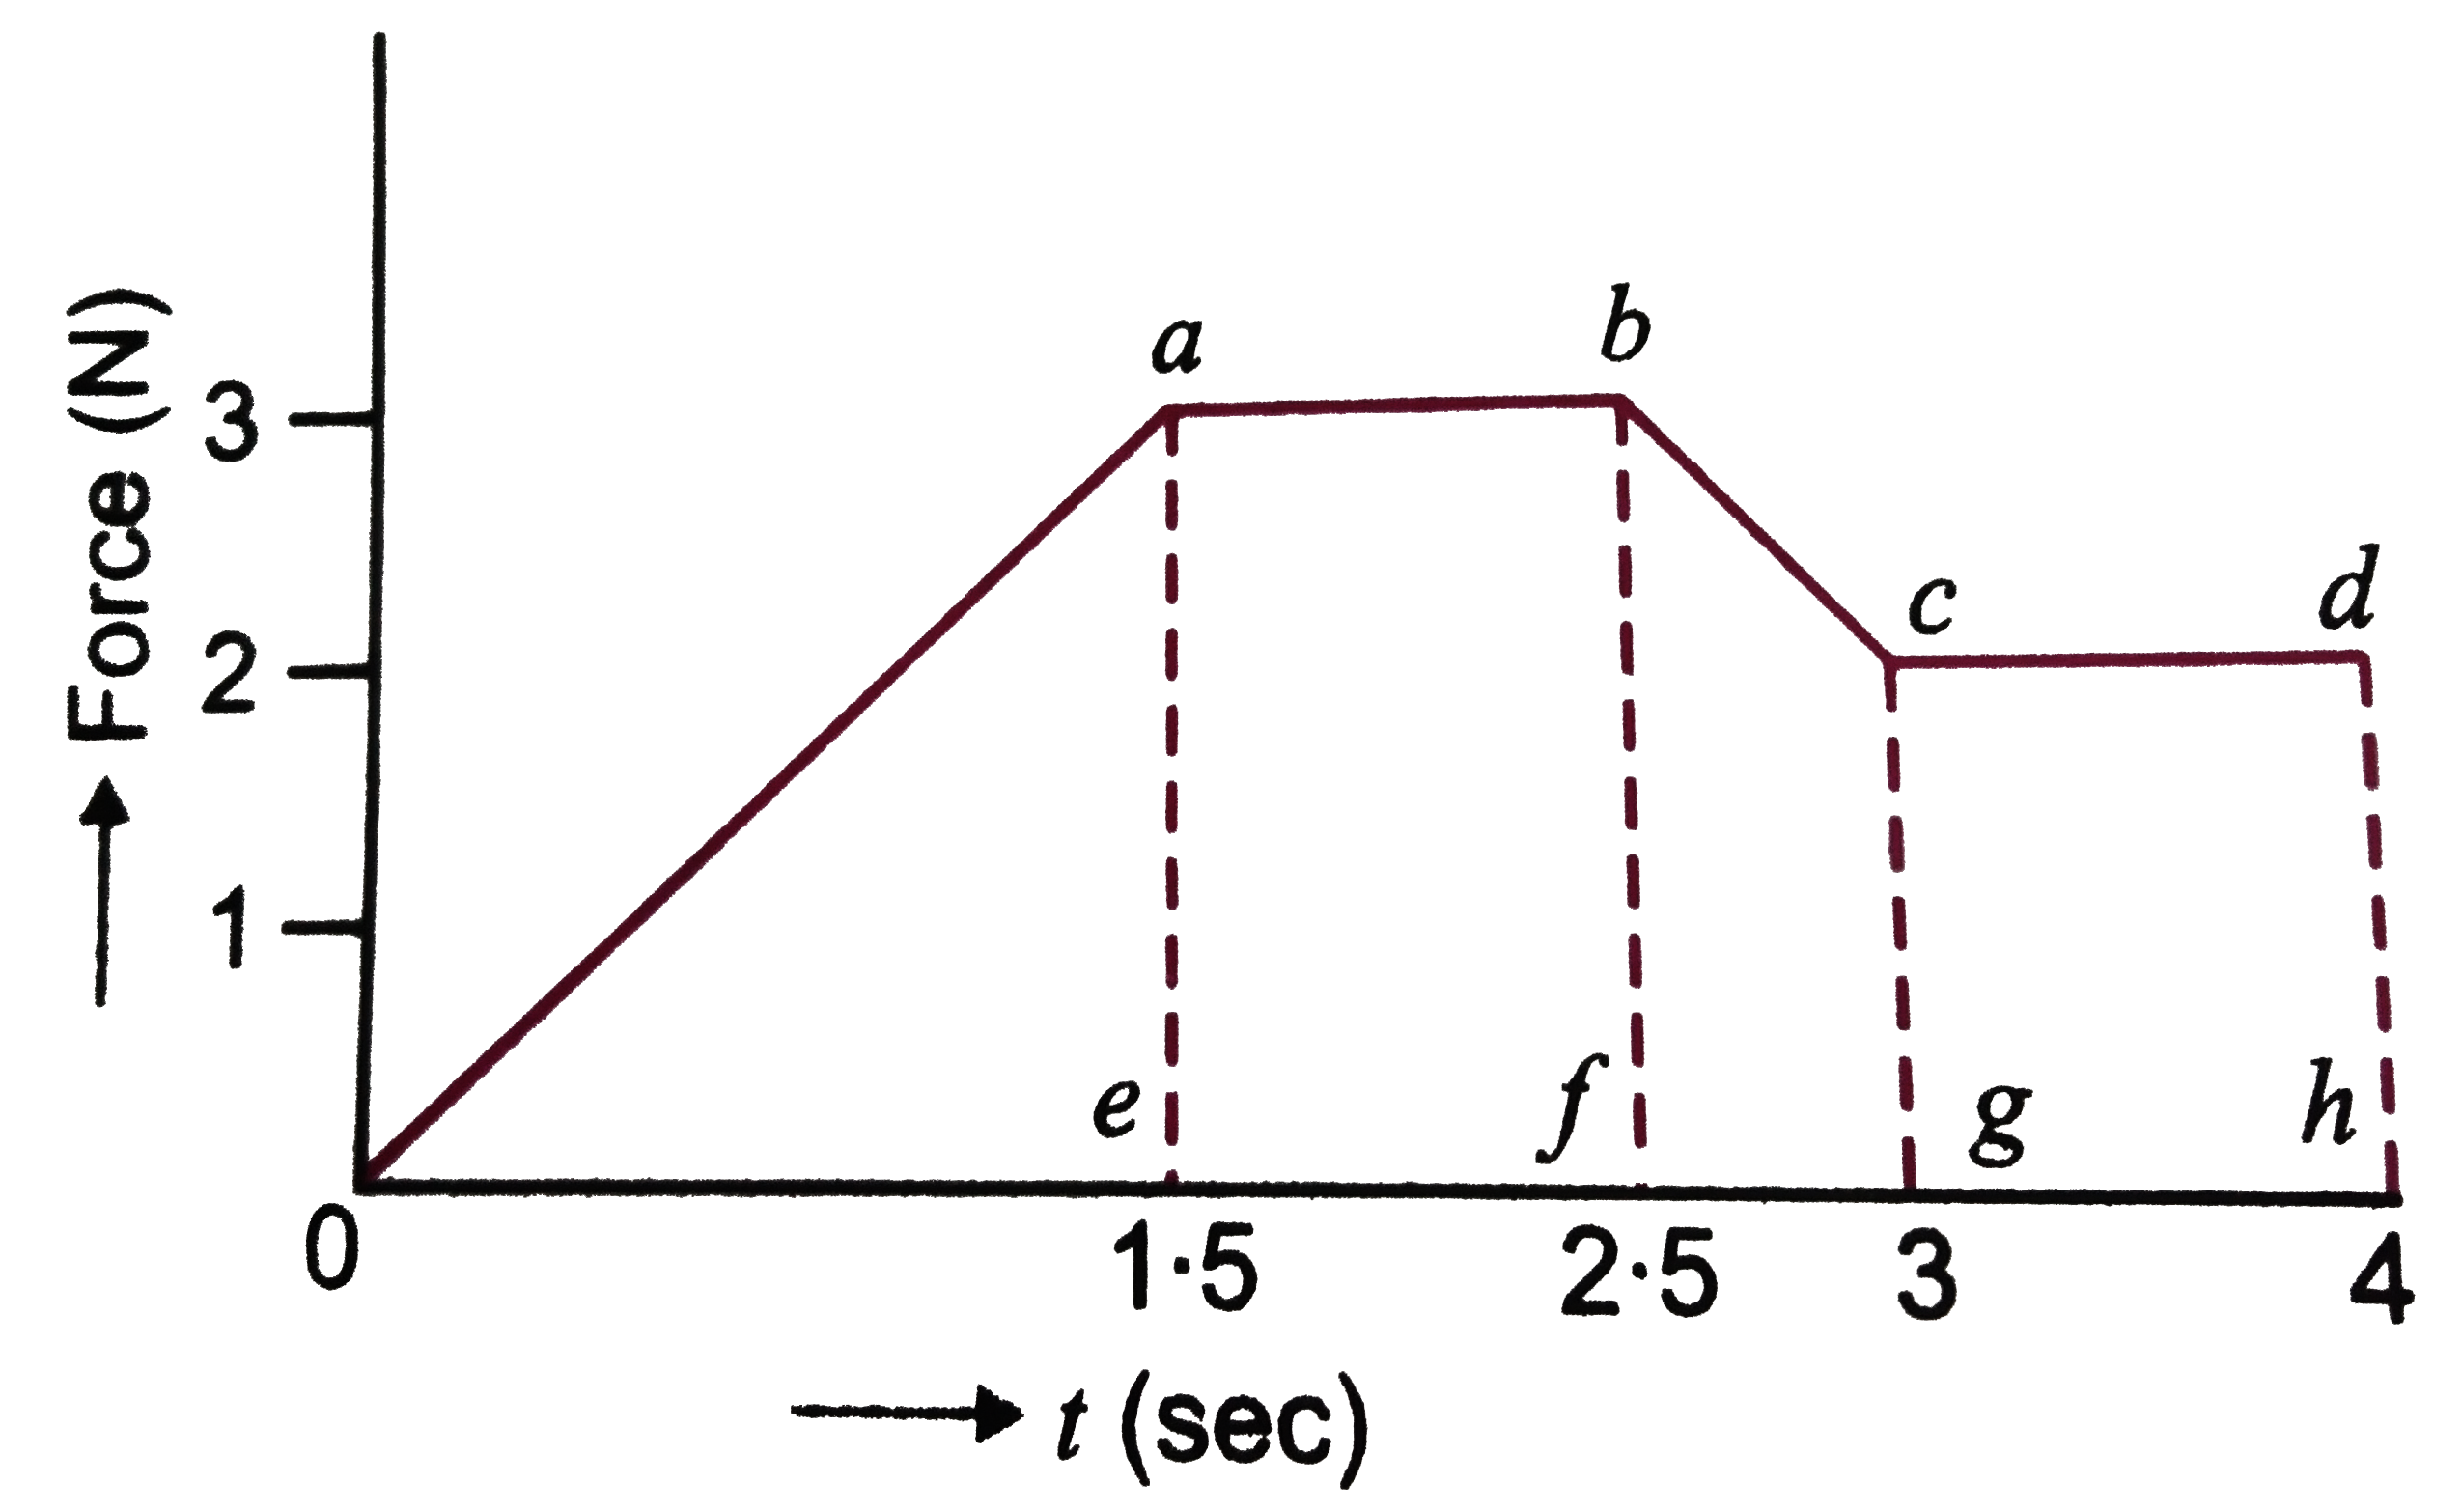
View SolutionThe initial speed of a body of mass 2kg is 5ms−1 A force acts for 4 seconds in the direction of motion of the body. The force time graph is shown in Calculate impulse of the force and also find the speed of the body .
 .
.
View Solution
Knowledge Check
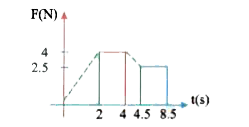
A body of mass 2kg has an initial speed 5ms−1. A force acts on it for 8.5 seconds in the direction of motion. The force time graph is shown in figure. The final speed of the body is
 A8.5ms−1B11ms−1C16.8125ms−1D4.31ms−1
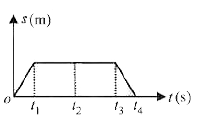
The displacement time graph of a body is shown in figure. The velocity-time graph of the motion of the body will be
 A
A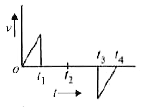 B
B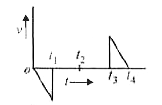 C
C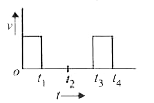 D
D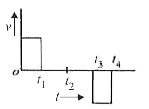
For body of 50 kg. mass, the velocity time graph is shown in figure. Then force acting on the body is :-
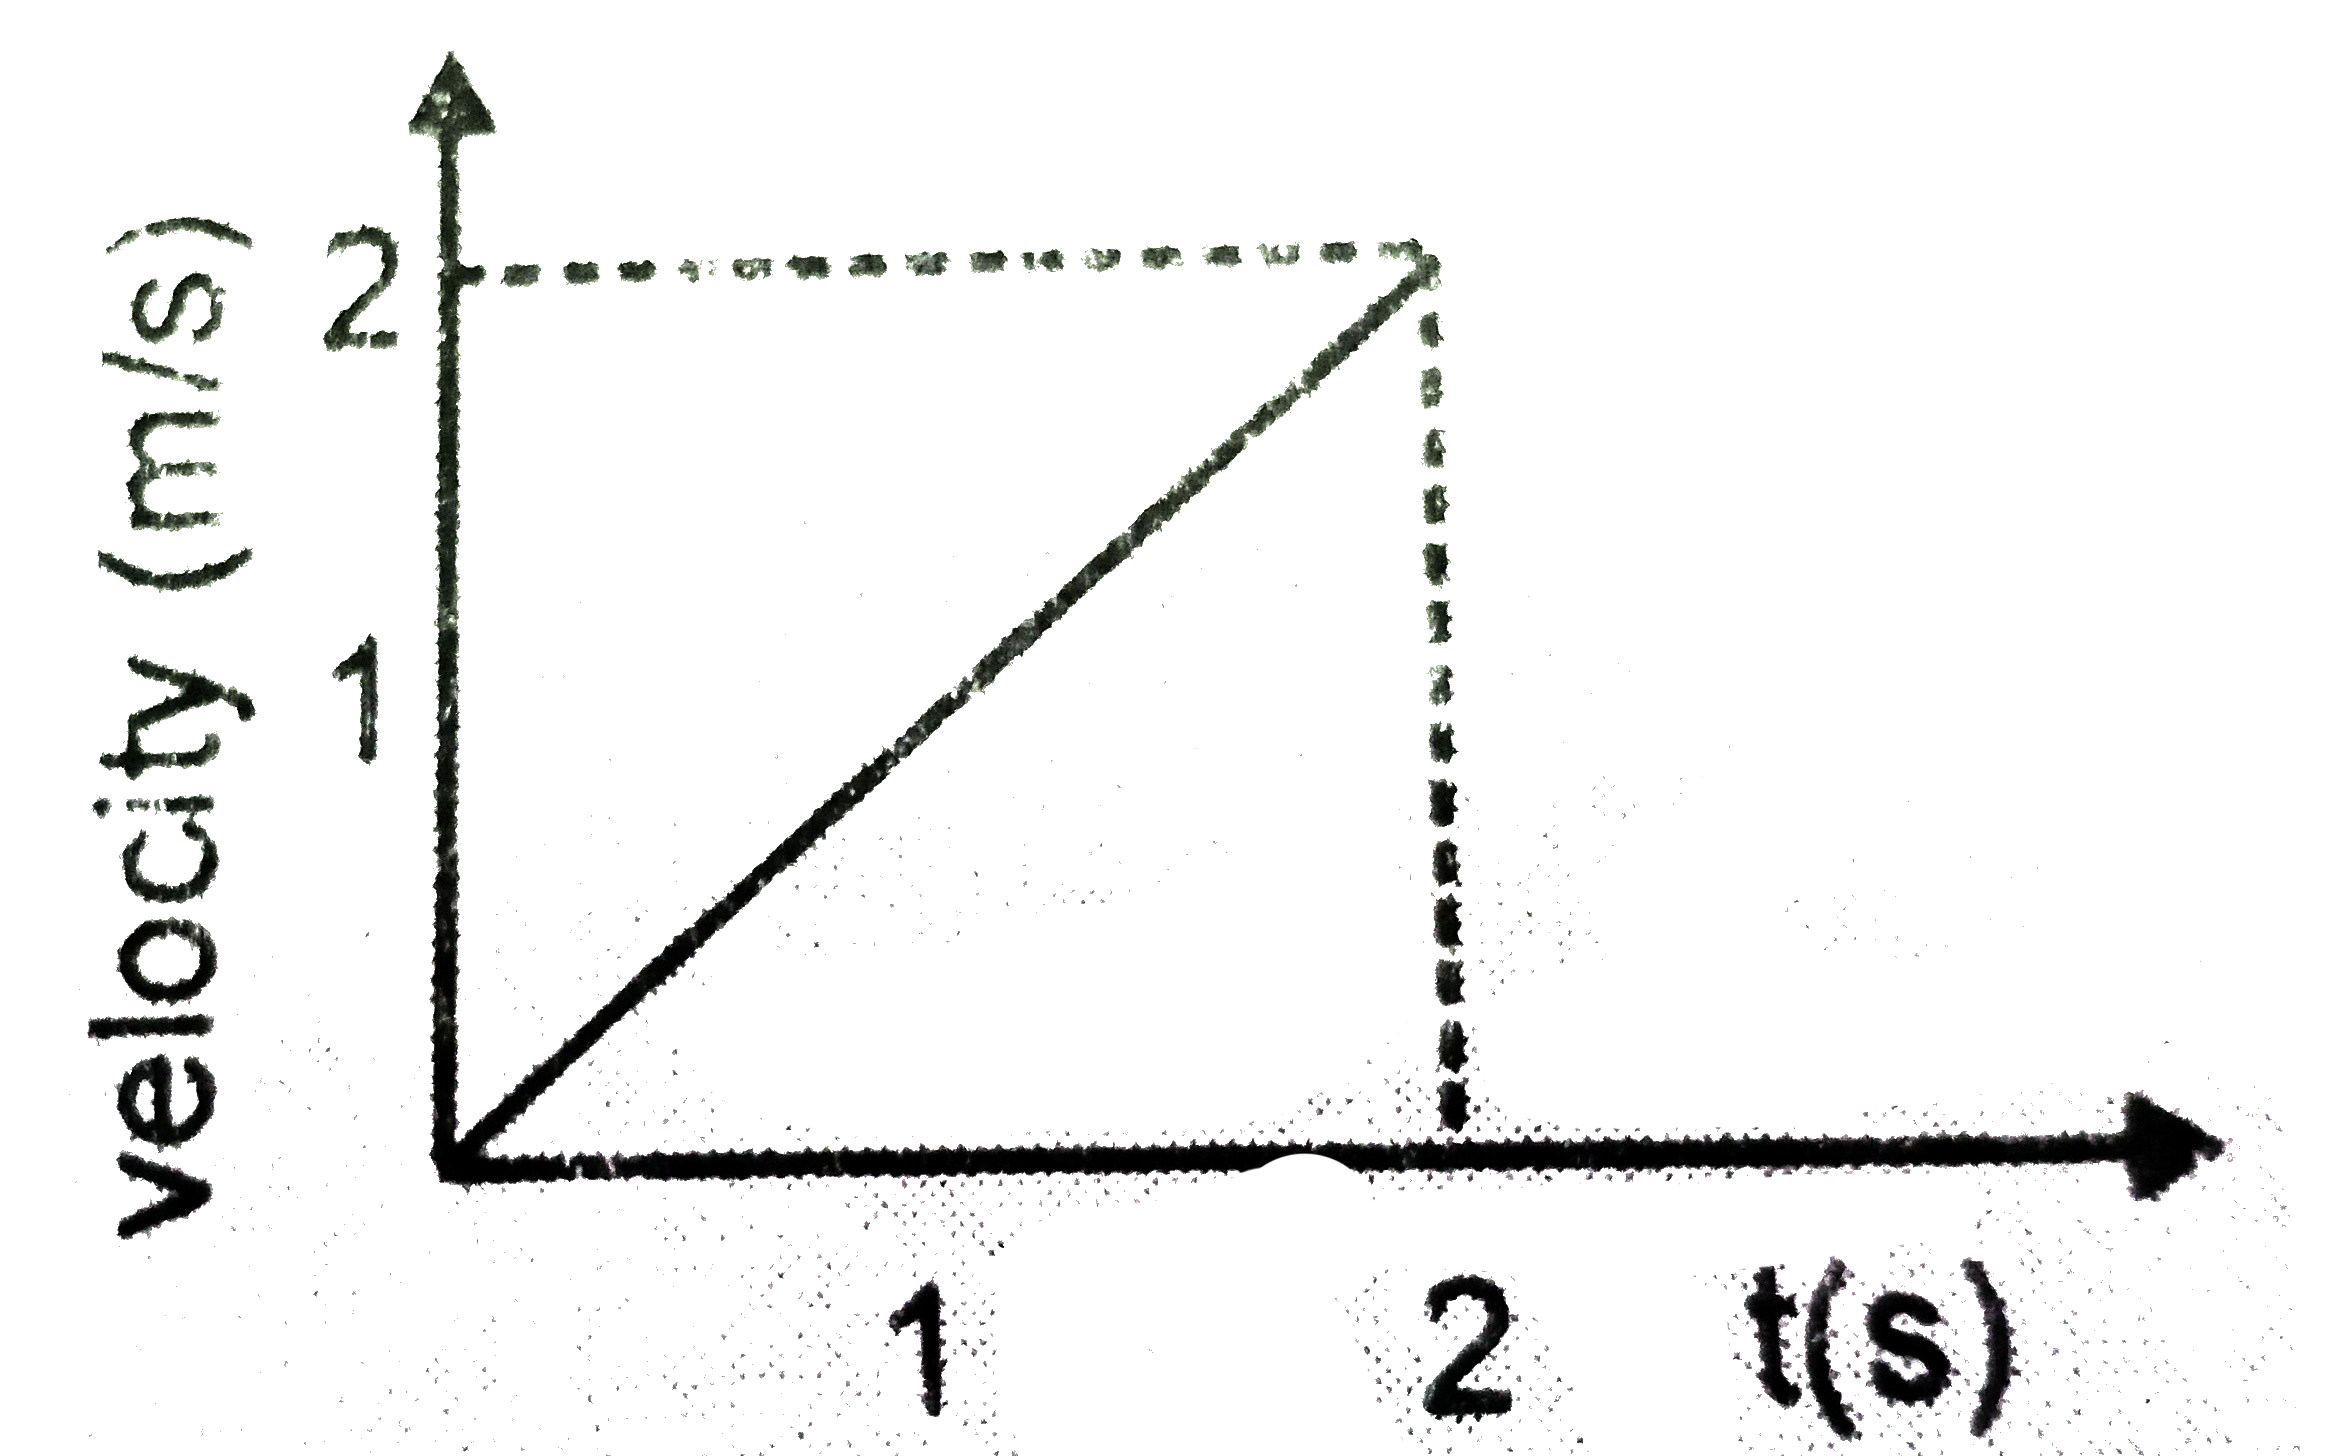 A25NB50NC12.5 ND100 N
The distance- time graph of a body is as shown in the figure. The part of the graph that represent the unifrom speed of the body is
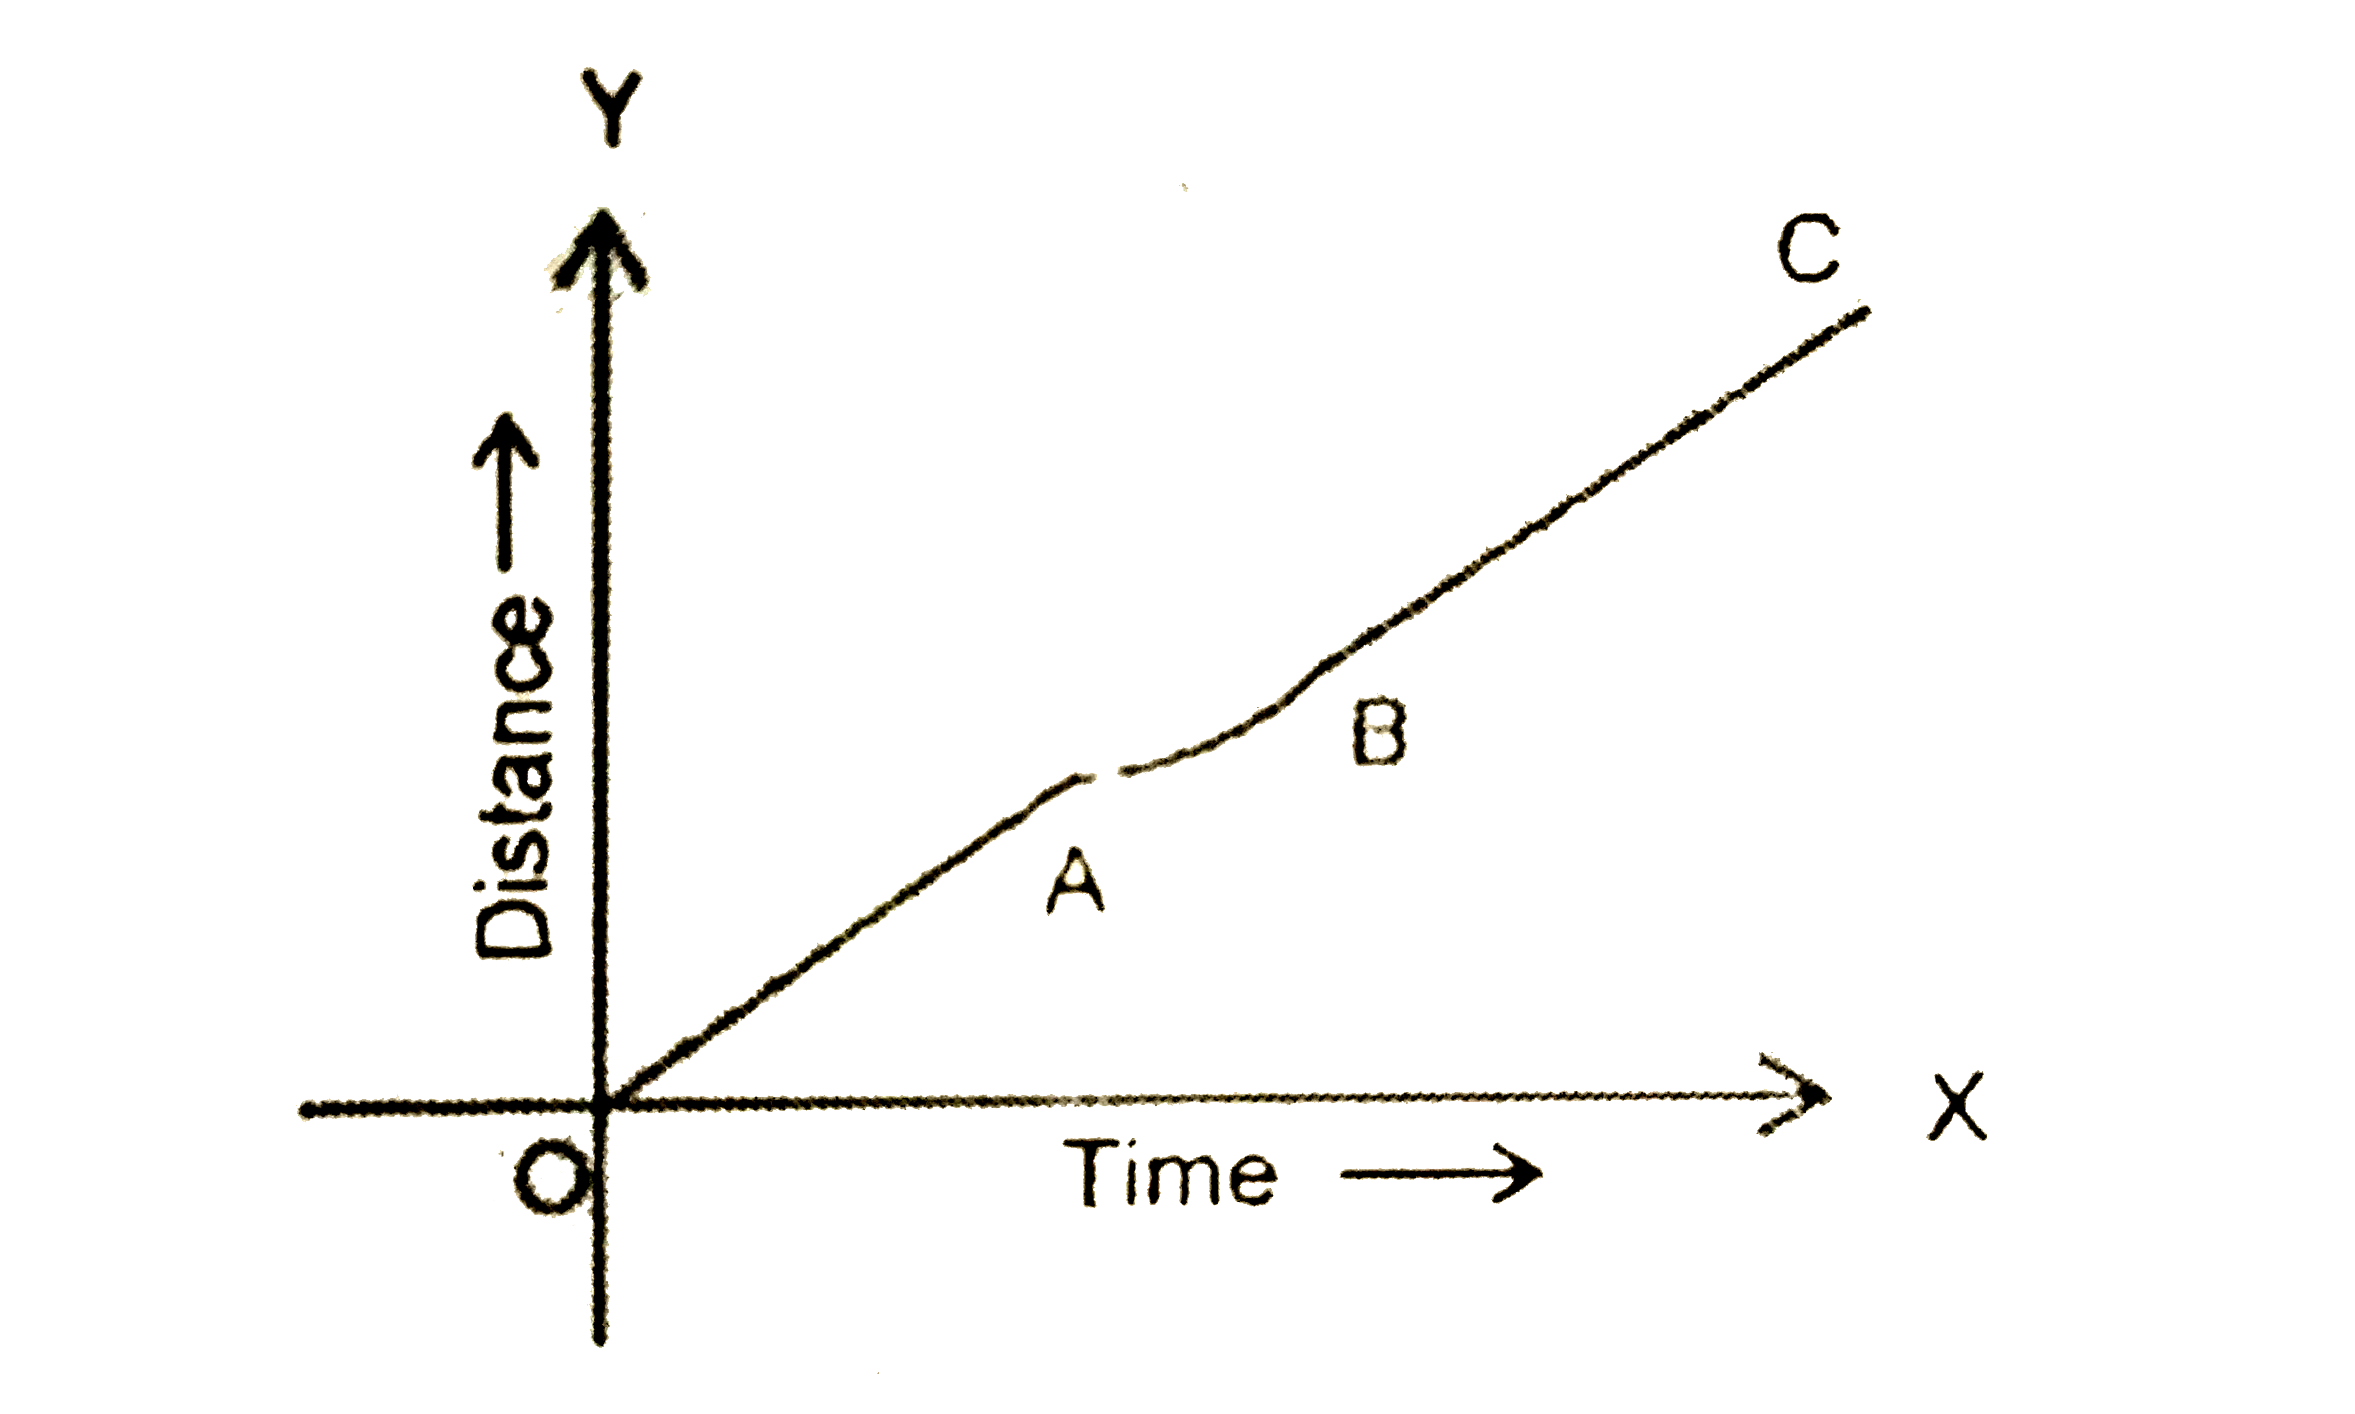
View SolutionThe distance- time graph of a body is as shown in the figure. The part of the graph that represent the unifrom speed of the body is

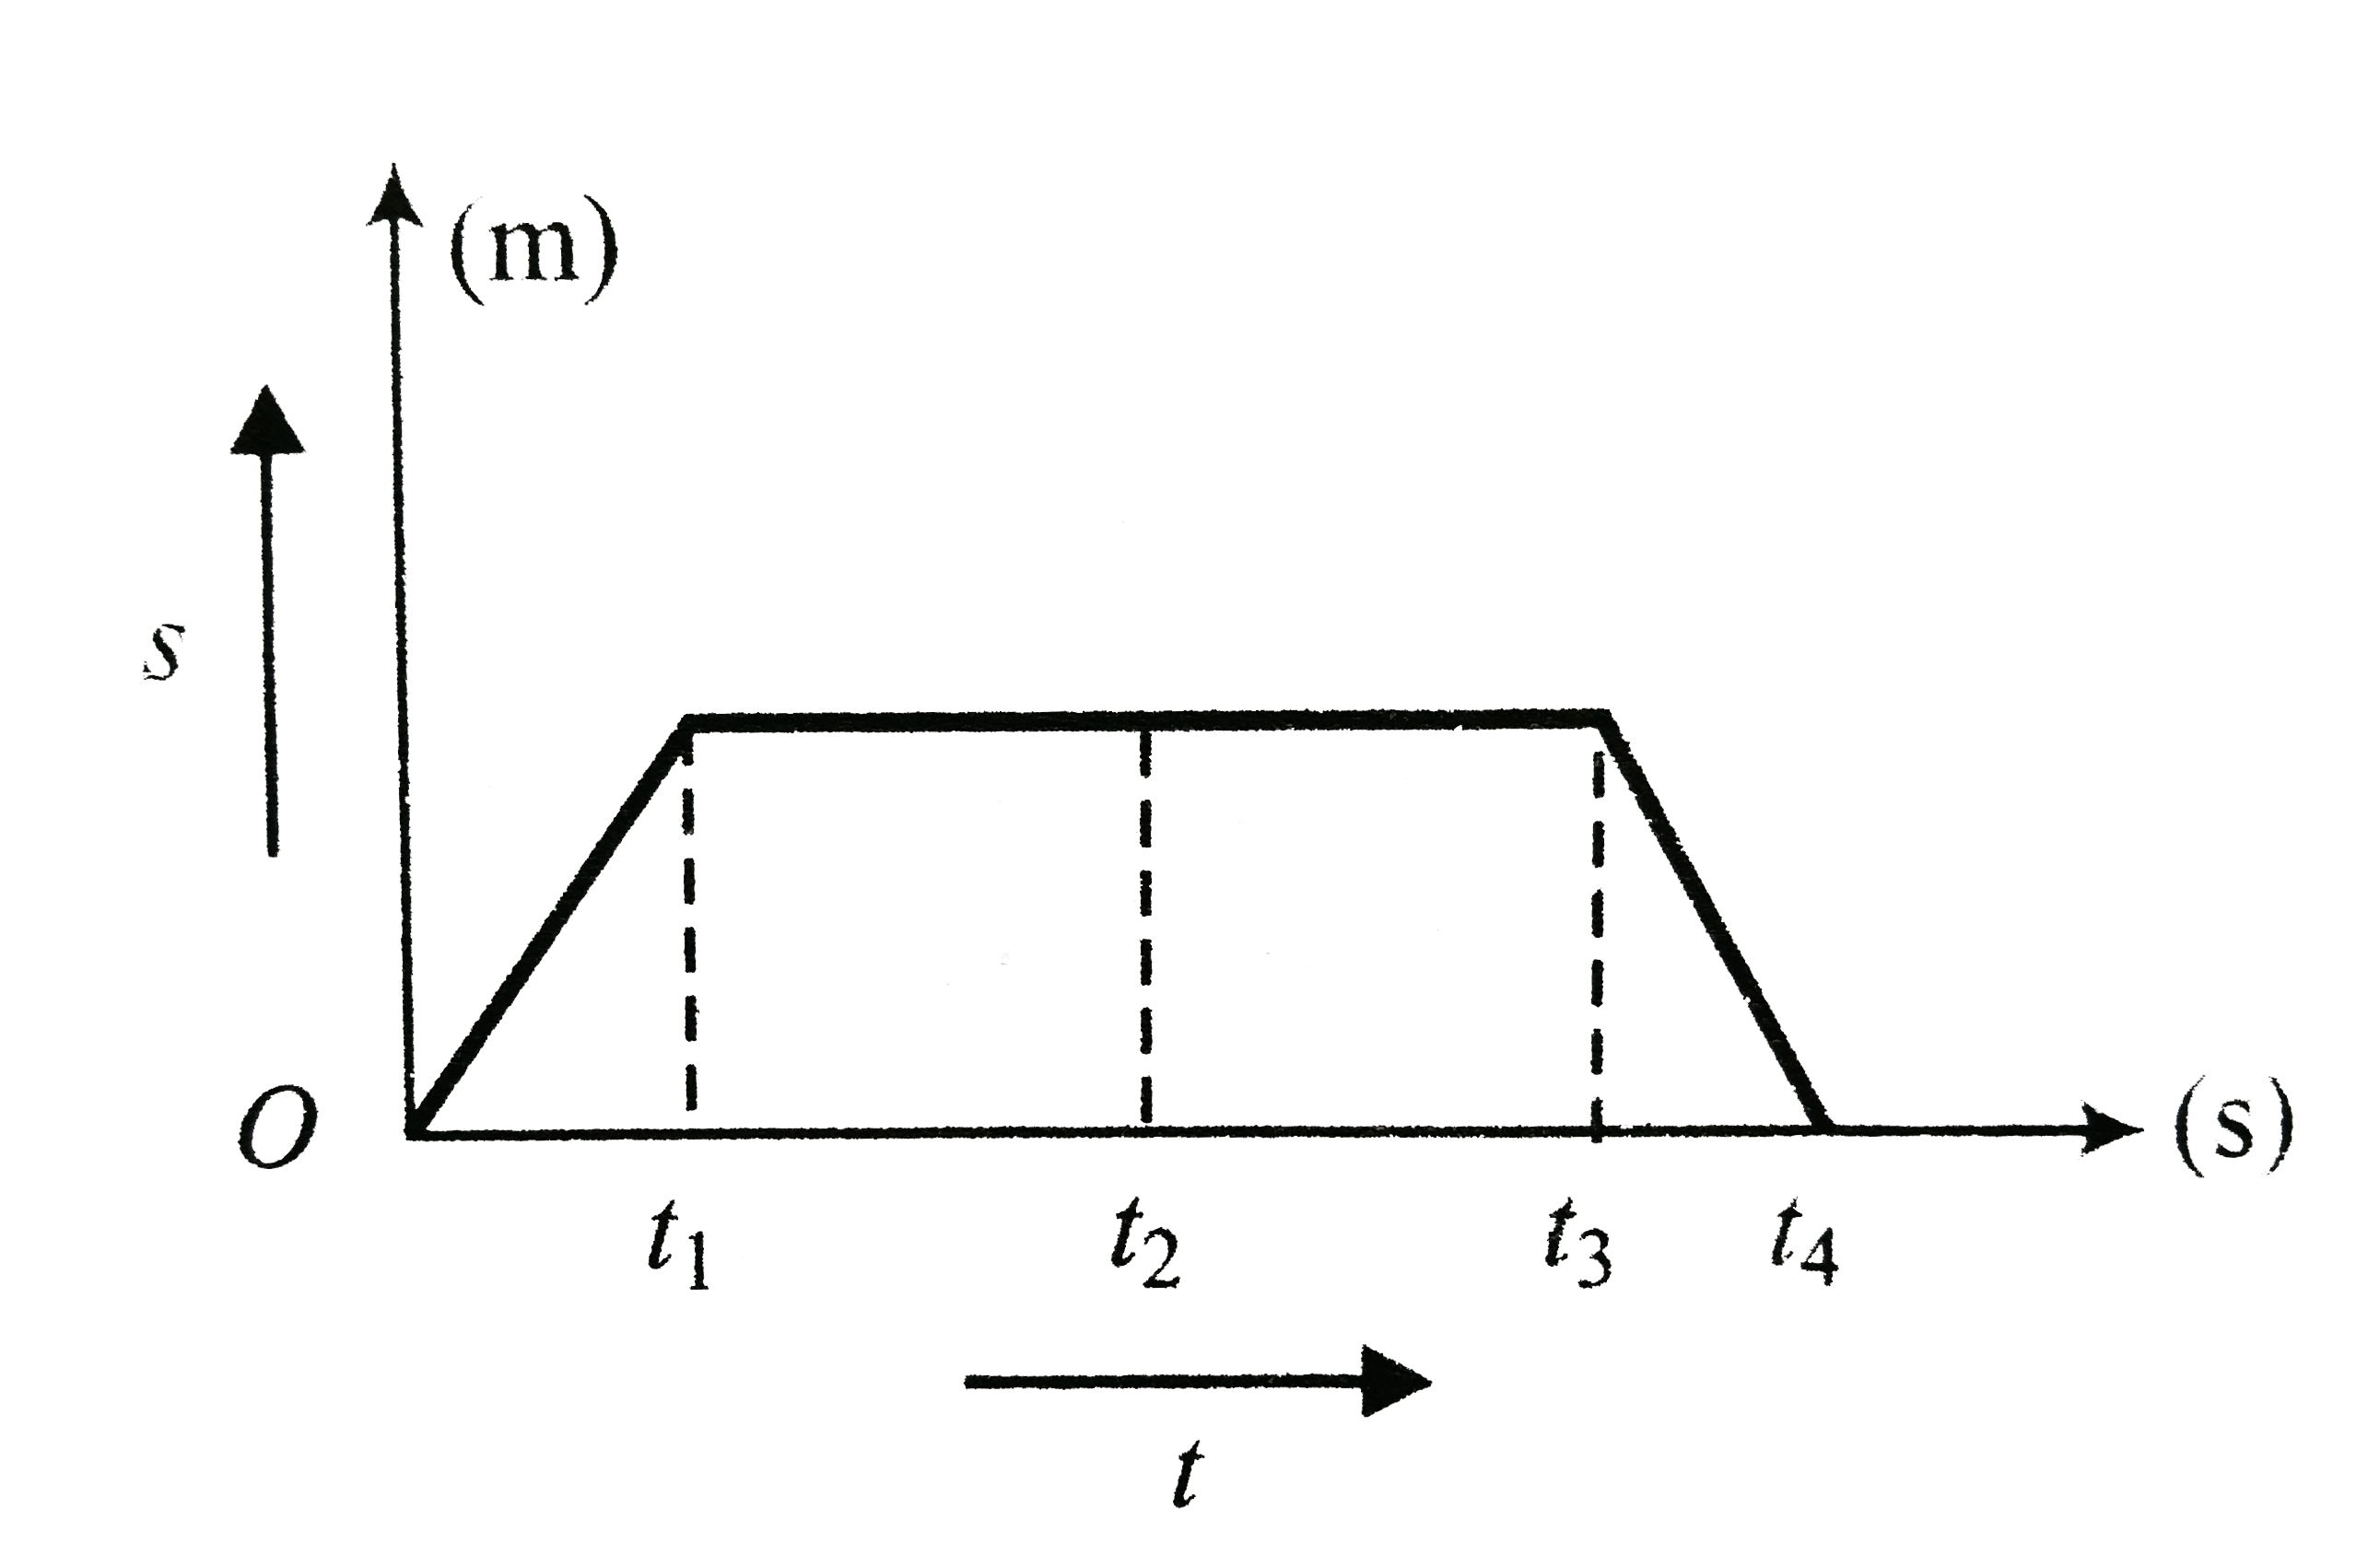
View SolutionThe displacement-time graph of a body is shown in.
 .
.
The velocity-time graph of the motion of the body will be .
View SolutionThe velocity - time graph of a body is given in figure below .
The acceleration-time graph of the motion of the body is
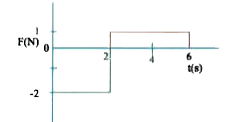
View SolutionA force time graph for the motion of a body is as shown in figure. Change in linear momentum between 0 and 6s is
View Solution
