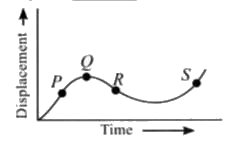
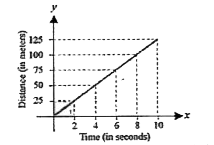
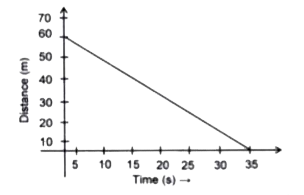
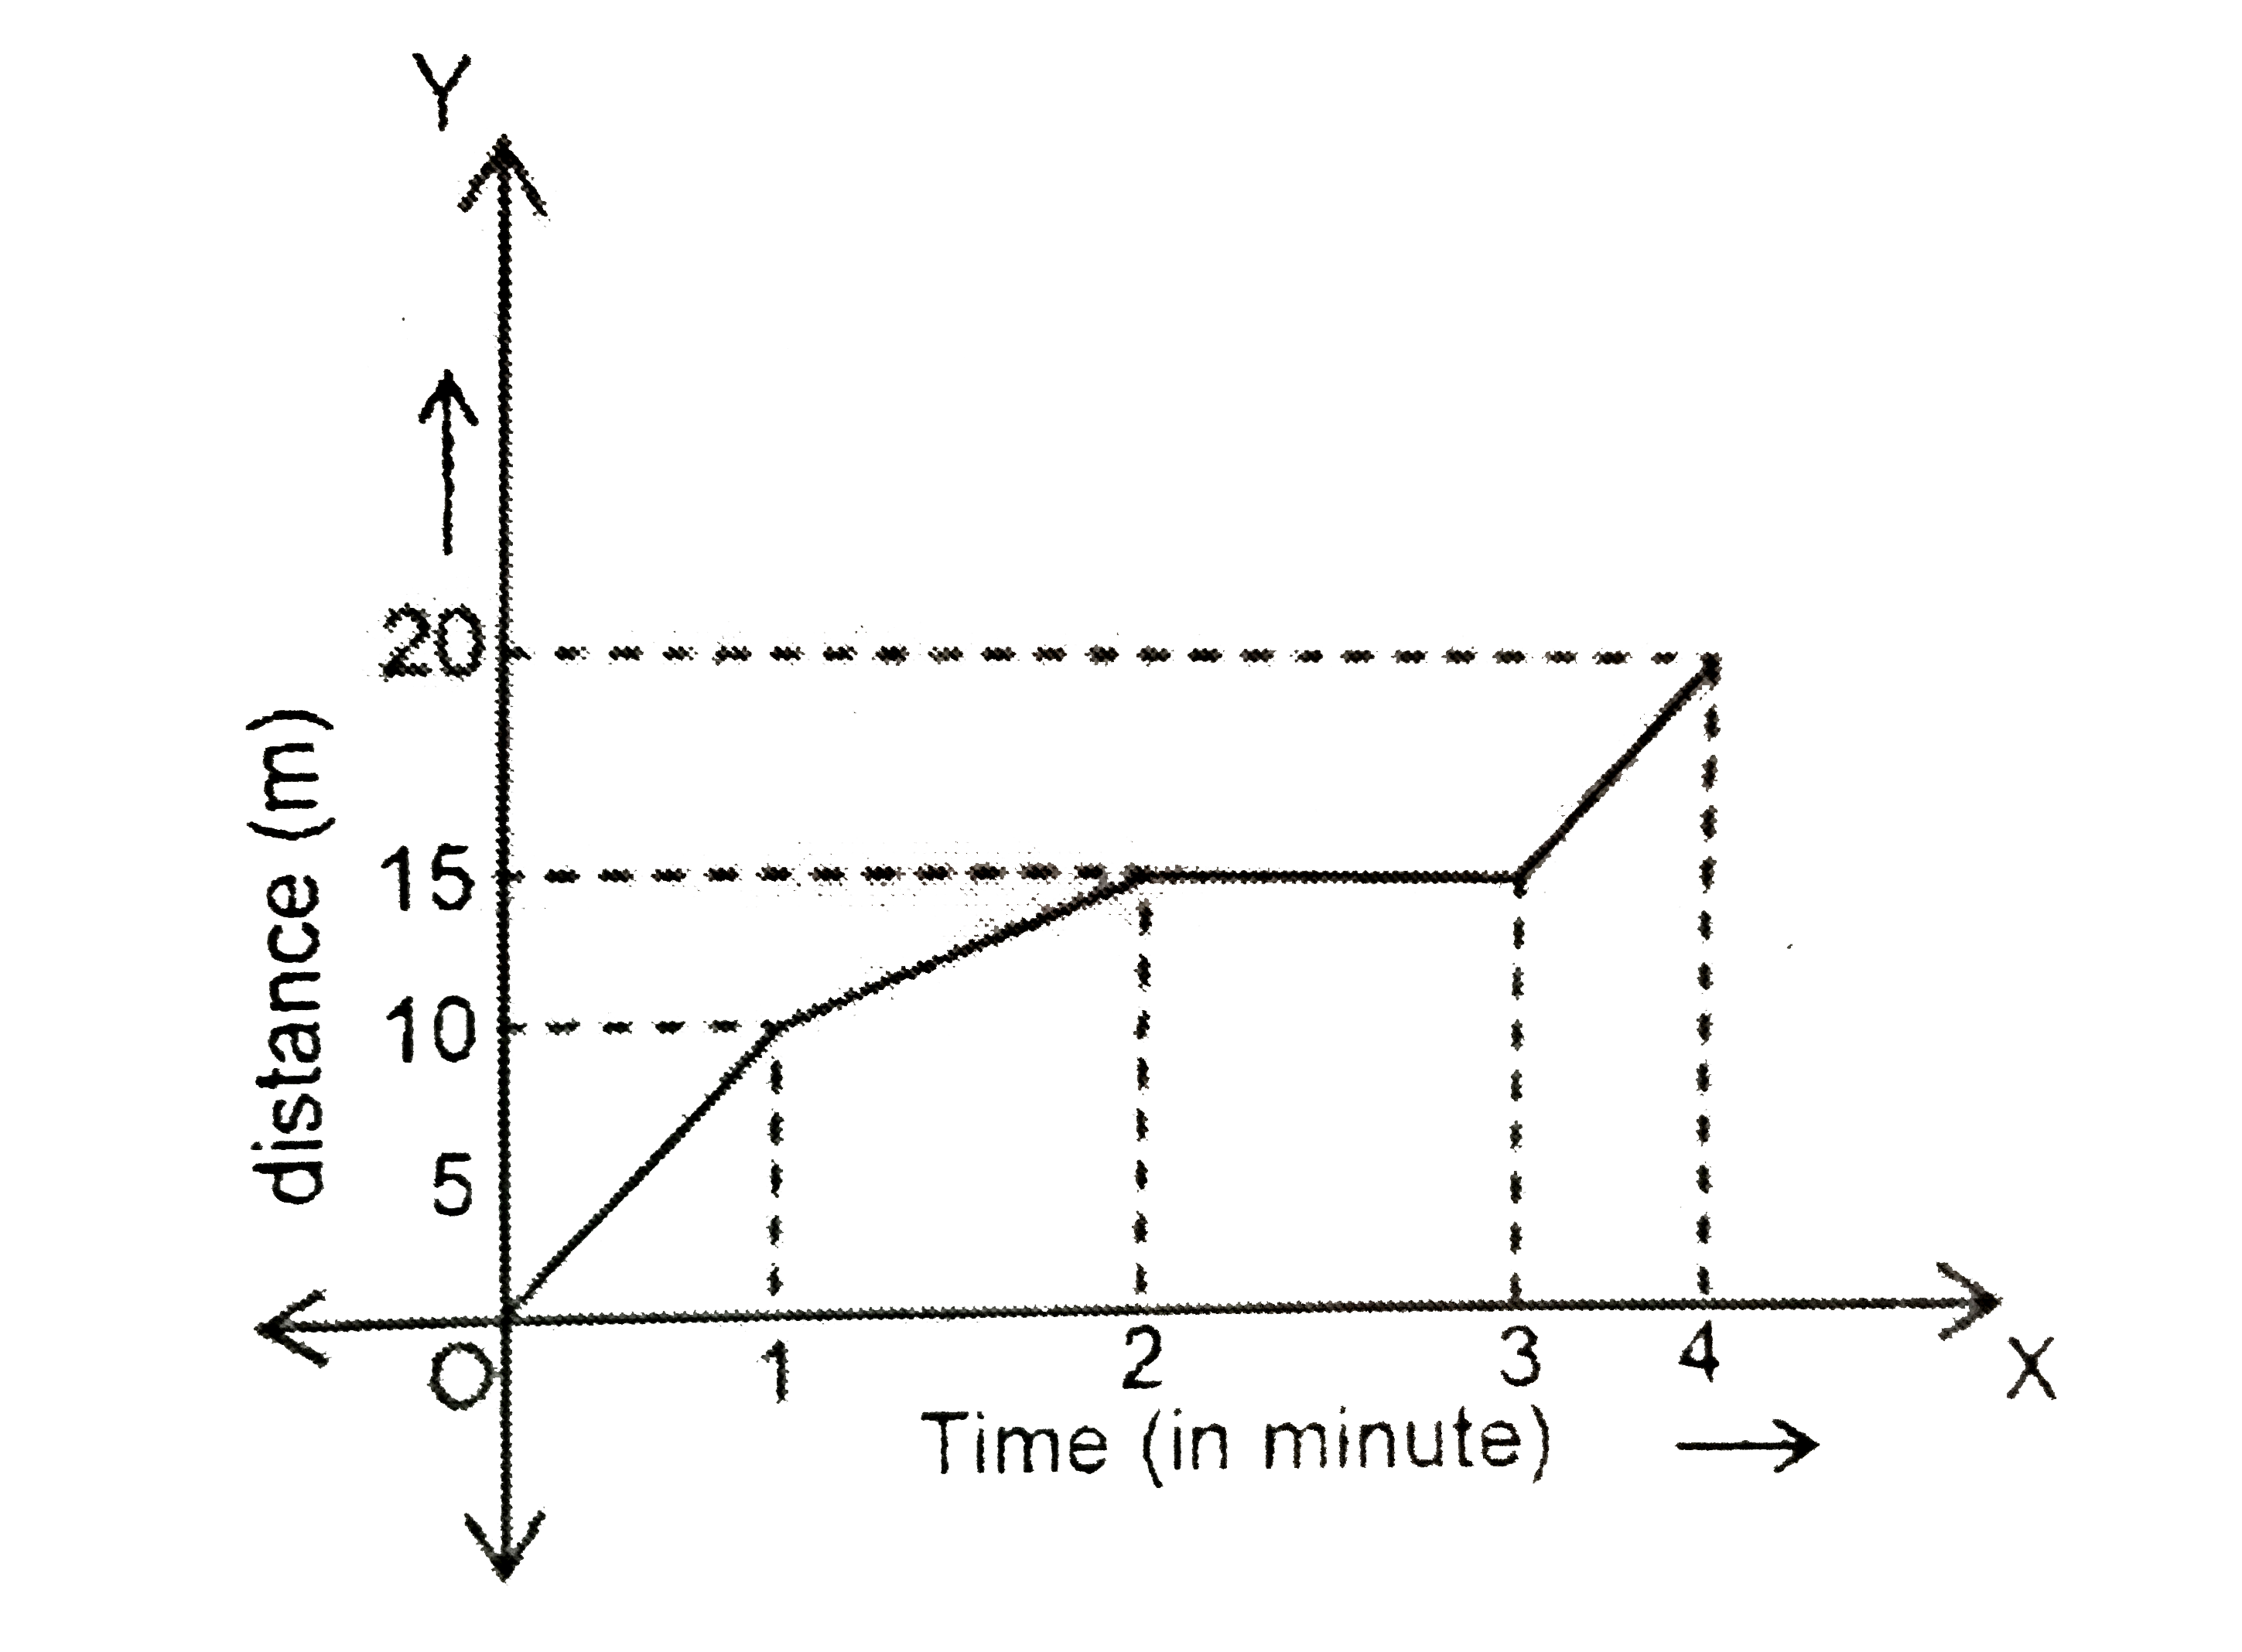
The distance-time graph of a moving vehicle is as shown in the figure.
The speed of the vehicle is increasing with time.
The speed of the vehicle is decreasing with time.
The final speed of the vehicle is zero.
Graph is not possible.
The correct Answer is:D
Graph is not possible.
Topper's Solved these Questions
- KINEMATICSBook:PEARSON IIT JEE FOUNDATIONChapter:KINEMATICSExercise:TEST YOUR CONCEPTS (VERY SHORT ANSWER TYPE QUESTIONS (MATCH THE COLUMN))
Explore 3 Videos
- KINEMATICSBook:PEARSON IIT JEE FOUNDATIONChapter:KINEMATICSExercise:TEST YOUR CONCEPTS (VERY SHORT ANSWER TYPE QUESTIONS (ANSWER THE FOLLOWING QUESTIONS))
Explore 16 Videos
- KINEMATICSBook:PEARSON IIT JEE FOUNDATIONChapter:KINEMATICSExercise:TEST YOUR CONCEPTS (VERY SHORT ANSWER TYPE QUESTIONS (FILL IN THE BLANKS))
Explore 8 Videos
- HEAT Book:PEARSON IIT JEE FOUNDATIONChapter:HEAT Exercise:Test 2
Explore 14 Videos
- LIGHTBook:PEARSON IIT JEE FOUNDATIONChapter:LIGHTExercise:ASSESSMENT TEST (TEST 2 (SELECT THE CORRECT ALTERNATIVE))
Explore 15 Videos
Similar Questions
Knowledge Check
The distance- time graph of a body is as shown in the figure. The part of the graph that represent the unifrom speed of the body is
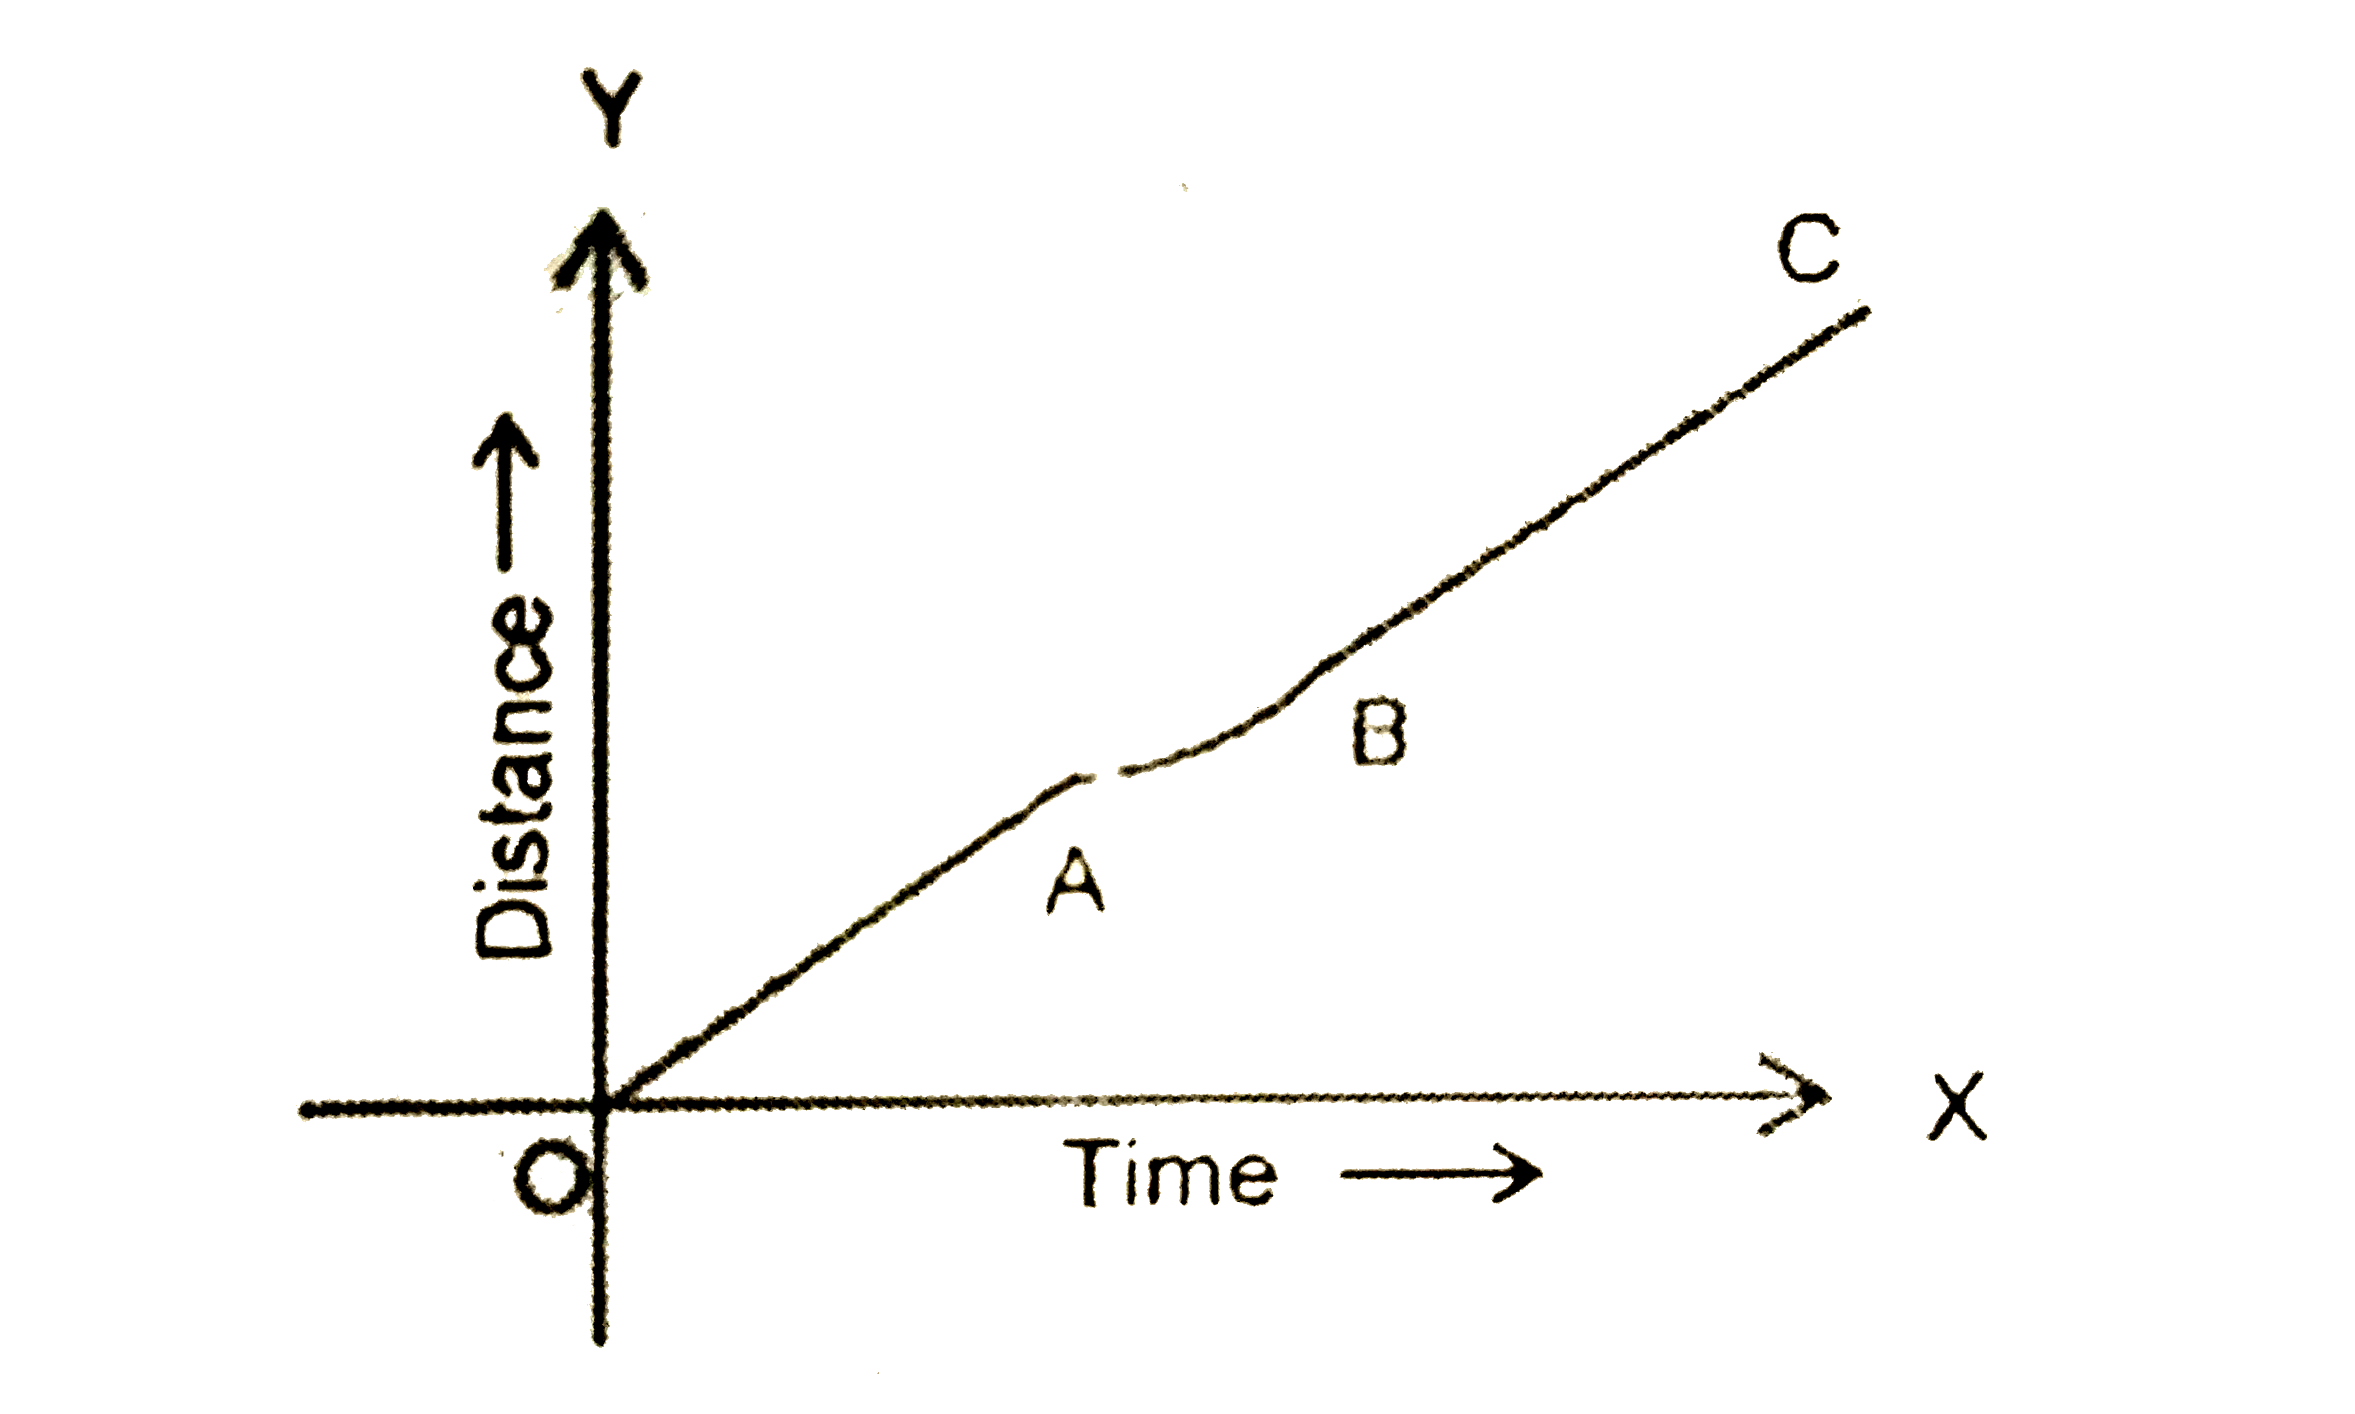 AOABABCBCDBoth OA and BC
The distance- time graph of a body is as shown in the figure. The part of the graph that represent the unifrom speed of the body is
 AOABABCBCDBoth OA and BC
Distance versus time graph of an object is as shown in the figure. The average speed of the object is _____ ms−1
 A0.08B0.5C1D2
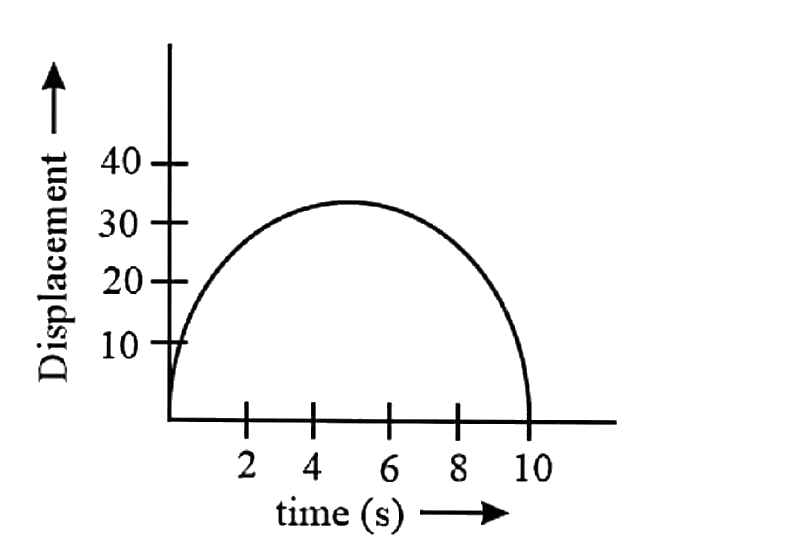
The displacement-time of a moving object is shown in figure. Which of the velocity-time graphs shown in figure could represent the motion of the same body?
View SolutionDistance versus time graph of an object is as shown in the figure. The average speed of the object is _____ ms−1

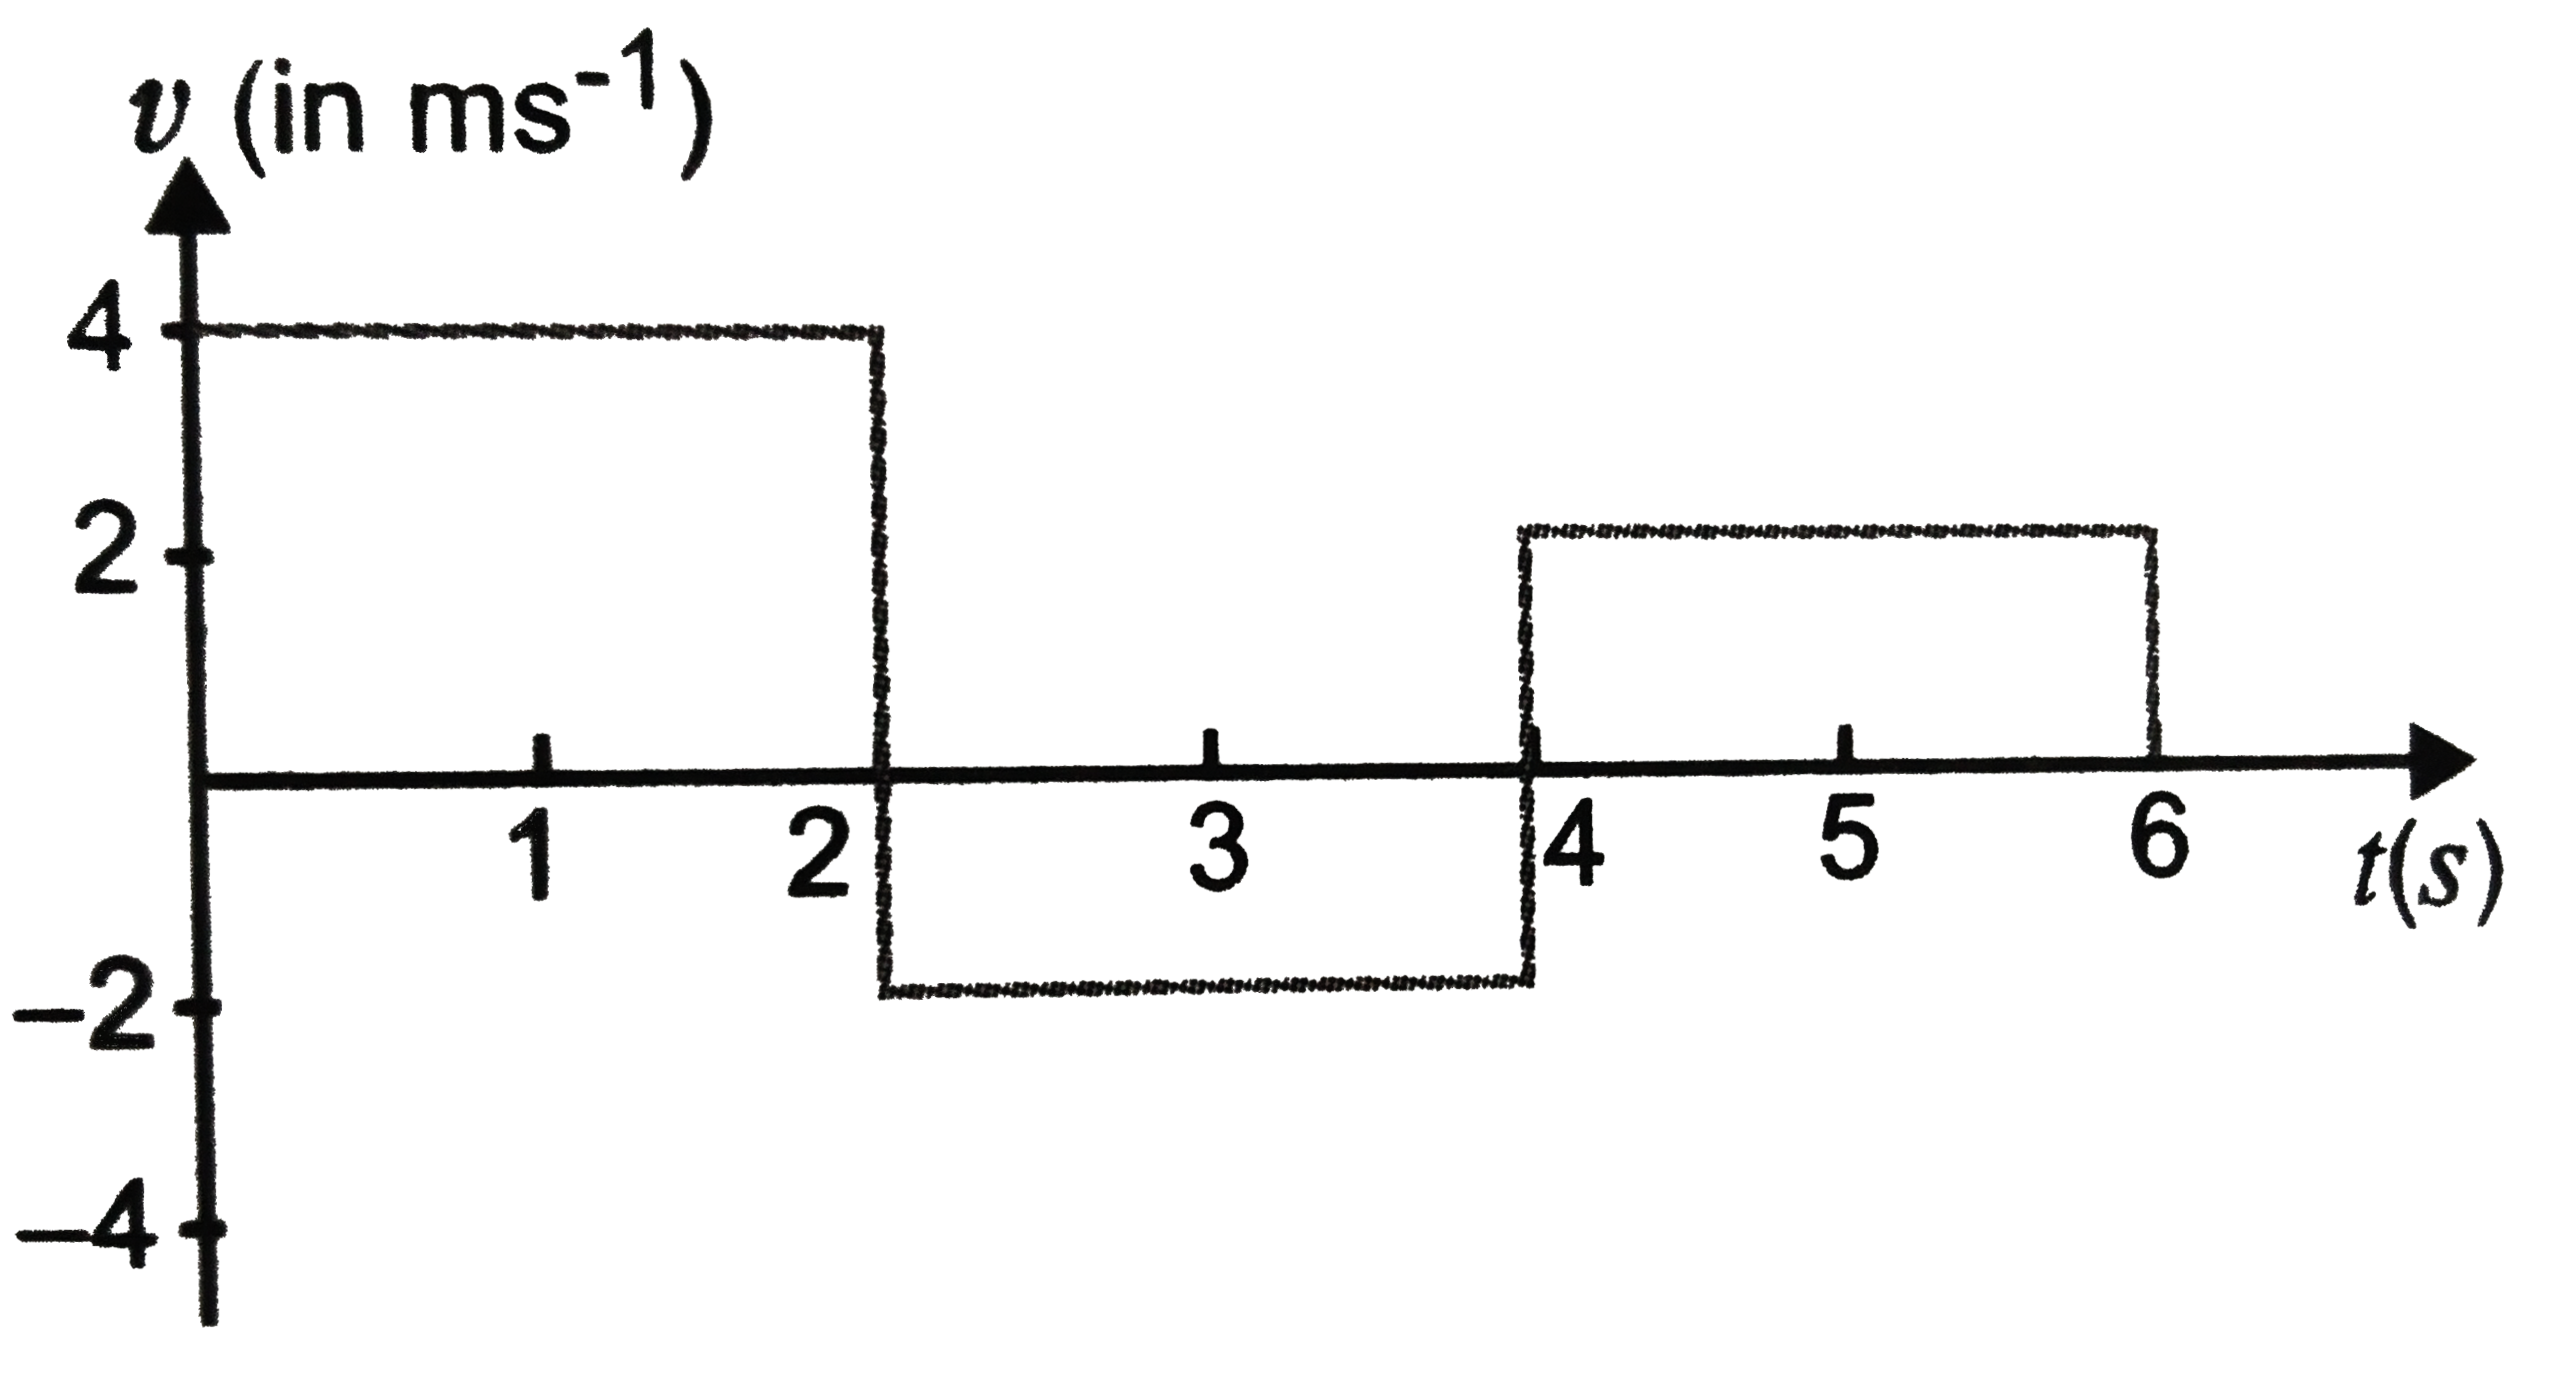
View SolutionThe velocit-time graph of a body moving in a straight line is shown in Fig. 2 (d) . 32. Find the displacement and the distance travelled by the body in 6seconds.
 .
.
View SolutionThe velocity − time graph of a particle is as shown in figure

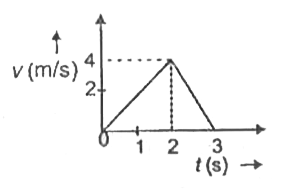
View SolutionThe velocity versus time graph of a body moving in a straight line is as shown in the figure below
View Solution
