Two different models of TV sets are produced in a factory and are given below as a double bar graph. Read the data and answer the following questions:
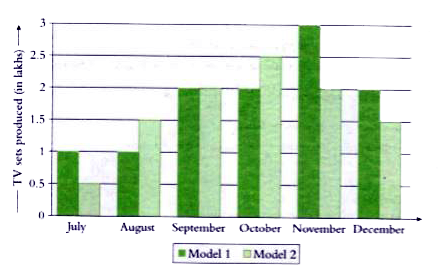
In which month, both the models of TV sets produced are equal?
The correct Answer is:September
Step by step video & image solution for Two different models of TV sets are produced in a factory and are given below as a double bar graph. Read the data and answer the following questions: In which month, both the models of TV sets produced are equal? by Maths experts to help you in doubts & scoring excellent marks in Class 7 exams.
Updated on:21/07/2023Similar Questions
Two different models of TV sets are produced in a factory and are given below as a double bar graph. Read the data and answer the following questions:
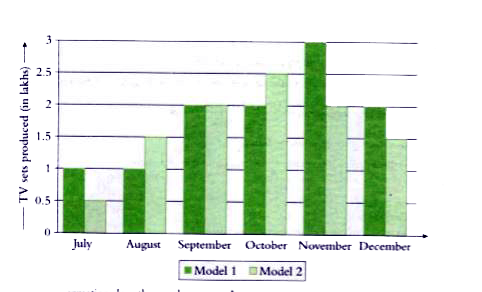
In which month, both the models of TV sets produced are minimum and how many are they?
View SolutionTwo different models of TV sets are produced in a factory and are given below as a double bar graph. Read the data and answer the following questions:
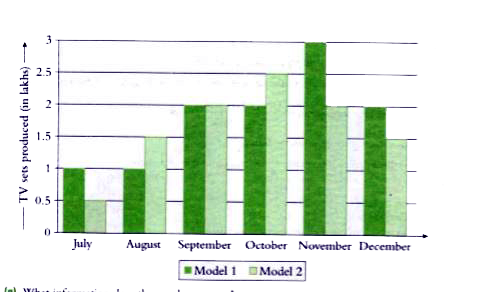
In which month, both the models of TV secs produced are maximum?
View SolutionTwo different models of TV sets are produced in a factory and are given below as a double bar graph. Read the data and answer the following questions:
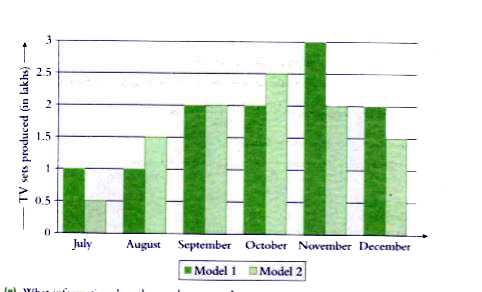
What information does the graph represent?
View SolutionTwo different models of TV sets are produced in a factory and are given below as a double bar graph. Read the data and answer the following questions :
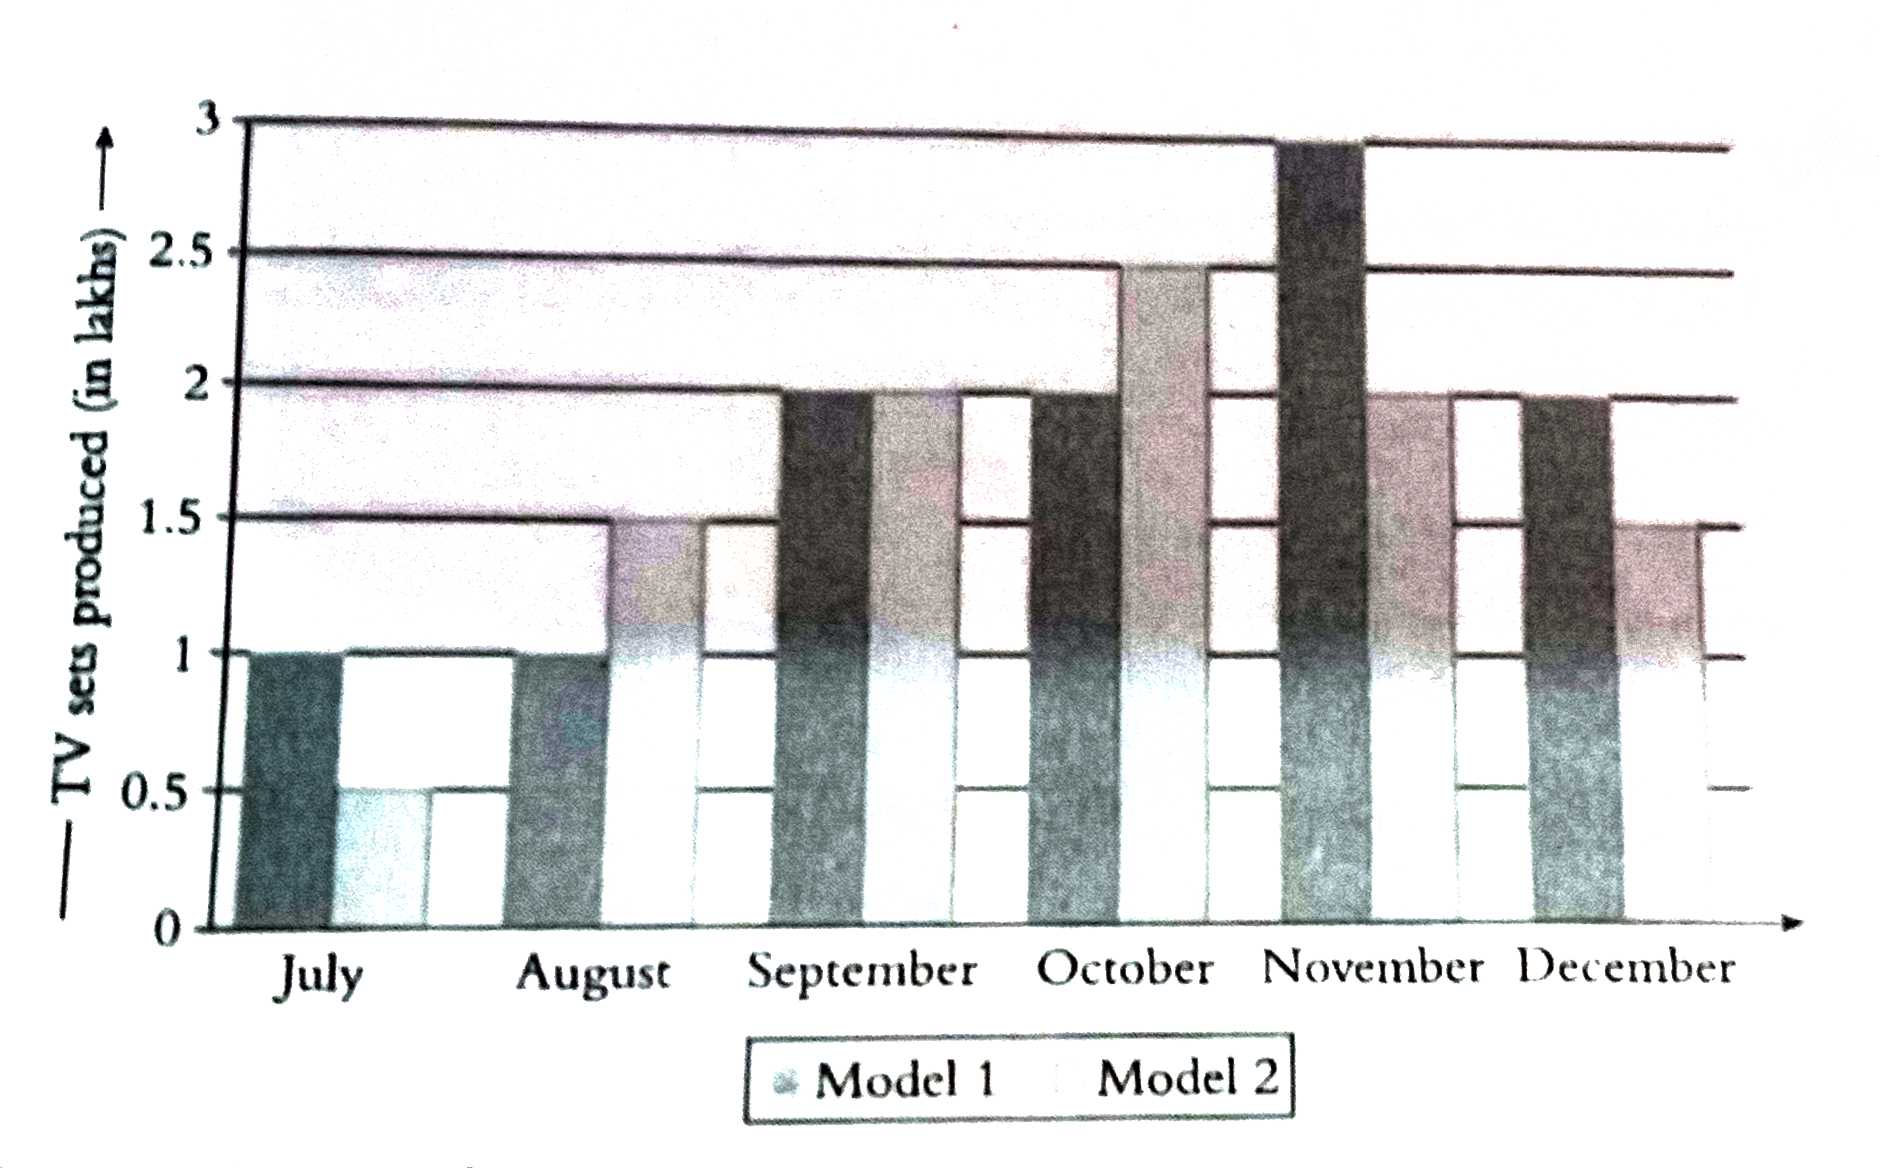
(A) What information does the graph represent ?
(b) In which month, both the models of TV sets produced are equal ?
(c) In which month, both the model of TV sets produced are maximum ?
(d) In which month, both the models of TV sets produced are minimum and how many are they ?
View SolutionRead the bar graph given below and answer the following questions:

In which year is the number of students maximum?
View SolutionRead the bar graph given below and answer the following questions:

In which year is the number of students twice as that of 2001-02?
View SolutionRead the bar graph given below and answer the following questions:
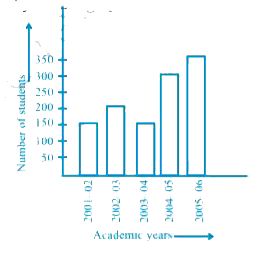
In which year did the number of students decrease as compared to previous year?
View SolutionRead the bar graph given below and answer the following questions:
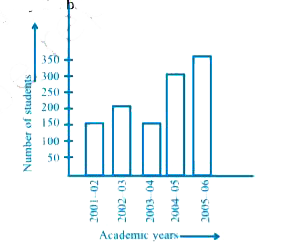
In which year is the increase in number of students maximum as compared to the previous year?
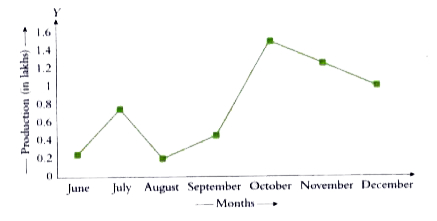
View SolutionThe line graph given below shows the production of a particular model of bike produced in different months. Read the line graph and answer the following questions:
In which month is the production least?
View SolutionRead the bar graph given below and answer the following questions:
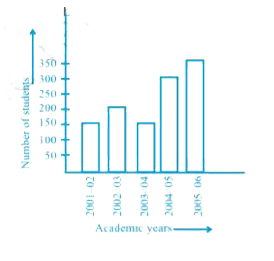
What information is given by the þar graph?
View Solution
