A curve drawn at constant temperature is called an isotherm. This shows the relationship between :
P and 1V
PV and V
V and 1P
P and V.
The correct Answer is:D
To solve the question regarding the relationship shown by an isotherm, we can follow these steps:
1. Understanding Isotherm: An isotherm is a curve that represents the behavior of a gas at a constant temperature. According to the ideal gas law, the relationship between pressure (P), volume (V), and temperature (T) is given by the equation PV = nRT, where n is the number of moles and R is the ideal gas constant.
2. Applying Boyle's Law: At constant temperature, Boyle's Law states that the pressure of a gas is inversely proportional to its volume. This means that if the volume decreases, the pressure increases, and vice versa. Mathematically, this can be expressed as:
P∝1VorPV=k(where k is a constant)
3. Graphical Representation: When we plot pressure (P) against volume (V) at constant temperature, we will get a hyperbolic curve. This curve indicates that as pressure increases, volume decreases, and as volume increases, pressure decreases.
4. Identifying the Relationship: From the above analysis, we can conclude that the isotherm shows the relationship between pressure (P) and volume (V) of a gas at constant temperature.
5. Final Answer: Therefore, the correct answer to the question is that the isotherm shows the relationship between pressure and volume.
P∝1VorPV=k(where k is a constant)
Similar Questions
Lichens show symbiotic relationships between
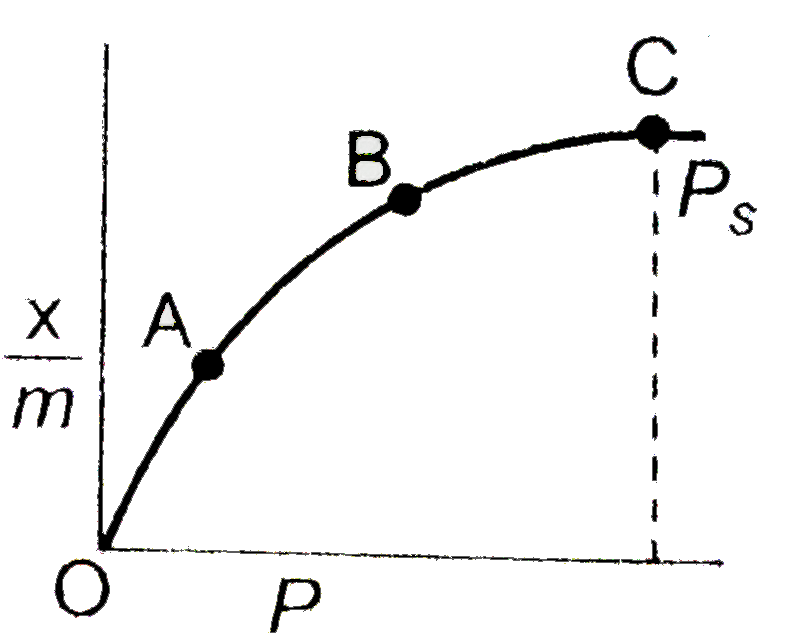
View SolutionA group between x/m and the presure P of the gas at a constant temperature is called adsorption siotherm. Where x is the no. of moles of the adsorbate and m is the mass of the adsorbent. adsoption isotherms of different shaopes have been experimentally observed .. According to frundlich adosroption isthem,
x/m=KP1/n
where K and N are constant paraments depending upon the nature of the solid and gas
Inn the given isotherm select the incorrect statement :

View Solution
Knowledge Check
a=1,052+1.08t
The speed of a sound wave in air depends on the air temperature. The formula above shows the relationship between a, the speed of a sound wave, in feet per second, and t, the air temperature, in degrees Fahrenheit (.∘F).
Which of the following expresses the air temperature in terms of the speed of a sound wave?At=a−1,0521.08Bt=a+1,0521.08Ct=1,052−a1.08Dt=1.08a+1,052
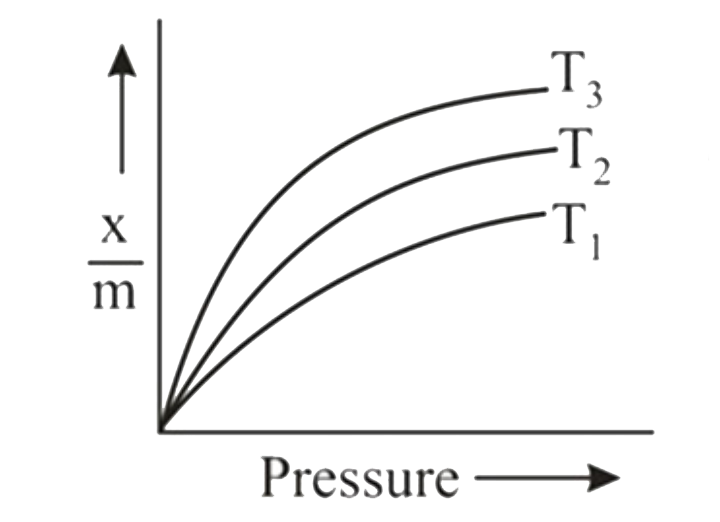
The variation of extent of adsorption with pressure at a given constant temperature is given in following figure

Which of the following relation between temperature of isotherms is correct ?
View SolutionA curve between magnetic moment and temperature of magnet is
View SolutionBerllium shows diagonal relationship with
View SolutionBe shows diagonal relationship with-
View SolutionThe rate constant (K') of one reaction is double of the rate constant (K") of another reaction. Then the relationship between the corresponding activation energies of the two reactions (E′aandE''a) will be
View SolutionSilicon shows diagonal relationship with .
View SolutionWhat is the nature of curve by plotting P against PV at constant temperature for a gas ? What is the name assigned to this curve ?
View Solution
