What is the nature of curve by plotting P against PV at constant temperature for a gas ? What is the name assigned to this curve ?
To answer the question regarding the nature of the curve when plotting pressure (P) against PV at constant temperature for a gas, we can follow these steps:
1. Understand the Relationship: According to Boyle's Law, for a given amount of gas at constant temperature, the product of pressure (P) and volume (V) is constant. This can be expressed as:
PV=k
where k is a constant.
2. Rearranging the Equation: If we want to plot P against PV, we can express P in terms of PV:
P=kV
Since PV=k, we can denote PV as a constant value.
3. Plotting the Graph: When we plot P on the y-axis and PV on the x-axis, we are essentially plotting:
P (y-axis)againstPV (x-axis)
Given that PV is constant, the relationship indicates that as PV increases, P remains constant.
4. Nature of the Curve: The graph will be a horizontal straight line because P does not change with varying PV at constant temperature. This line will be parallel to the x-axis (PV axis).
5. Name of the Curve: The curve formed by this plot is known as an isotherm. An isotherm represents the behavior of a gas at constant temperature.
Final Answer:
The nature of the curve when plotting P against PV at constant temperature is a horizontal straight line, and this curve is called an isotherm.
PV=k
where k is a constant.
P=kV
Since PV=k, we can denote PV as a constant value.
P (y-axis)againstPV (x-axis)
Given that PV is constant, the relationship indicates that as PV increases, P remains constant.
The nature of the curve when plotting P against PV at constant temperature is a horizontal straight line, and this curve is called an isotherm.
Similar Questions
What is the shape of the curve obtained on plotting P against PV at constant temperature for an ideal gas ?
View Solution(1) What is the shape of the curve obtained on plotting P against V at constant temperature for an ideal eas ?
(2) Which law is signified by the relation, V1T1=V2T2 ?
View SolutionThe slope of the plot between pV and p at constant temperature is
View SolutionWhat is the type of graph between log P and log(1V) at constant temperature for a given amount of gas ?
View SolutionWhich of the following curves obtained at constant temperature and for a given mass of a gas is not a straight line ?
View SolutionIn the process pV2= constant, if temperature of gas is increased, then
View Solution
What would be the direction of these curves?
View SolutionA curve drawn at constant temperature is called an isotherm. This shows the relationship between :
View SolutionThe plot of PV vs P at particular temperature is called isovbar.
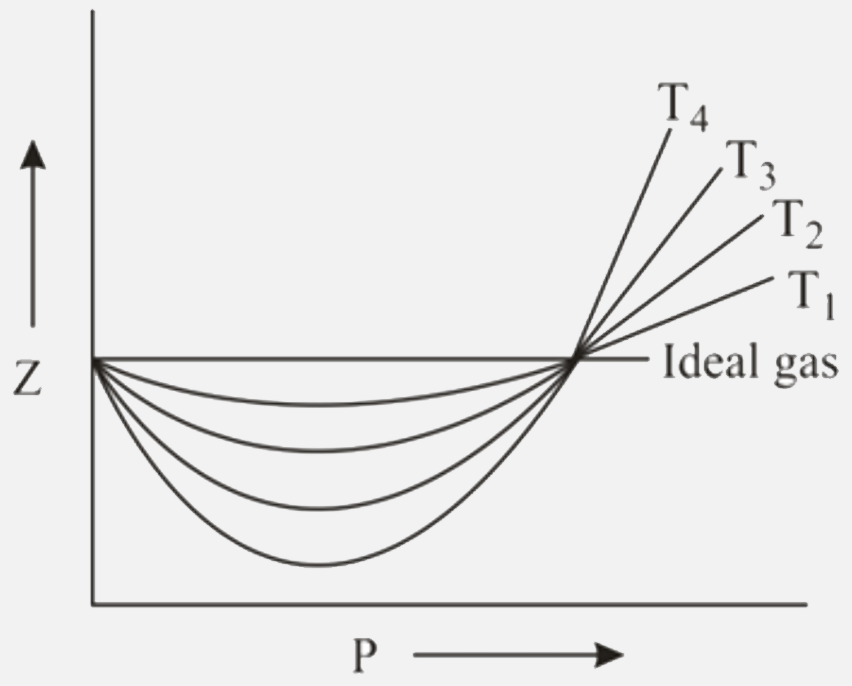
View SolutionCompressibility factor (Z) is plotted against pressure at different temperature for same gas

Which of the following is the correct order of temperature shown in the above plot ?
View Solution
