The figure given below shows three velocity substrate concentration curves for an enzyme reaction . What do the curves A , B and C depict respectively ?
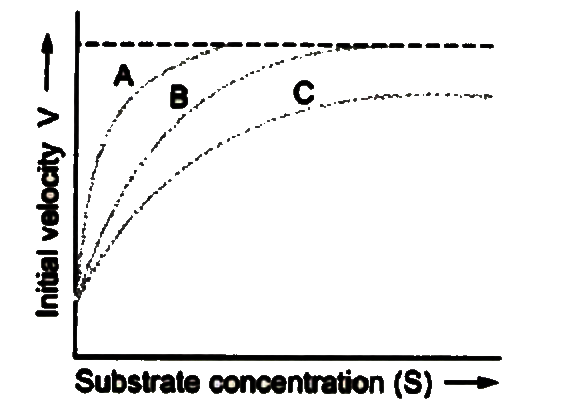
a-normal enzymes action, b-competitive inhibition,c-noncompetitive inhibition
a-enzyme with an allosteric modulator added, b-normal enzyme activity, c-competitive inhibition
a-enzyme with an allosteric stimulator,b-competitive inhibition added, c-normal enzyme reaction
a-normal enzyme reaction, b-non-competitive enhibition added c-allosteric inhibitor add.
The correct Answer is:A
Step by step video & image solution for The figure given below shows three velocity substrate concentration curves for an enzyme reaction . What do the curves A , B and C depict respectively ? by Biology experts to help you in doubts & scoring excellent marks in Class 12 exams.
Updated on:21/07/2023Topper's Solved these Questions
- MOLECULES OF THE CELLBOOK - DINESH PUBLICATION ENGLISHCHAPTER - MOLECULES OF THE CELLEXERCISE - CYG
43 Videos
- MOLECULES OF THE CELLBOOK - DINESH PUBLICATION ENGLISHCHAPTER - MOLECULES OF THE CELLEXERCISE - CYG
43 Videos
- MICROBES IN HUMAN WELFAREBOOK - DINESH PUBLICATION ENGLISHCHAPTER - MICROBES IN HUMAN WELFAREEXERCISE - Brain Teasers-VIII
60 Videos
- MOLLUSCABOOK - DINESH PUBLICATION ENGLISHCHAPTER - MOLLUSCAEXERCISE - CYG
10 Videos
Similar Questions
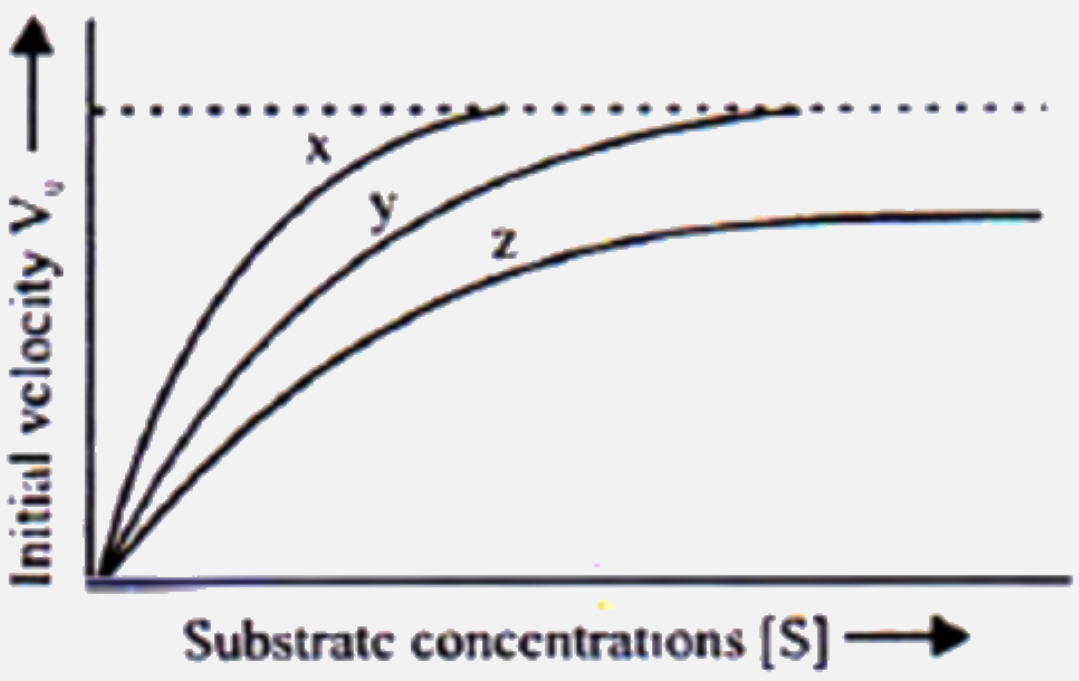
The Given figure shows three velocity-substrate concentration curves of an enzyme reaction. What do the curves X Y and Z depict respectively ?
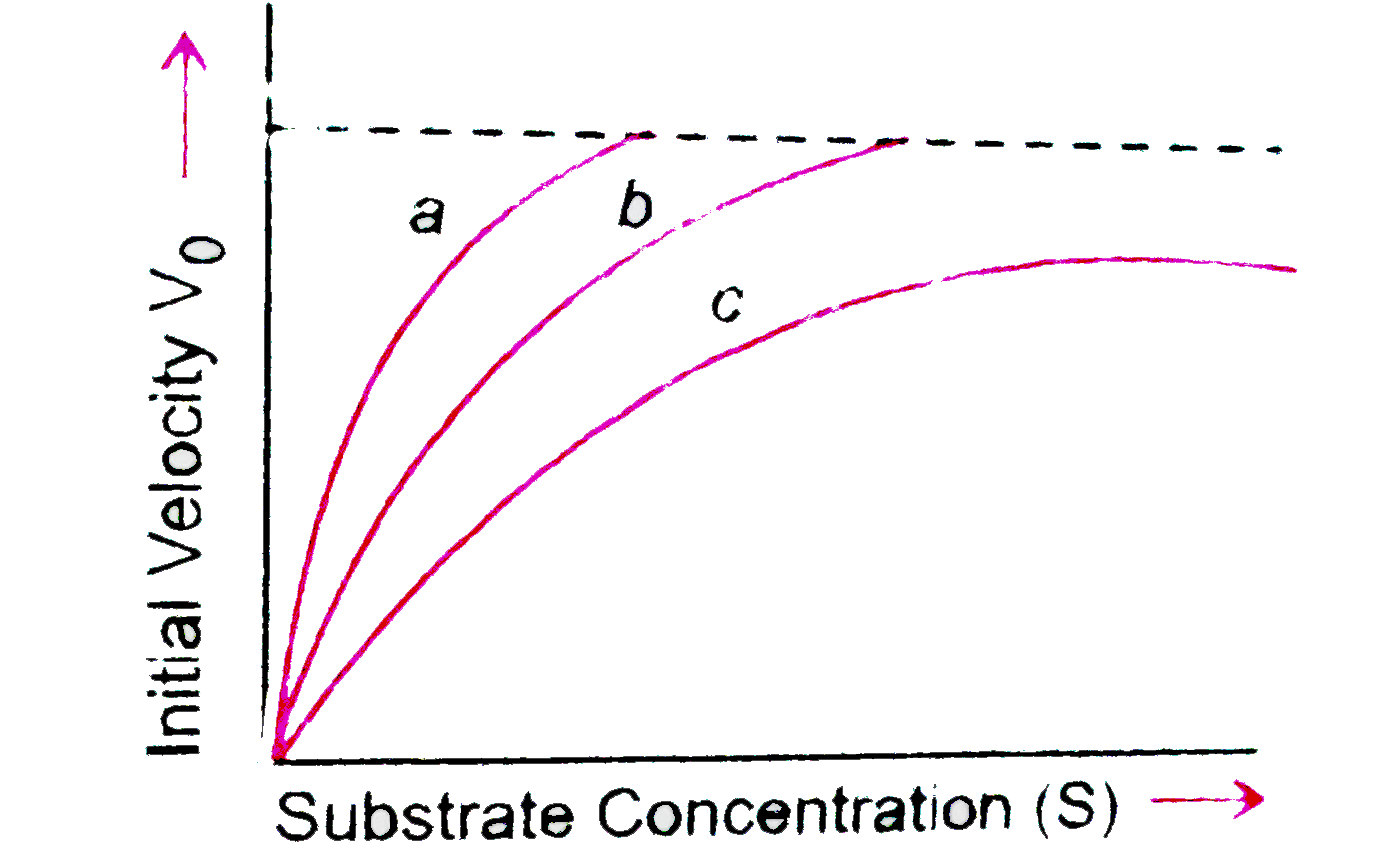
View SolutionFigure given below shows three velocity-substrate concentration curves for an enzyme reaxtion. What do the curves for an enzyme reaction. What do the curves depict
View Solution
Knowledge Check
What is the figure given below showing in particular ?
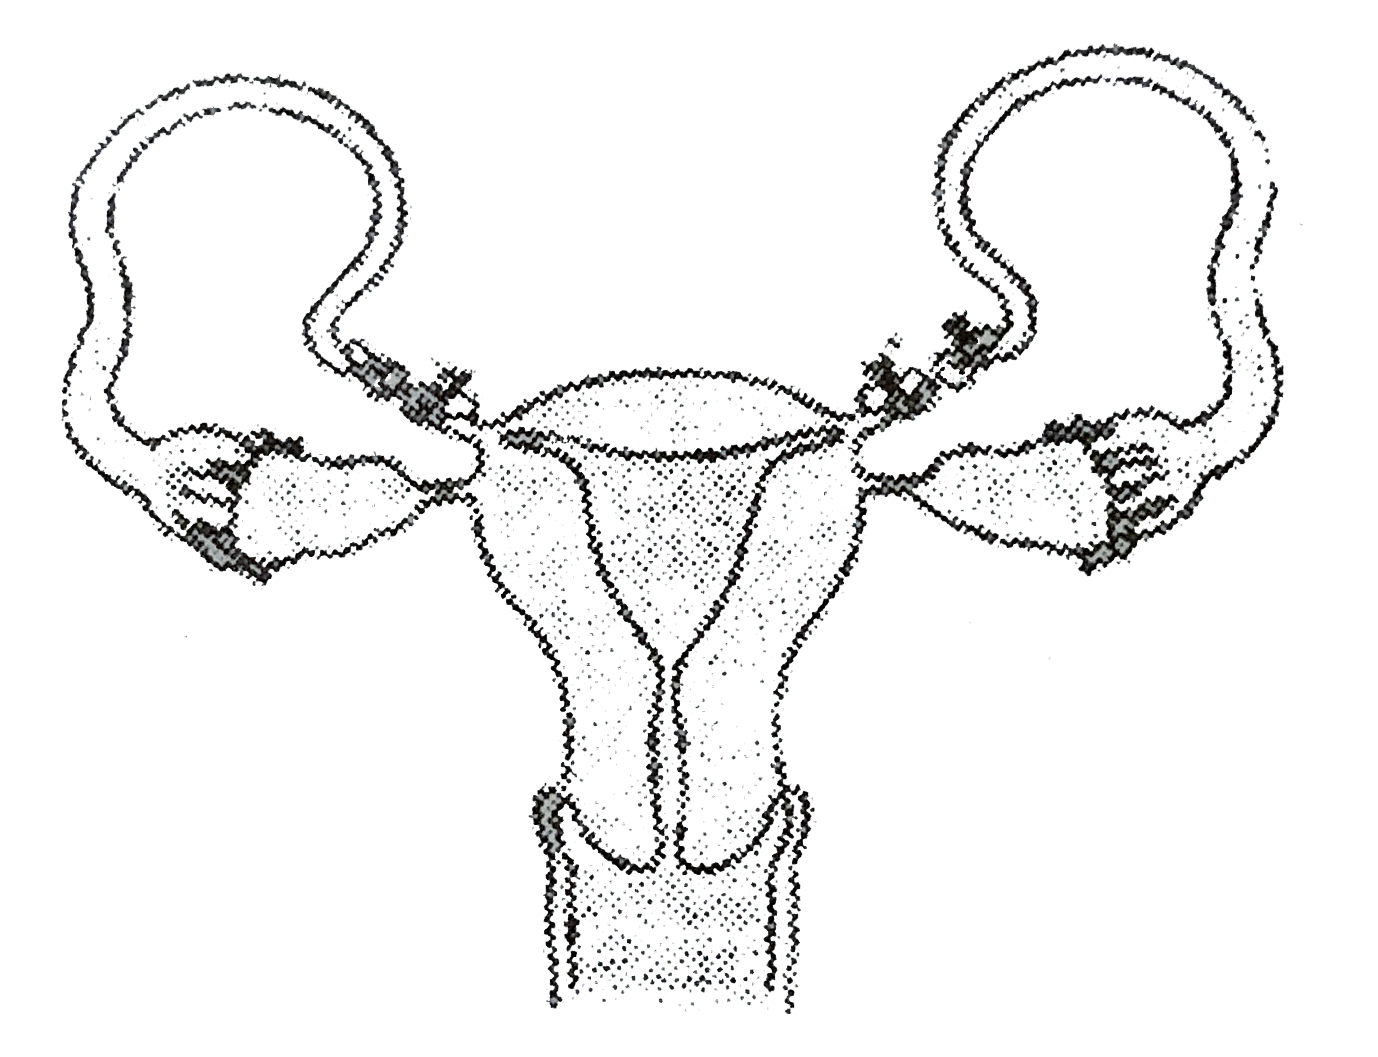 AOvarian cancerBUterine cancerCTubectomyDVasectomy
If you study the effect of substrate concentration on an enzymatic reaction, what kind of curve would you obtain?
View SolutionWhat does the graph indicate ?
The graph given below shows the effect of substrate concentration on the rate of reaction of the enzyme green- gram-phos-phatase.
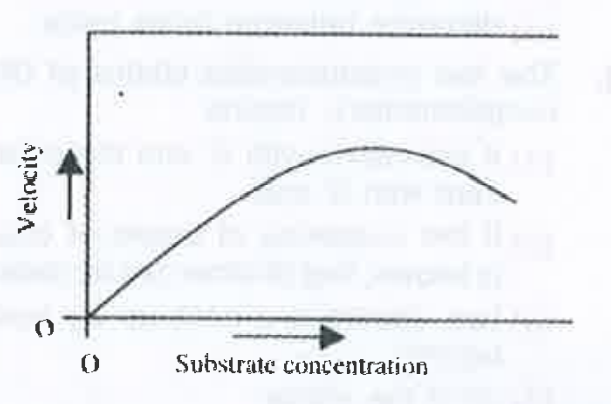
View SolutionThe shape of the curve obtained when substrate concentration is plotted against velocity of reaction
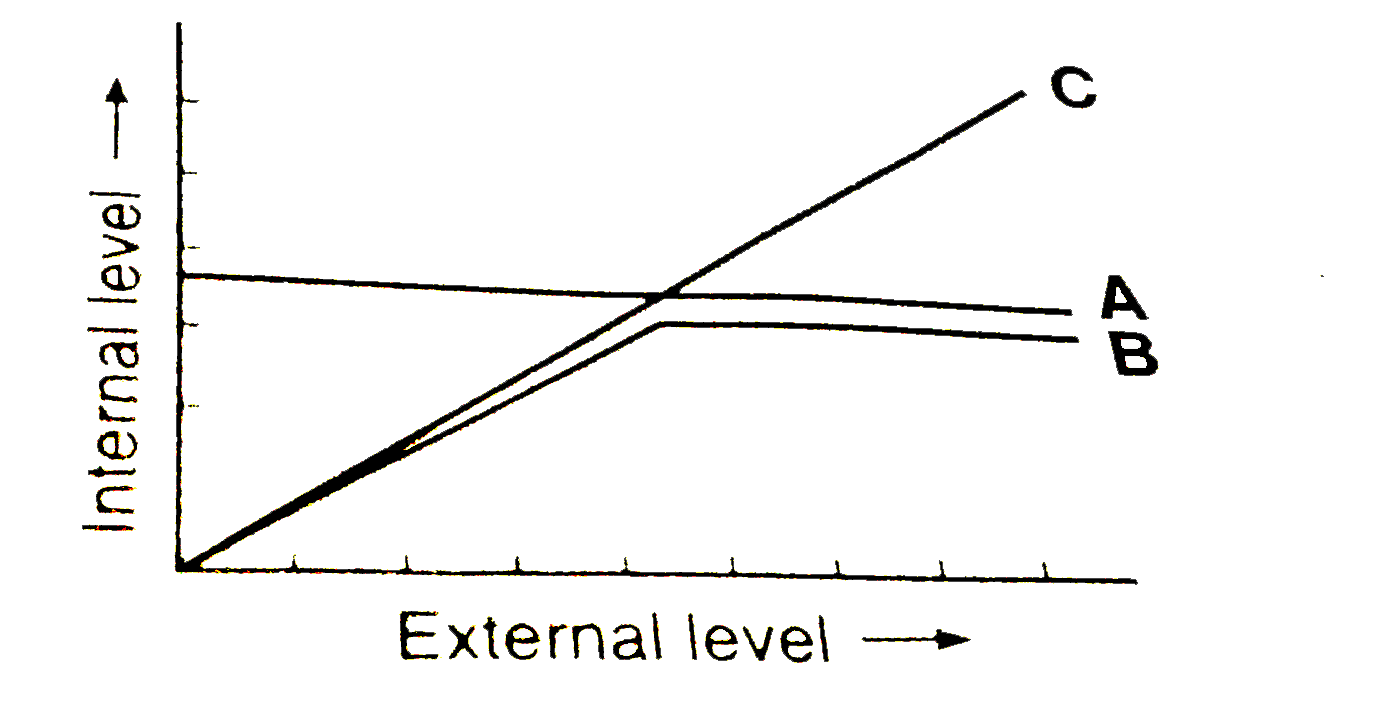
View SolutionThe figure given below is a diagrammatic representation of response of organisms to abiotic factors. What do A, B and C represent respectively?
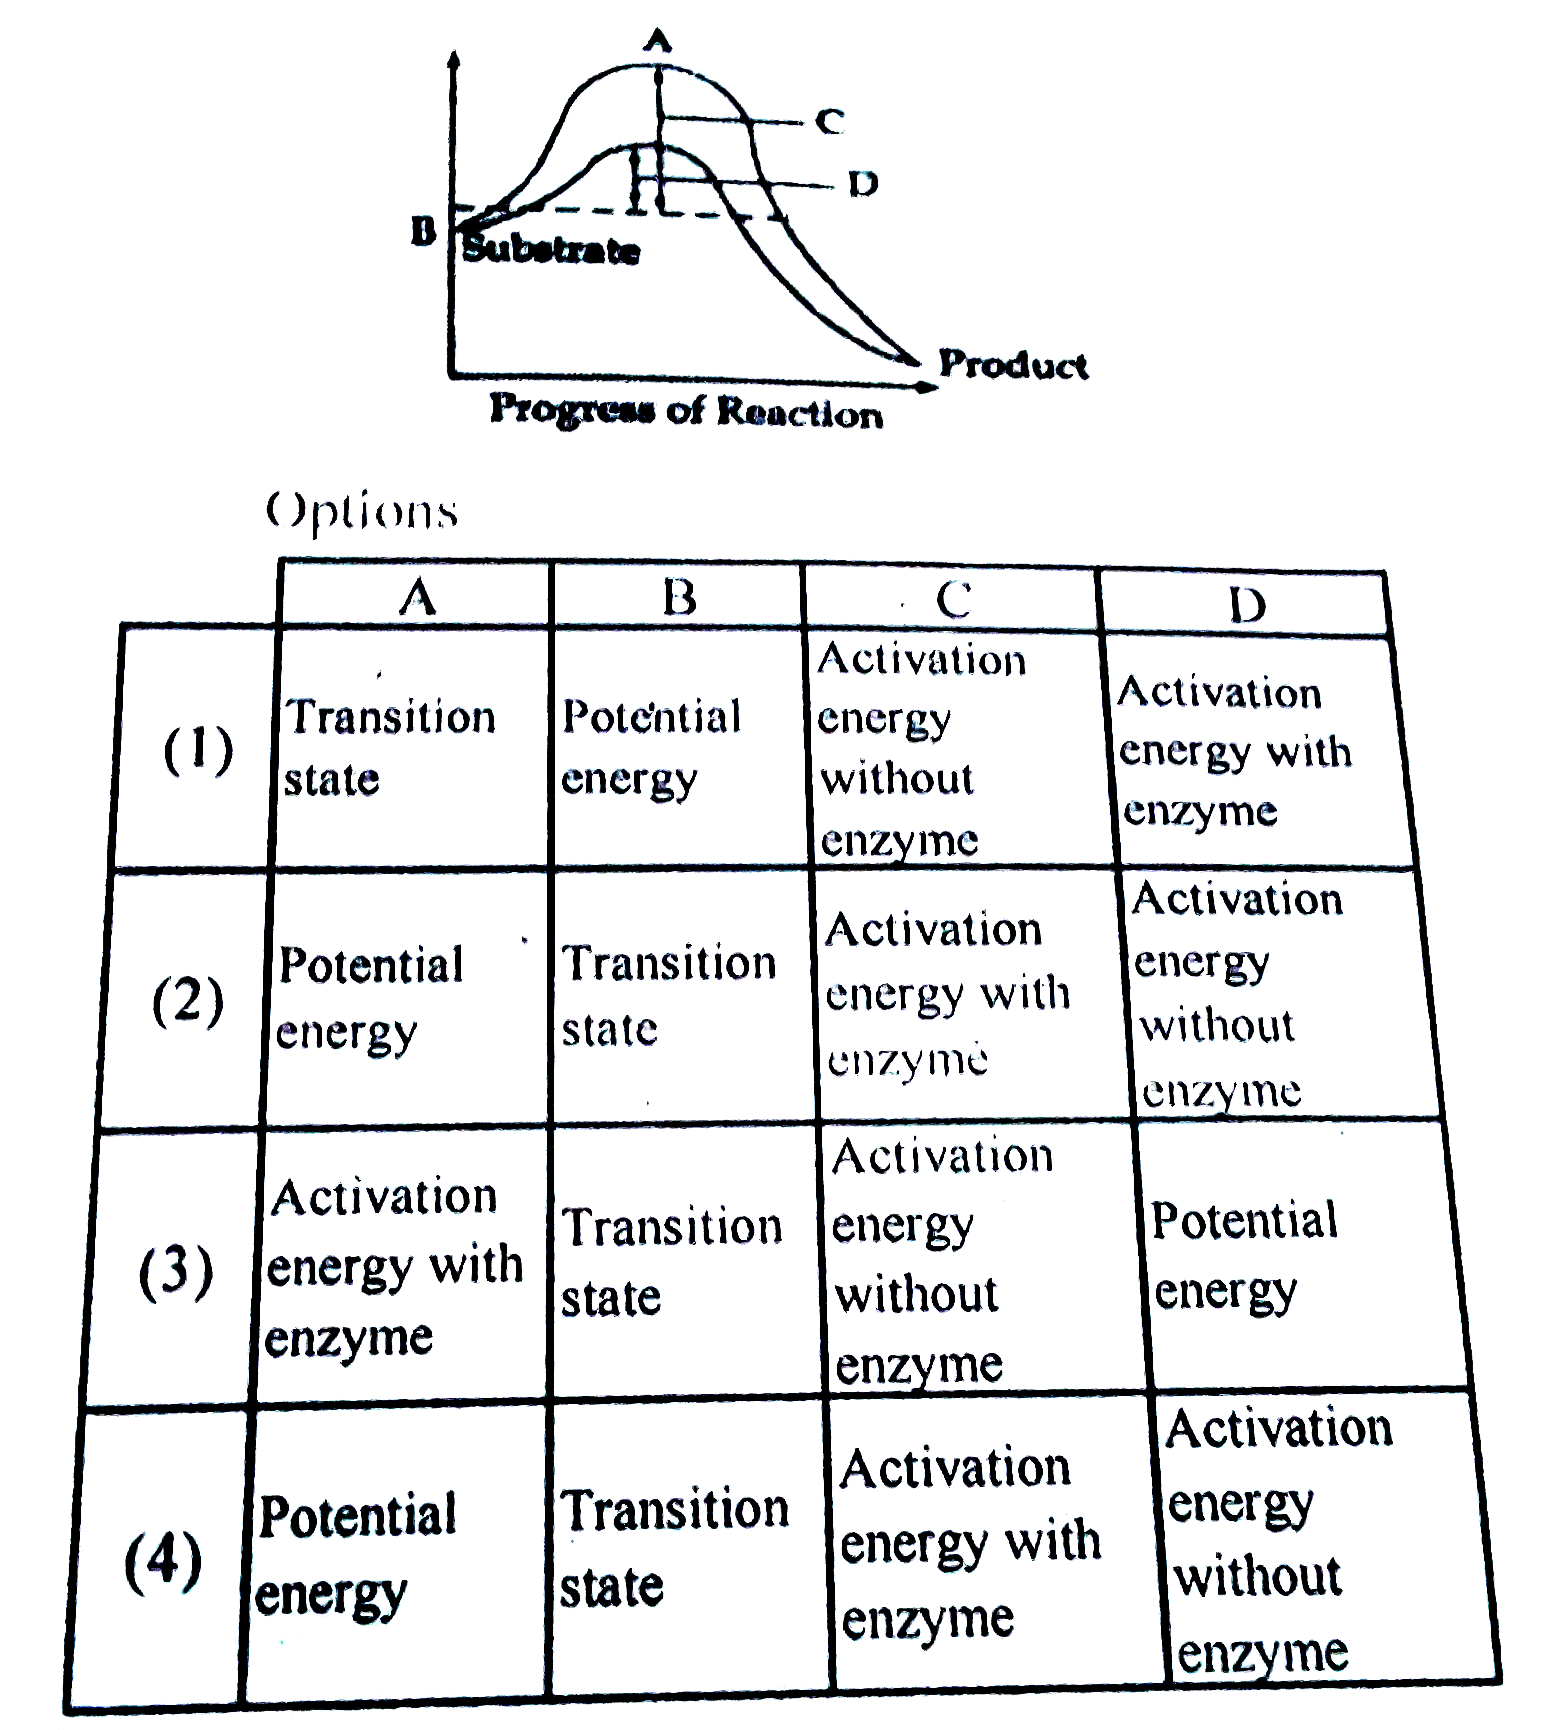
View SolutionThe figure given below shows the conversions of a substrate into product by an enzyme. In which one of the four options (1-4) the components of reaction labelled as A, B, C and D are identified correctly -
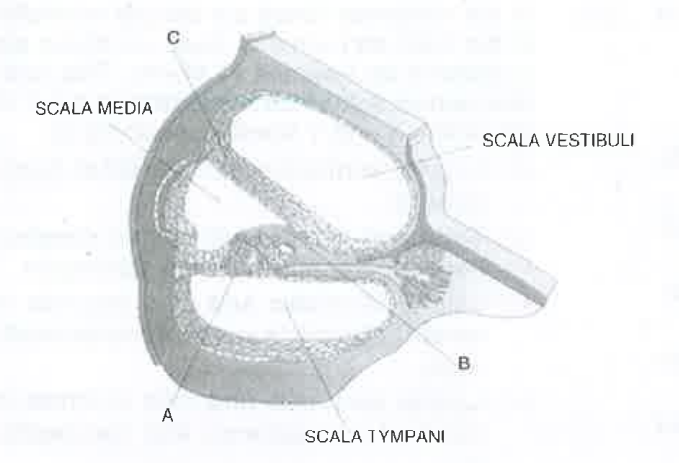
View SolutionIn the figure related to human ear, what do A, B and C stand for respectively
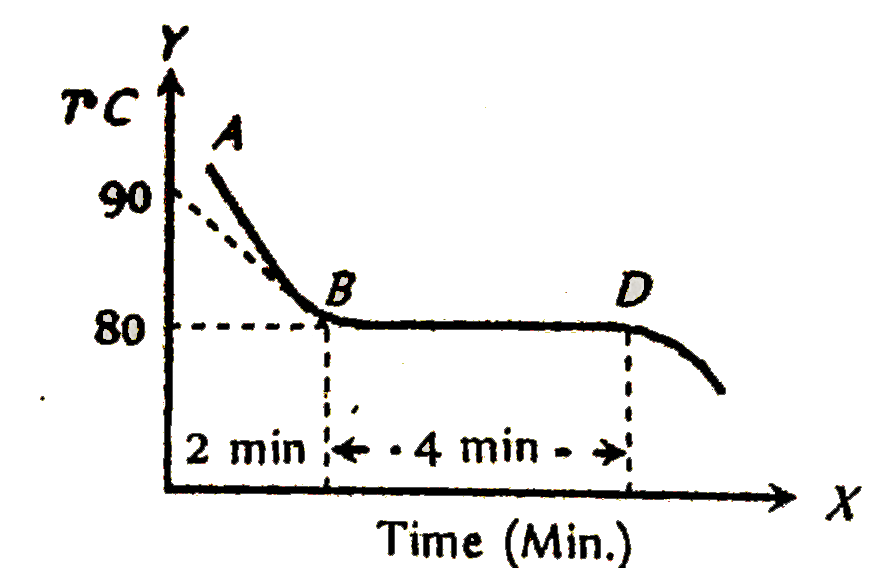
View SolutionThe figure given below shows the cooling curve of pure wax material after heating. It cools from A to B and solidifies along BD . If L and C are respective values of latent heat and the specific heat of the liquid wax, the ratio L / C is
View Solution
