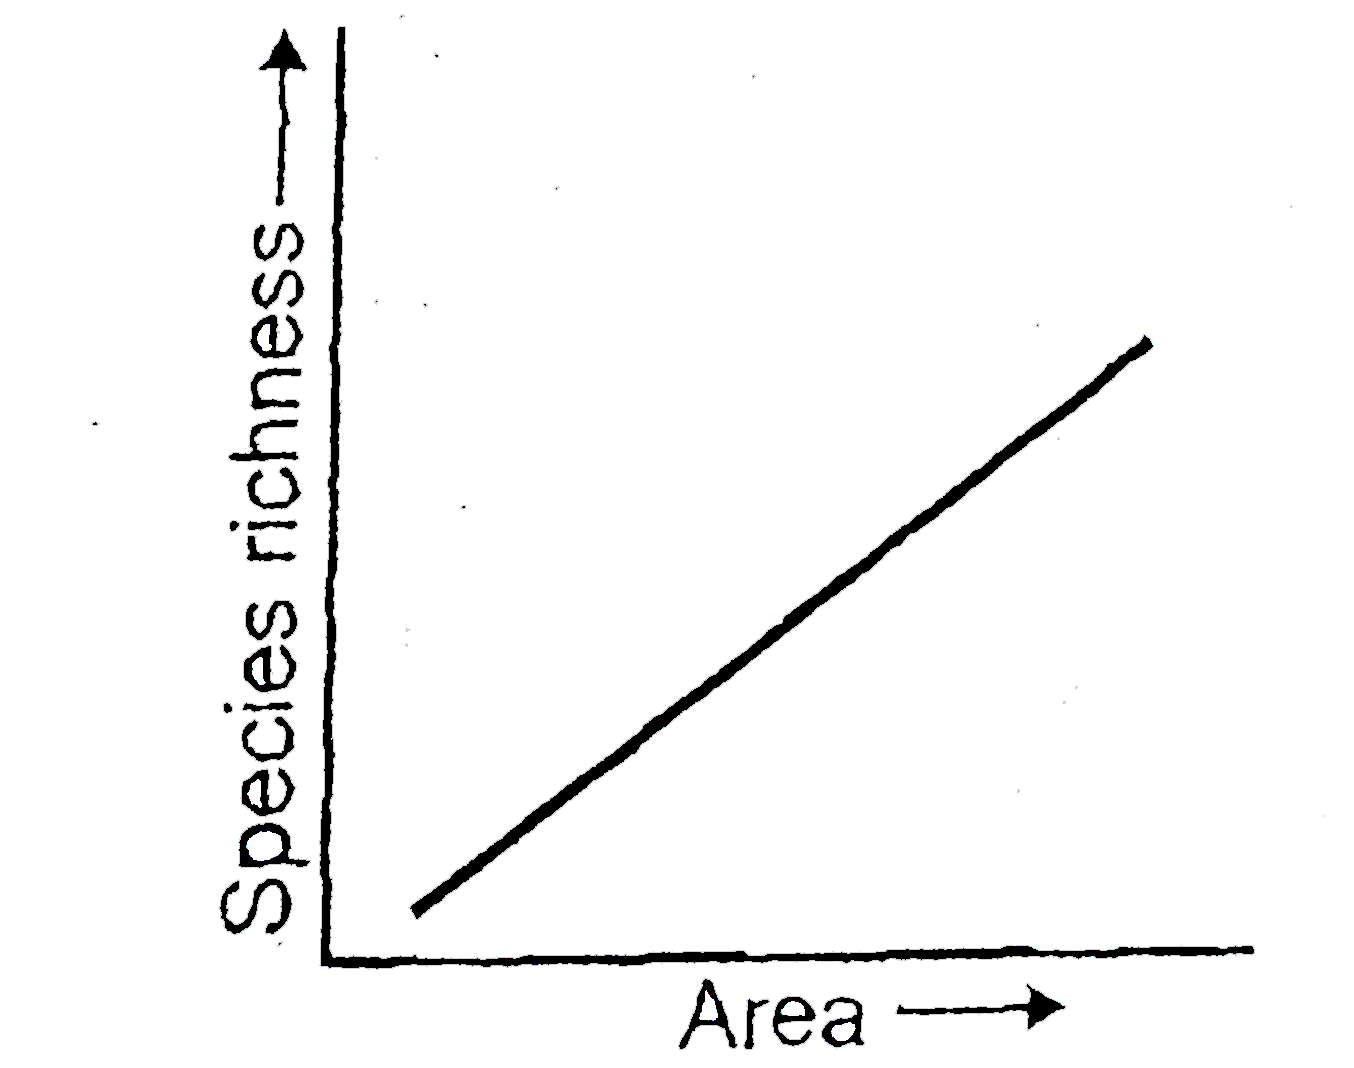
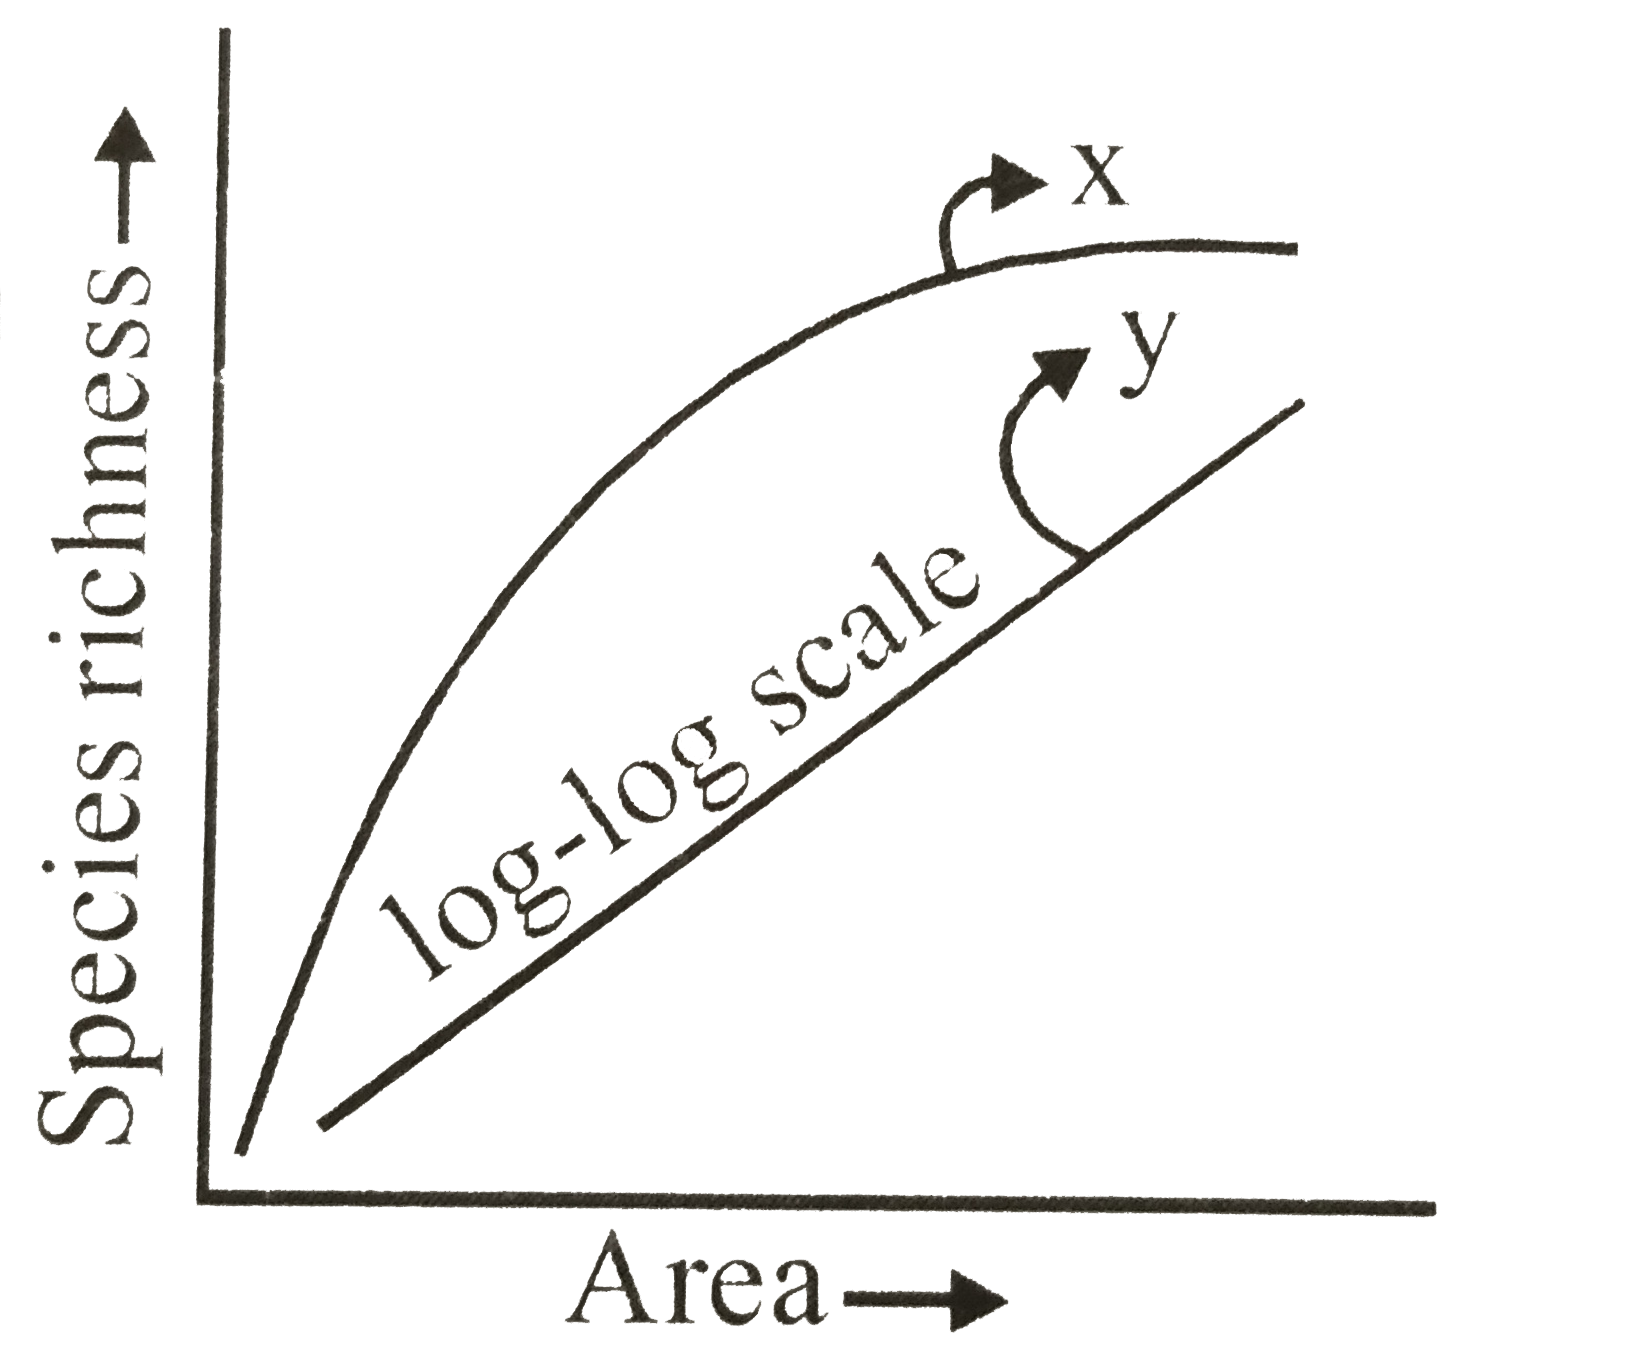
The relation between specises richness and area is described on a logarithmic scale by the equation [where S = species richness, A = area, Z = slope of the line (regression coefficient ), C= Y - intercept]
log S = log C−Z log A
log S = X log A
log S = log C+Z log A
log S = log C
The correct Answer is:C
To solve the question regarding the relationship between species richness (S) and area (A) on a logarithmic scale, we can follow these steps:
1. Understanding the Variables:
- Identify the variables in the equation:
- S = species richness
- A = area
- Z = slope of the line (regression coefficient)
- C = y-intercept
2. Starting with the Equation:
- The relationship is given by the equation:
S=C⋅AZ
3. Taking the Logarithm:
- To express this relationship on a logarithmic scale, we take the logarithm of both sides:
logS=logC+ZlogA
4. Rearranging the Equation:
- This can be rearranged to show the relationship clearly:
logS=logC+ZlogA
- This indicates that the logarithm of species richness (log S) is a linear function of the logarithm of area (log A).
5. Interpreting the Graph:
- The graph of this equation would show species richness (log S) on the y-axis and area (log A) on the x-axis. The slope of the line is Z, and the y-intercept is log C.
6. Conclusion:
- The final equation that describes the relationship between species richness and area on a logarithmic scale is:
logS=logC+ZlogA
- Identify the variables in the equation:
- S = species richness
- A = area
- Z = slope of the line (regression coefficient)
- C = y-intercept
- The relationship is given by the equation:
S=C⋅AZ
- To express this relationship on a logarithmic scale, we take the logarithm of both sides:
logS=logC+ZlogA
- This can be rearranged to show the relationship clearly:
logS=logC+ZlogA
- This indicates that the logarithm of species richness (log S) is a linear function of the logarithm of area (log A).
- The graph of this equation would show species richness (log S) on the y-axis and area (log A) on the x-axis. The slope of the line is Z, and the y-intercept is log C.
- The final equation that describes the relationship between species richness and area on a logarithmic scale is:
logS=logC+ZlogA
Topper's Solved these Questions
Similar Questions
The relation between species richness and area is described on a logarithmic scale by the equation [where S = species richness, A = area, Z = slope of the line (regression coefficient ), C= Y - intercept]
View SolutionRelationship between species richness (S) and area (A) represent in the following graph is described by the equation

View SolutionThe relation between species richness and area for a wide variety of taxa (angiosperm plants, birds, bats, freshwater fishes) is a
View SolutionThe relation between species richness and area for a wide variety of taxa turns out to be a rectangular hyperbola. Give a brief explanation.
View SolutionOn a logarithmic scale, the relation between species richness and area is described by the following equation:
logS=logC+ZLogA
In the above equation 'Z' represents
View SolutionWhich of the statement are in accordance with the observation of geographer Alexander von Humboldt ?
I. Within a region species, richness increases with increasing explored area but within a limit.
II. The relation between species richness and area is a rectangular hyperbola.
III. The richness of species decreases with the increasing explored area.
IV. There is no relation between the explored area and species richness .
View SolutionOn a logarithmic scale the correct representation of species area relationship is represented by the equation
View Solution
Study the above graph and answer the following questions -
(i) Identify x and y
(ii) The relation between species richness and area can be denoted as generally
(iii) The value of z lies in range of
(iv) On a log scale the relation between species richness and area is
View SolutionIndicate whether the following statements are true or false :
(i) New York in temperate area has 56 species of birds.
(ii) Tropical biomes unlike temperate ones, are more seasonal, relatively less constant and predictable.
(iii) Relationship between species richness (S) and area (A) turned out to be rectangular hyperboia on a logarithmic scale.
(iv) Slope of regression (Z) is 1.15 for frugivorous birds and mammals in tropical forests of different continents.
View SolutionAlexander von Humboldt gave the relationship between the species richness and its geographical area . Which of the following is the correct logarithmic equation for his findings ?
View Solution
