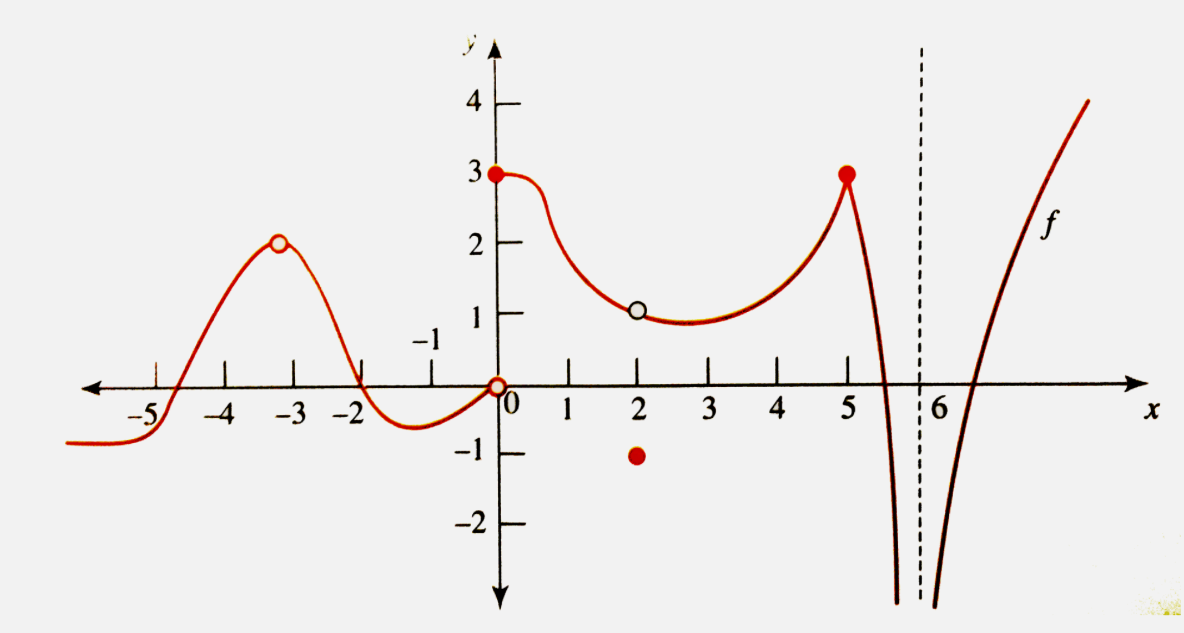
The graph of y=f(x) is as shown in the following figure.

Identify the points of discontinuity and give the reason for the same.Solution in Bengali
y = f(x) is discontinuous at x =- 3 as the value of the function is missing at this point. Assigning proper value to f(-3) [from the graph f(-3) = 2], f(x) can be made continuous at this point.
y = f(x) is discontinuous at x = 0 as there is a jump in the value of the function at this point. Here limx→0−f(x)andlimx→0+f(x)=3. At this point, the function cannot be made continuous.
At x = 2, the function is discontinuous as the value of the value of the function is not same as the limiting value of function.
That is, limx→2f(x)=1 (limit of the function exists), but f(2) =- 1.
At x = 6, the function is discontinuous as the value of the function is decreasing indefinitely when x is approached from either its left or its right.
Topper's Solved these Questions
- BOOK - CENGAGE PUBLICATIONCHAPTER - GETTING STARTED WITH GRAPHSEXERCISE - ILLUSTRATION 1.171videos
GETTING STARTED WITH GRAPHS
- BOOK - CENGAGE PUBLICATIONCHAPTER - GETTING STARTED WITH GRAPHSEXERCISE - ILLUSTRATION 1.181videos
GETTING STARTED WITH GRAPHS
- BOOK - CENGAGE PUBLICATIONCHAPTER - GETTING STARTED WITH GRAPHSEXERCISE - ILLUSTRATION 1.151videos
GETTING STARTED WITH GRAPHS
- BOOK - CENGAGE PUBLICATIONCHAPTER - FUNCTIONSEXERCISE - Comprehension Type7videos
FUNCTIONS
- BOOK - CENGAGE PUBLICATIONCHAPTER - GRAPH OF INVERSE TRIGONOMETRIC FUNCTIONSEXERCISE - Exercises18videos
GRAPH OF INVERSE TRIGONOMETRIC FUNCTIONS
Similar Questions
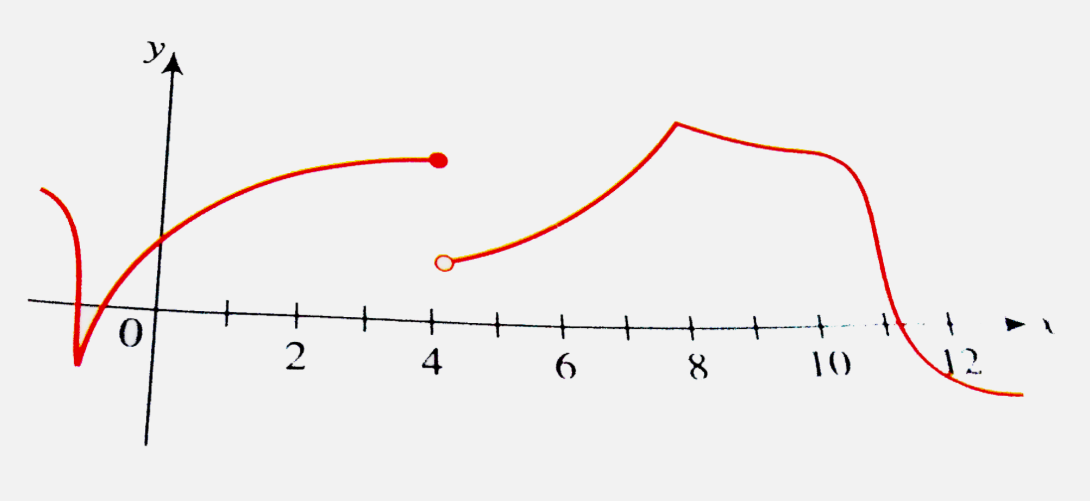
The graph of f(x) is given. State with reasons the number at which the function is non-differentiable.
 View Solution
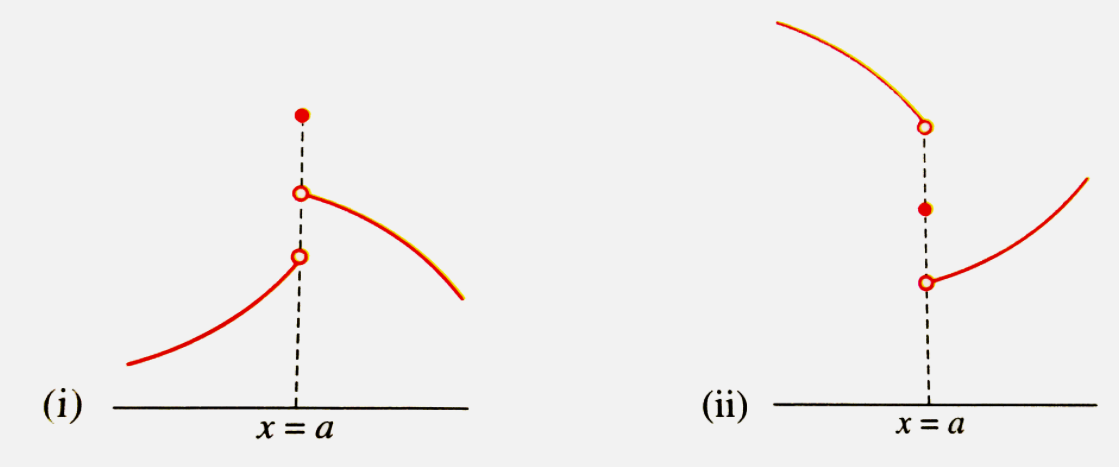
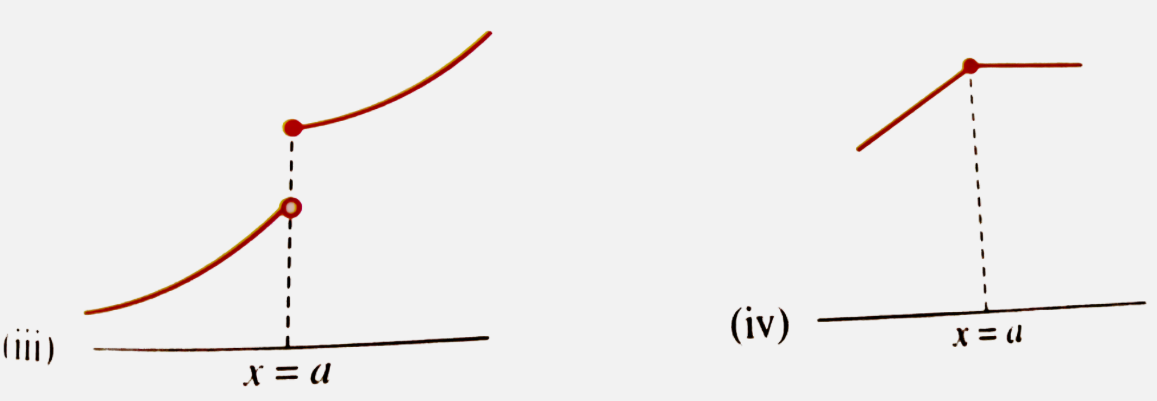
For each of the following graphs, comment whether f(x) is increasing or decreasing or neither increasing nor decreasing at x = a.

 01:37View Solution
The graph of y=f(x) is as shown in the following figure.

Find the following values:
(i) limx→4f(x) (ii)limx→−3f(x)
(iii)limx→0+f(x) (iv)f(x)x→0−
(v)limx→0f(x) (vi)f(−2)
(vii)limx→2−f(x) (viii)limx→−2−f(x)
(ix)limx→0f(x+1) (x)f(0)
(xi)limx→0+f(x−2) (xii)limx→1−f(x−4)02:11View SolutionLet f(x)=x2−2x−1∀x∈R.Letf:(−∞,a]→[b,∞), where a is the largest real number for which f(x) is bijective.
If f:R→R, then range of values of k for which equation f(|x|)=k has 4 distinct real roots is01:31View SolutionDraw the graph of y=tan−1x−cot−1x.
02:45View SolutionThe graph of y=f(x) is as shown in the following figure.
(##CEN_GRA_C01_S01_016_Q01.png" width="80%">
Identify the points of discontinuity and give the reason for the same.02:17View SolutionHow many lines of symmetry does the above figure have ?
05:41View SolutionDetermine the point of symmetry of a regular hexagon.
02:10View SolutionDtermine the images of the following figure about the given line :
02:17View SolutionMatch the following Column A to Column B
 02:10View Solution
Match the following Column A to Column B
 04:23View Solution
Match the following Column A to Column B
 01:59View Solution
The inequation represented by the graph given below is :
01:19View SolutionThe inequation that best describes the graph given below is _________
02:41View SolutionThe inequation that best describes the following graph is _________
01:45View SolutionWhich inequations represent the shaded region in the given figure
02:41View Solution

