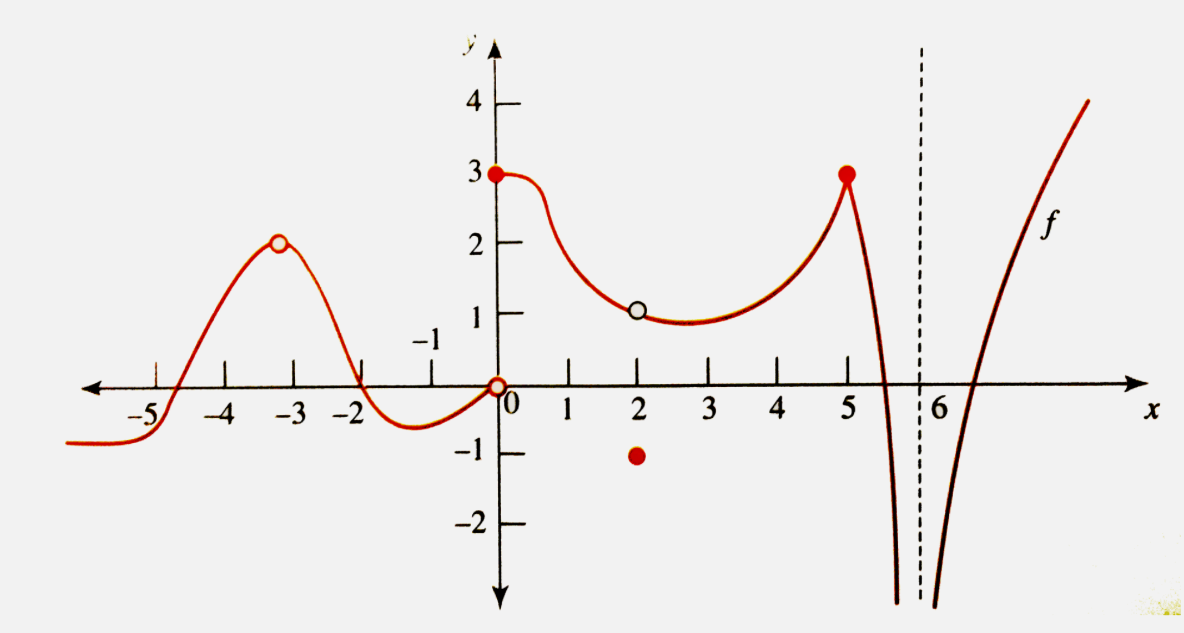
The graph of y=f(x) is as shown in the following figure.
(##CEN_GRA_C01_S01_016_Q01.png" width="80%">
Identify the points of discontinuity and give the reason for the same.
Text Solution
y = f(x) is discontinuous at x =- 3 as the value of the function is missing at this point. Assigning proper value to f(-3) [from the graph f(-3) = 2], f(x) can be made continuous at this point.
y = f(x) is discontinuous at x = 0 as there is a jump in the value of the function at this point. Here limx→0−f(x)andlimx→0+f(x)=3. At this point, the function cannot be made continuous.
At x = 2, the function is discontinuous as the value of the value of the function is not same as the limiting value of function.
That is, limx→2f(x)=1 (limit of the function exists), but f(2) =- 1.
At x = 6, the function is discontinuous as the value of the function is decreasing indefinitely when x is approached from either its left or its right.
|
Topper's Solved these Questions
- GETTING STARTED WITH GRAPHSBOOK - CENGAGECHAPTER - GETTING STARTED WITH GRAPHSEXERCISE - Exercise
18 Videos
- FUNCTIONSBOOK - CENGAGECHAPTER - FUNCTIONSEXERCISE - Question Bank
30 Videos
- GRAPH OF INVERSE TRIGONOMETRIC FUNCTIONSBOOK - CENGAGECHAPTER - GRAPH OF INVERSE TRIGONOMETRIC FUNCTIONSEXERCISE - Exercise
18 Videos
Similar Questions
Knowledge Check
In figure ,PR = ?
(##CEN_JEE_MAT_X_C14_E01_032_Q01.png" width="80%">A20 cmB22 cmC24 cmD26 cmIn the figure shown
(##AHT_PGT_PHY_C10_E01_006_Q01.png" width="80%">AP>P0BP<P0CP=P0DP=0Match the following ( ##AAK_MCP_10_NEET_BOT_E10_027_Q01.png" width="80%">
Aa(iv), b(v), c(ii), d(i), e(iii)Ba(v), b(iv), c(iii), d(ii), e(i)Ca(iv), b(v), c(i), d(ii), e(iii)Da(iv), b(v), c(ii), d(iii), e(i)
The graph of y=f(x) is as shown in the following figure.

Identify the points of discontinuity and give the reason for the same.
View Solutionobserve the following lists :
(##VMC_MAT_WOR_BOK_05_C16_E02_022_Q01.png" width="80%">
View SolutionThe perimeter of the triangle shown in figure. is
(##NCERT_EXM_MAT_VI_C07_E01_015_Q01.png" width="80%">
View SolutionDoes the graph below represent a function or a relation?
(##CEN_GRA_C01_S01_002_Q01.png" width="80%">
View SolutionFollowing is the graph of y = f(x).
(##CENGRAC01S01005_Q01.png width=80%><br>F∈dthes√oftheequation f(x) = 0, f(x) = 4 and f(x) = 10.
View Solution
