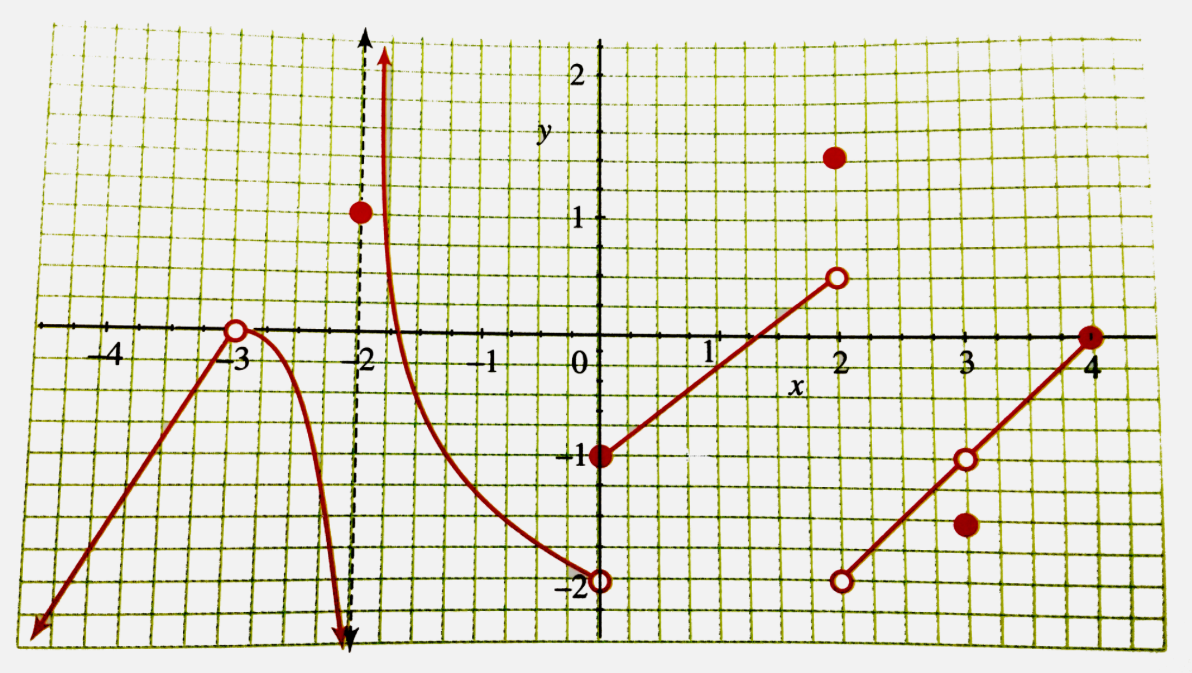
The graph of y = f(x) is as shown in the following figure.

Find the following values
(i)f(−3) (ii)f(−2) (iii)f(0)
(iv)f(2) (v)f(3) (vi)limx→−3f(x)
(vii)limx→0f(x) (viii)limx→2f(x) (ix)limx→3f(x)
(x)limx→2−f(x) (xi)limx→−2+f(x) (xii)limx→0−f(x)
(x iii) limx→0+f(x) Solution in Bengali
(i) f(-3) does not exist (ii)f(−2)=1
(iii)f(0)=−1 (iv)f(2)=1.5
(v) f(3)=−1.5 (vi)limx→−3f(x)=0=0
(vii)limx→0f(x)does not exist as limx→−0−f(x)=−2andlimx→−0+f(x)=−1
(viii) limx→2f(x) does not exist as limx→2−f(x)=0.5andlimx→2+f(x)=−2
(i x) limx→3f(x)=−1 (x)limx→−2−f(x)=−∞
(x i)limx→−2+f(x)=∞ (xii) limx→−0−f(x)=−2
(x iii)limx→−0+f(x)=−1
Topper's Solved these Questions
- GETTING STARTED WITH GRAPHSBOOK - CENGAGE PUBLICATIONCHAPTER - GETTING STARTED WITH GRAPHSEXERCISE - Exercises 1.8
1 Videos
- GETTING STARTED WITH GRAPHSBOOK - CENGAGE PUBLICATIONCHAPTER - GETTING STARTED WITH GRAPHSEXERCISE - Exercises 1.9
1 Videos
- GETTING STARTED WITH GRAPHSBOOK - CENGAGE PUBLICATIONCHAPTER - GETTING STARTED WITH GRAPHSEXERCISE - Exercises 1.6
1 Videos
- FUNCTIONSBOOK - CENGAGE PUBLICATIONCHAPTER - FUNCTIONSEXERCISE - Comprehension Type
7 Videos
- GRAPH OF INVERSE TRIGONOMETRIC FUNCTIONSBOOK - CENGAGE PUBLICATIONCHAPTER - GRAPH OF INVERSE TRIGONOMETRIC FUNCTIONSEXERCISE - Exercises
18 Videos
Similar Questions
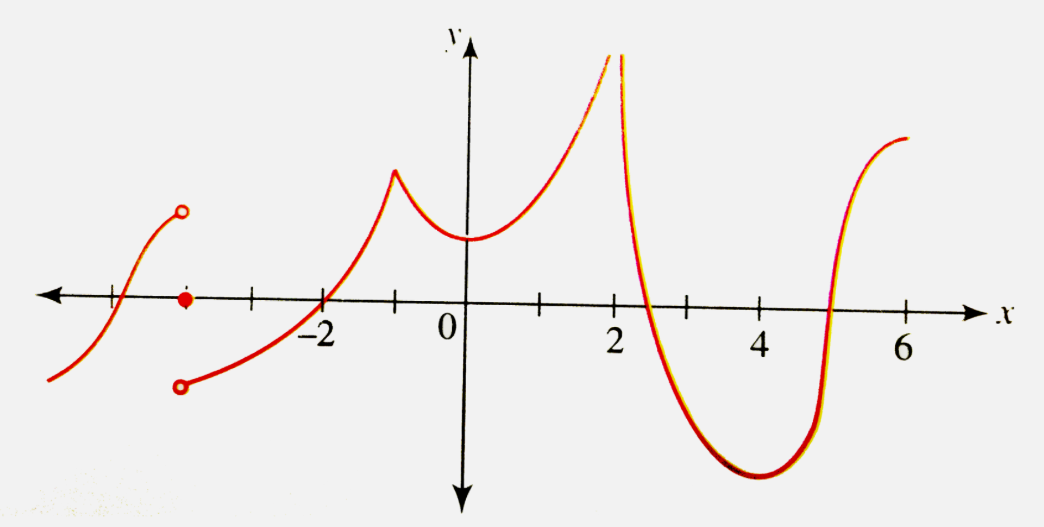
The graph of f is shown. State, with reason, the numbers at which f is not differentiable.

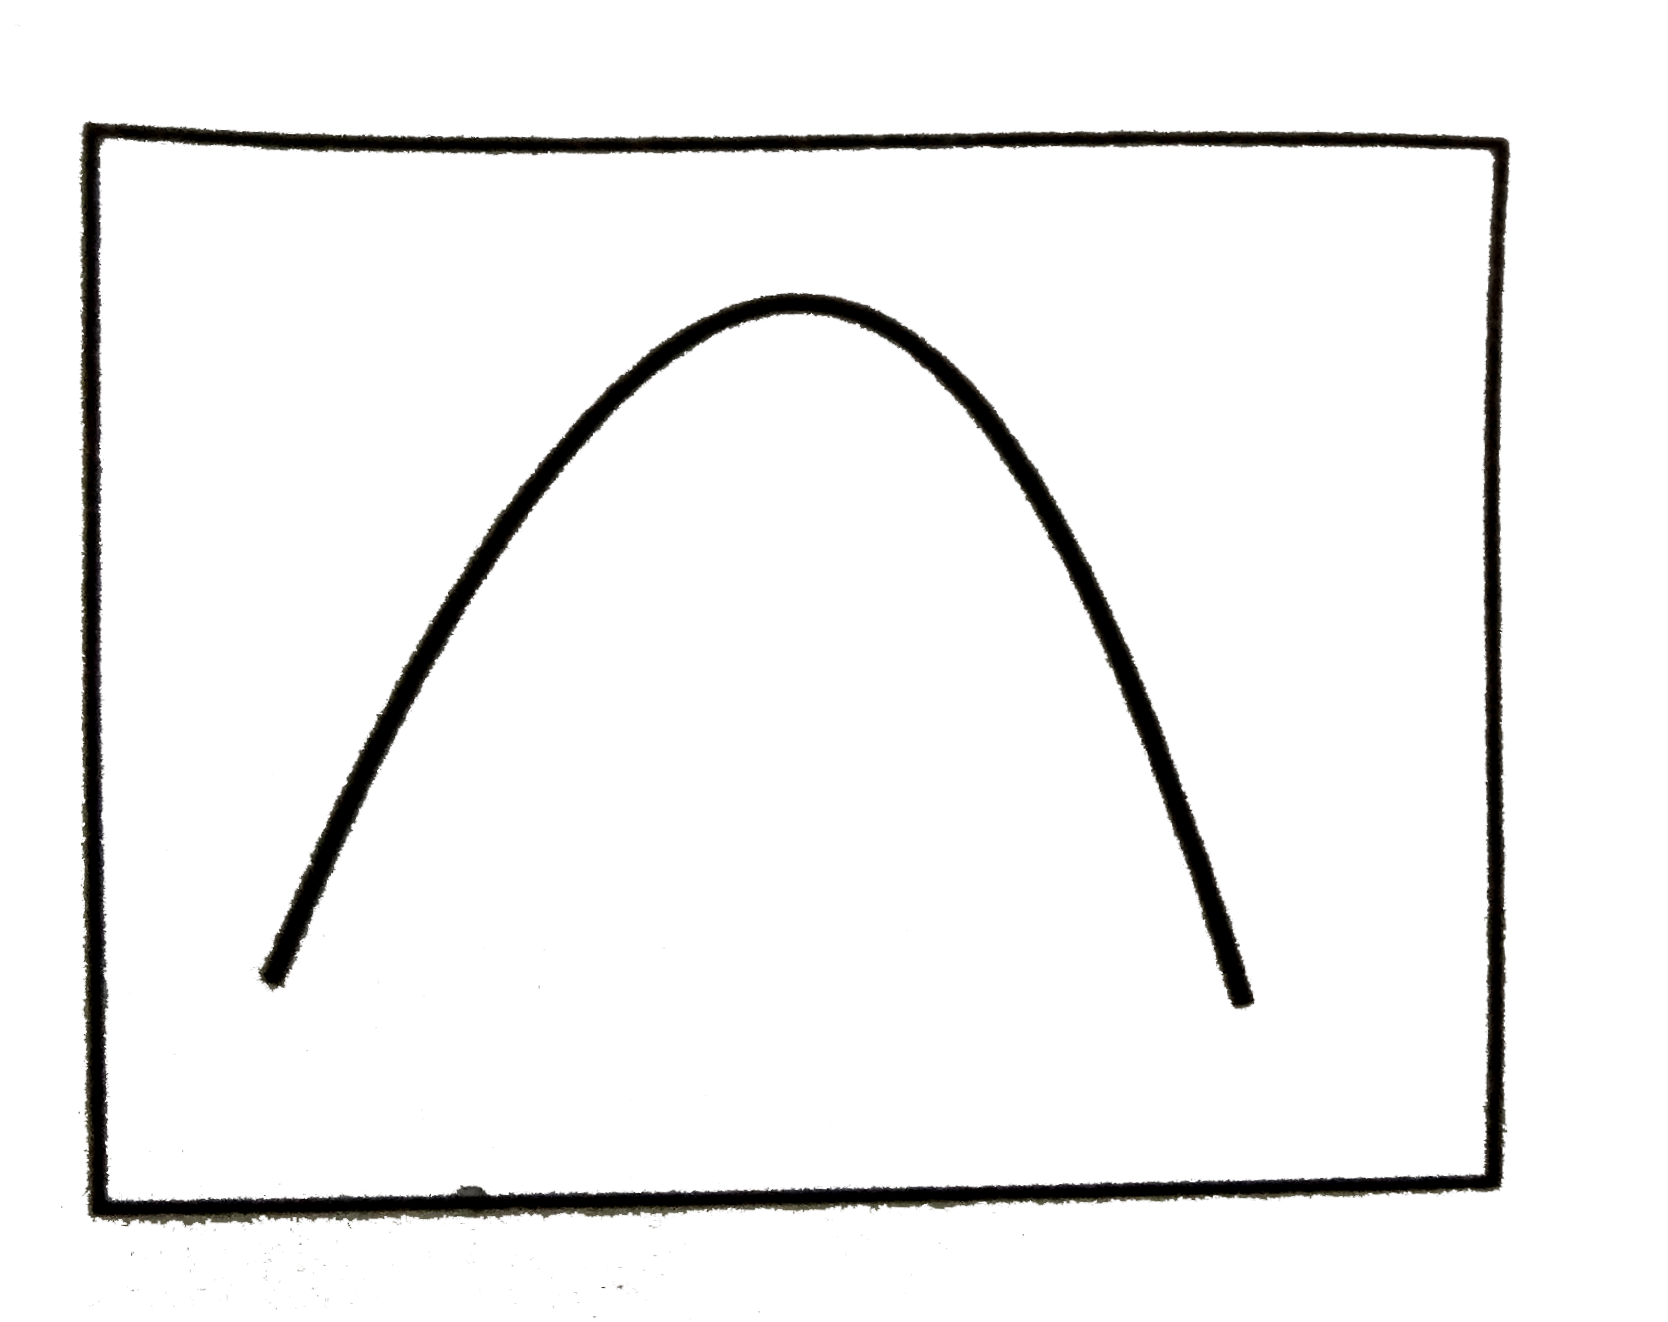
View SolutionSelect the right option regarding the given graph.

View SolutionSuppose that f is even, periodic function with period 2, and that f(x) = x for all x in the interval [0, 1]. Then draw the graph of y = f(x).
View SolutionLet f(x)=x2−2x−1∀x∈R.Letf:(−∞,a]→[b,∞), where a is the largest real number for which f(x) is bijective.
If f:R→R, then range of values of k for which equation f(|x|)=k has 4 distinct real roots is
View SolutionDraw the graph of y=tan−1x−cot−1x.
View SolutionThe graph of y = f(x) is shown, find the number of solution of f(f(x)) = 2.
(##CEN_GRA_C01_S01_007_Q01.png" width="80%">
View SolutionThe graph of y = f(x) is as shown in the following figure.

Find the following values
(i)f(−3) (ii)f(−2) (iii)f(0)
(iv)f(2) (v)f(3) (vi)limx→−3f(x)
(vii)limx→0f(x) (viii)limx→2f(x) (ix)limx→3f(x)
(x)limx→2−f(x) (ξ)limx→−2+f(x) (xii)limx→0−f(x)
(x iii) limx→0+f(x)
View SolutionDetermine the point of symmetry of a regular hexagon.
View SolutionMatch the following Column A to Column B

View SolutionMatch the following Column A to Column B

View SolutionMatch the following Column A to Column B

View SolutionThe inequation represented by the graph given below is :
View SolutionThe inequation that best describes the graph given below is _________
View SolutionThe inequation that best describes the following graph is _________
View SolutionMatch the followings (column I with column II)
ltimg src="https://d10lpgp6xz60nq.cloudfront.net/physics_images/NCERT_BIO_XI_C03_E01_011_Q01.png" width="80%"gt
View SolutionWhich one of the following pairs would have a larger size ? Explain (i) K " or " K^(+) (ii) Br " or " Br^(-) (iii) O^(2-) " or " F^(-) (iv) Li^(+) " or " Na^(+) (v) P " or "As (vi) Na^(+) " or " Mg^(2+)
View Solution
