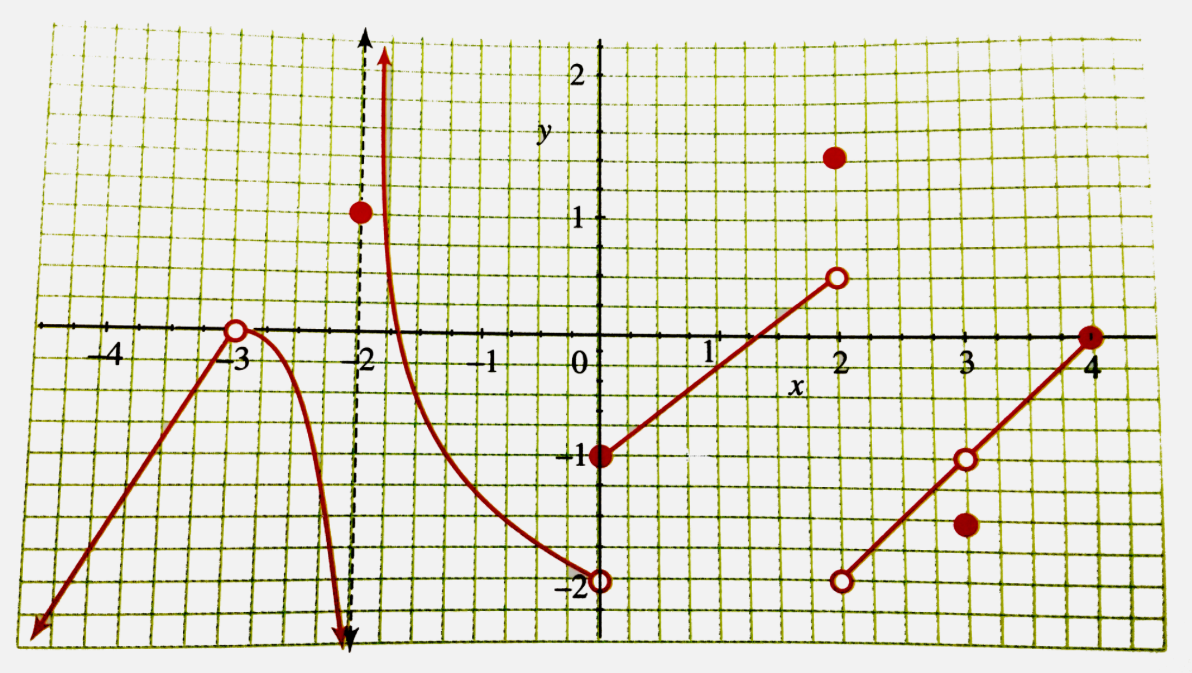
The graph of y = f(x) is as shown in the following figure.

Find the following values
(i)f(−3) (ii)f(−2) (iii)f(0)
(iv)f(2) (v)f(3) (vi)limx→−3f(x)
(vii)limx→0f(x) (viii)limx→2f(x) (ix)limx→3f(x)
(x)limx→2−f(x) (ξ)limx→−2+f(x) (xii)limx→0−f(x)
(x iii) limx→0+f(x)
(i) f(-3) does not exist (ii)f(−2)=1
(iii)f(0)=−1 (iv)f(2)=1.5
(v) f(3)=−1.5 (vi)limx→−3f(x)=0=0
(vii)limx→0f(x)does not exist as limx→−0−f(x)=−2andlimx→−0+f(x)=−1
(viii) limx→2f(x) does not exist as limx→2−f(x)=0.5andlimx→2+f(x)=−2
(i x) limx→3f(x)=−1 (x)limx→−2−f(x)=−∞
(x i)limx→−2+f(x)=∞ (xii) limx→−0−f(x)=−2
(x iii)limx→−0+f(x)=−1
Topper's Solved these Questions
- GETTING STARTED WITH GRAPHSBOOK - CENGAGECHAPTER - GETTING STARTED WITH GRAPHSEXERCISE - Exercise
18 Videos
- FUNCTIONSBOOK - CENGAGECHAPTER - FUNCTIONSEXERCISE - Question Bank
30 Videos
- GRAPH OF INVERSE TRIGONOMETRIC FUNCTIONSBOOK - CENGAGECHAPTER - GRAPH OF INVERSE TRIGONOMETRIC FUNCTIONSEXERCISE - Exercise
18 Videos
Similar Questions
Knowledge Check
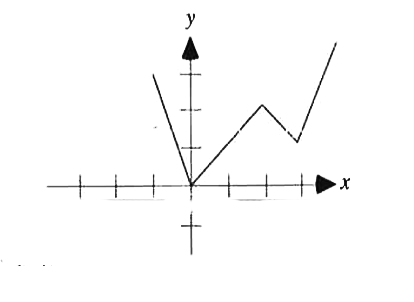
The graph of y=f(x) is shown to the right. If f(−1)=v, then which one of the following could be the value of f(v) ?
 A0B1C2D2.5
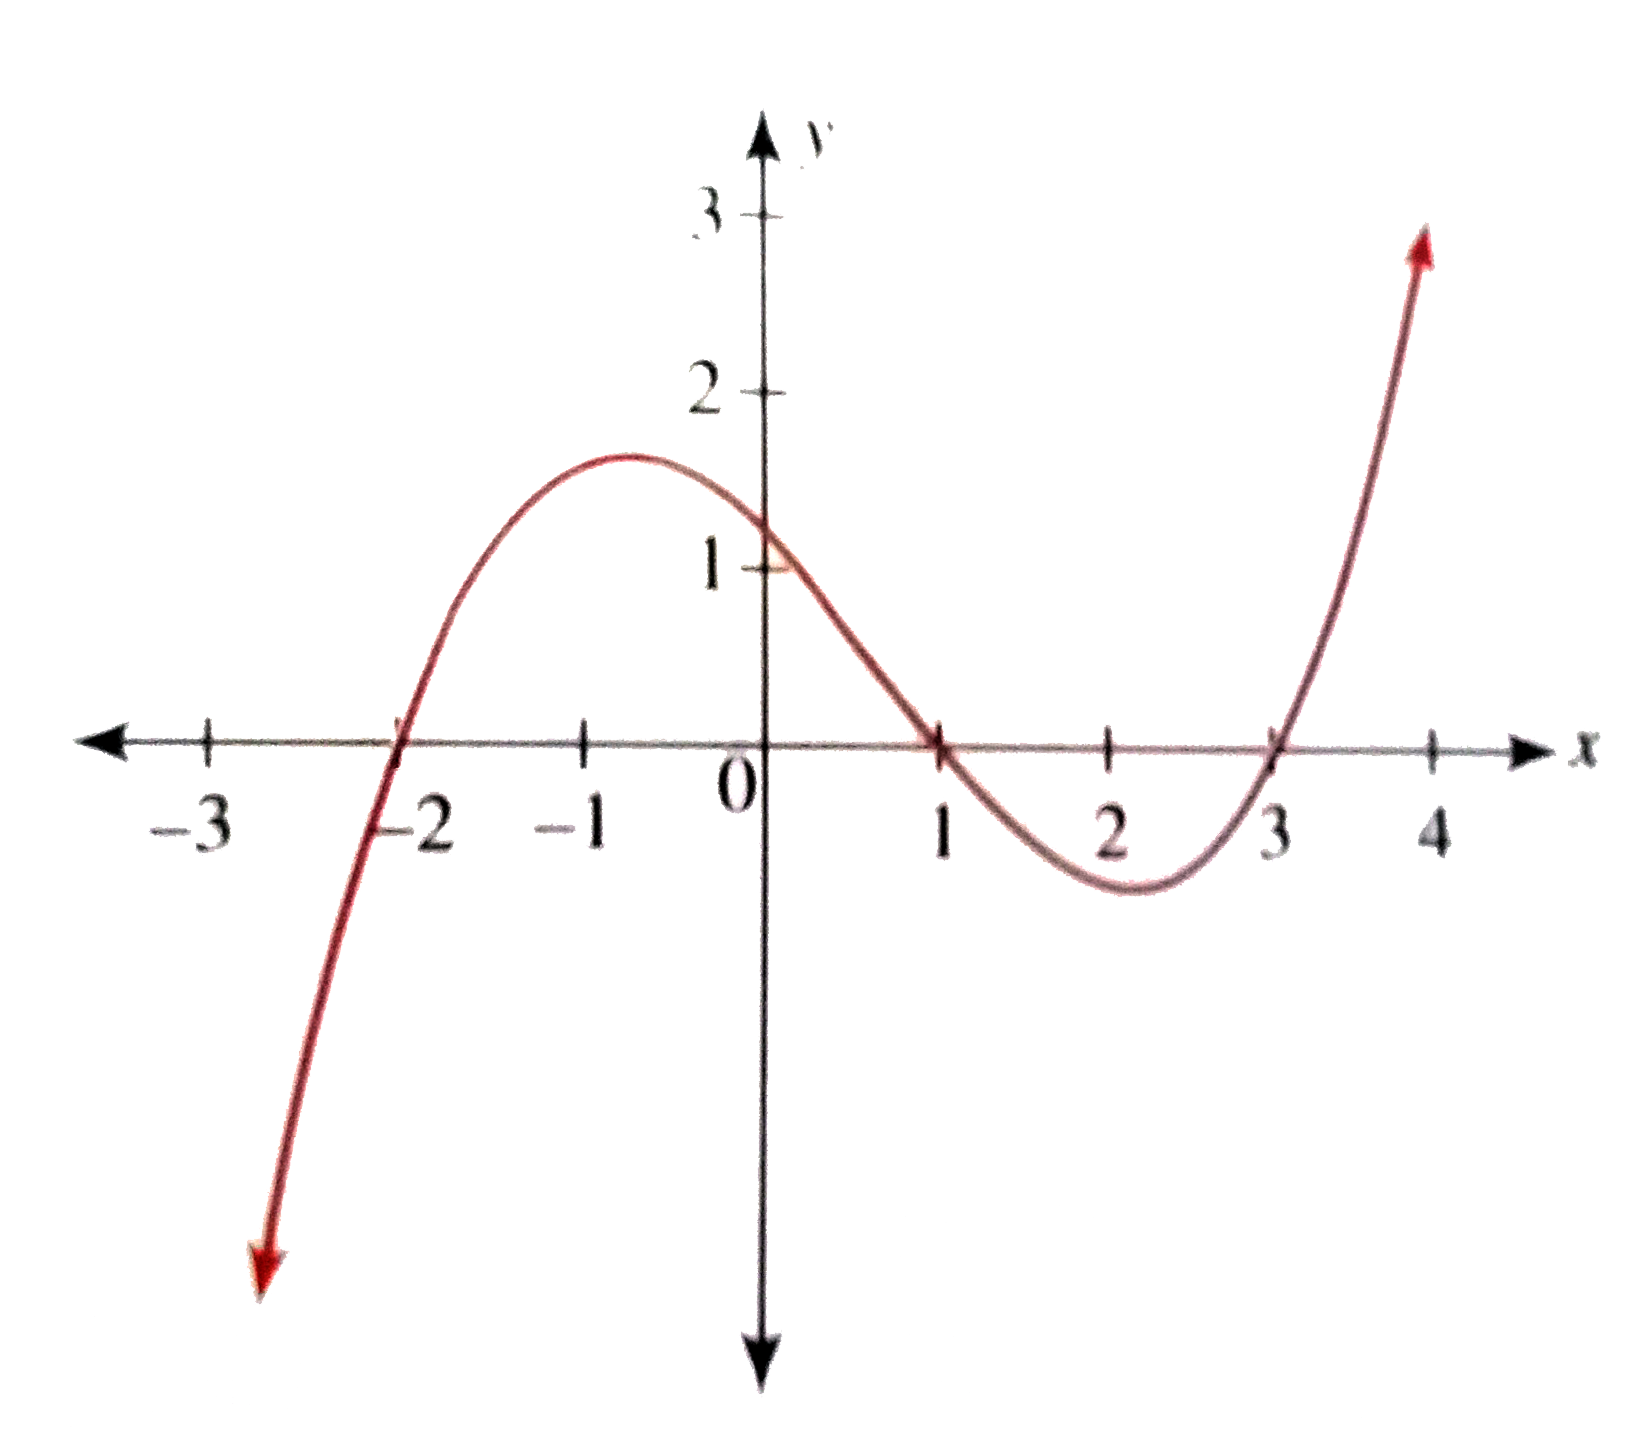
The graph of the function y=f(x) is as shown in the figure.

Then draw the graphs of
(i) |y|=sgn(f(x)) (ii) |y|=|f(x∣)|
(iii) y=xsgn(f(x))
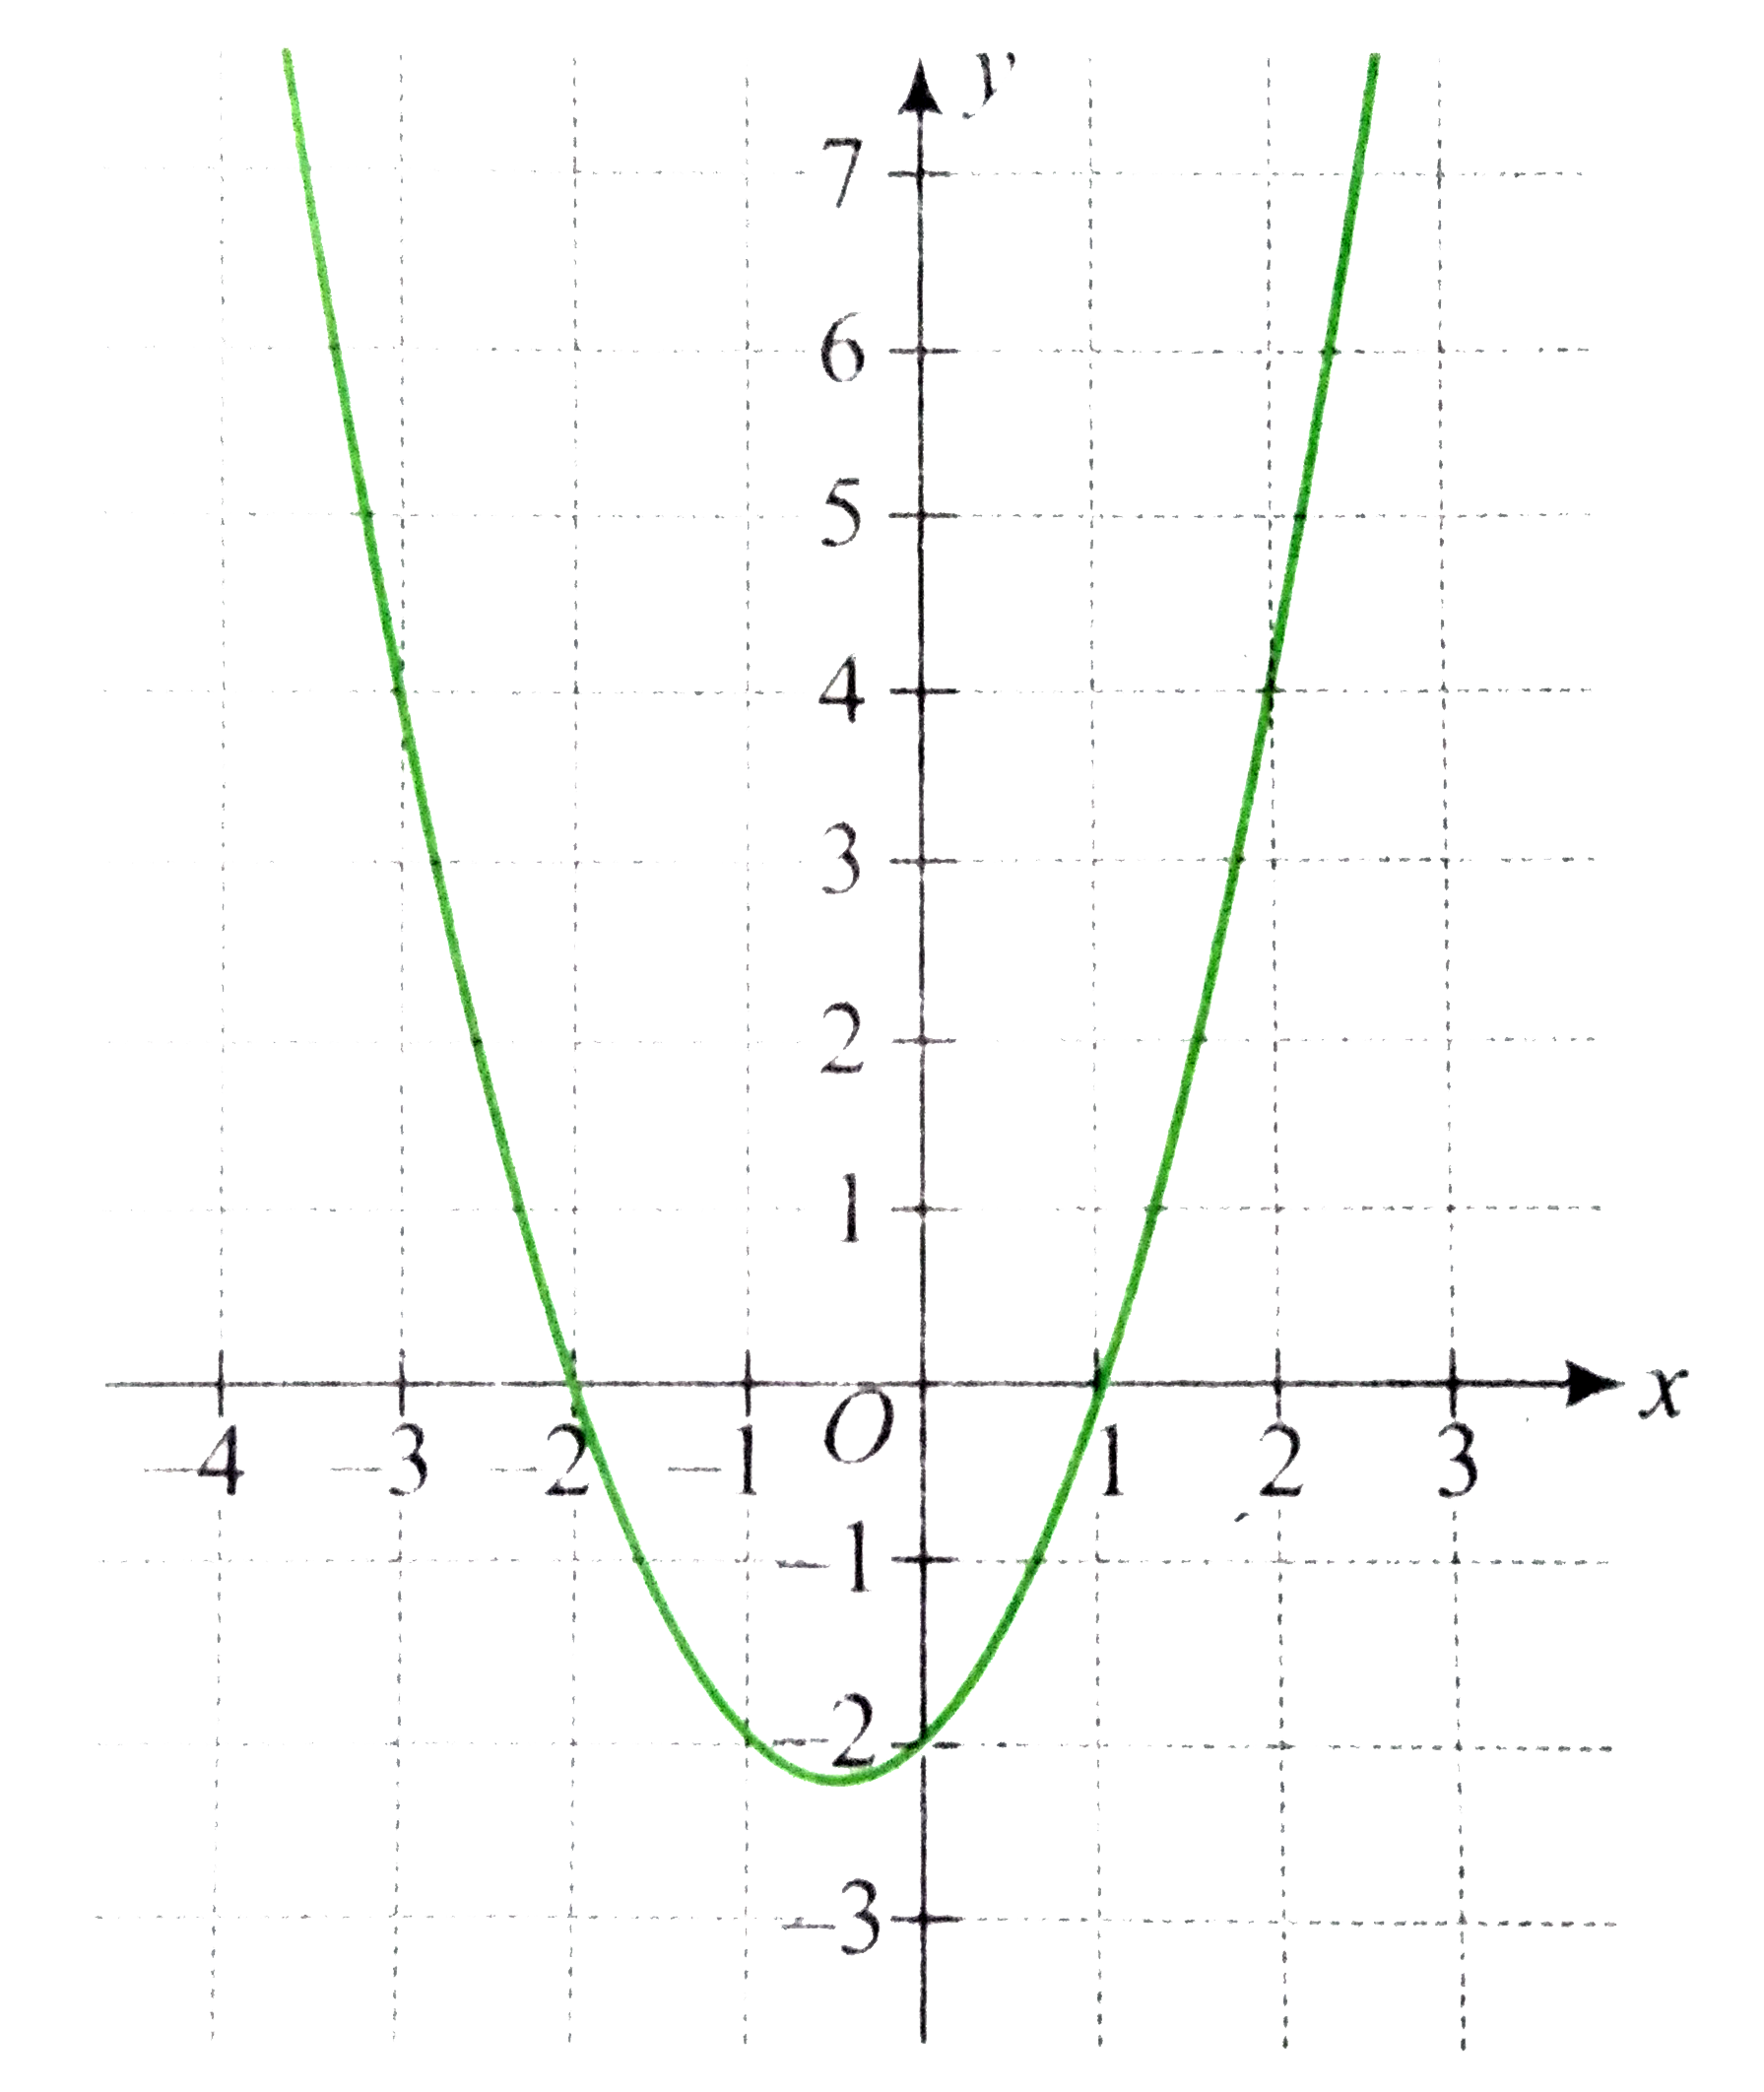
View SolutionThe graph of the function y=f(x) is as shown in the figure.

Then draw the graphs of
(i) |y|=sgn(f(x)) (ii) |y|=|f(x∣)|
(iii) y=xsgn(f(x))
View SolutionFind the range of the following
(i) f(x)=x2 (ii) f(x)=x
(iii) f(x)=x2+2 (iv) f(x)=x3
View SolutionFind the range of the following
(i) f(x)=x2 (ii) f(x)=x
(iii) f(x)=x2+2 (iv) f(x)=x3
View Solutionif f(x)={−1,∀x≤−1,x3∀−1≤x<1,(1−x)∀1<x<2,3−x2∀x>2} then (i)f(x)=1, (ii) limx→−1+f(x)=1 (iii) limx→2+f(x)=−1 (iv)limx→2−f(x)=0
View SolutionIf f(x)=x2 and g(x) = Ixl then find the values of:
(i) f+g, (ii) f-g, (iii) fg, (iv) 2f, (v) f2, (vi) f+3
View SolutionFind domain(i) f(x)=1x−5 (ii) f(x)=3−xx−3 (iii) f(x)=x2−1x−1 (iv) f(x)=|x−3|x−3 (v) f(x)=12−sin3x
View Solution

